. 2023 Apr;29(4):950-962.
doi: 10.1038/s41591-023-02268-w. Epub 2023 Apr 17.

Genomics of perivascular space burden unravels early mechanisms of cerebral small vessel disease

Marie-Gabrielle Duperron #  1   2 Maria J Knol #  3 Quentin Le Grand #  1 Tavia E Evans #  4   5 Aniket Mishra #  1 Ami Tsuchida #  1   6 Gennady Roshchupkin  3   5 Takahiro Konuma  7 David-Alexandre Trégouët  1 Jose Rafael Romero  8   9 Stefan Frenzel  10 Michelle Luciano  11 Edith Hofer  12   13 Mathieu Bourgey  14   15   16 Nicole D Dueker  17 Pilar Delgado  18   19 Saima Hilal  20   21   22 Rick M Tankard  23 Florian Dubost  5   24 Jean Shin  25   26 Yasaman Saba  1   27 Nicola J Armstrong  23 Constance Bordes  1 Mark E Bastin  28 Alexa Beiser  8   9   29 Henry Brodaty  30   31 Robin Bülow  32 Caty Carrera  33 Christopher Chen  20   21   34 Ching-Yu Cheng  35   36   37   38 Ian J Deary  11 Piyush G Gampawar  27 Jayandra J Himali  8   9   29   39   40 Jiyang Jiang  30 Takahisa Kawaguchi  41 Shuo Li  9   29 Melissa Macalli  1 Pascale Marquis  14   15   16 Zoe Morris  42 Susana Muñoz Maniega  28   43 Susumu Miyamoto  44 Masakazu Okawa  45 Matthew Paradise  30 Pedram Parva  9   46   47 Tatjana Rundek  48   49 Muralidharan Sargurupremraj  1 Sabrina Schilling  1 Kazuya Setoh  41   50 Omar Soukarieh  1 Yasuharu Tabara  41   50 Alexander Teumer  51 Anbupalam Thalamuthu  30 Julian N Trollor  30   52 Maria C Valdés Hernández  28   53 Meike W Vernooij  3   5 Uwe Völker  54 Katharina Wittfeld  10   55 Tien Yin Wong  35   56 Margaret J Wright  57   58 Junyi Zhang  59 Wanting Zhao  35   60 Yi-Cheng Zhu  59 Helena Schmidt  27 Perminder S Sachdev  30   61 Wei Wen  30 Kazumichi Yoshida  45 Anne Joutel  62 Claudia L Satizabal  8   9   39   40 Ralph L Sacco  48   49   63   64   65 Guillaume Bourque  14   15   16 CHARGE consortiumMark Lathrop  14   15 Tomas Paus  66   67   68   69 Israel Fernandez-Cadenas  33   70 Qiong Yang  9   29 Bernard Mazoyer  6   71 Philippe Boutinaud  72 Yukinori Okada  7   73   74   75   76 Hans J Grabe  10   55 Karen A Mather  30   77 Reinhold Schmidt  12 Marc Joliot  6 M Arfan Ikram  3 Fumihiko Matsuda  41 Christophe Tzourio  1   78 Joanna M Wardlaw  28   43   53 Sudha Seshadri  8   9   39   40 Hieab H H Adams  79   80   81 Stéphanie Debette  82   83
Collaborators, Affiliations

Genomics of perivascular space burden unravels early mechanisms of cerebral small vessel disease

Marie-Gabrielle Duperron et al. Nat Med. 2023 Apr.

Abstract

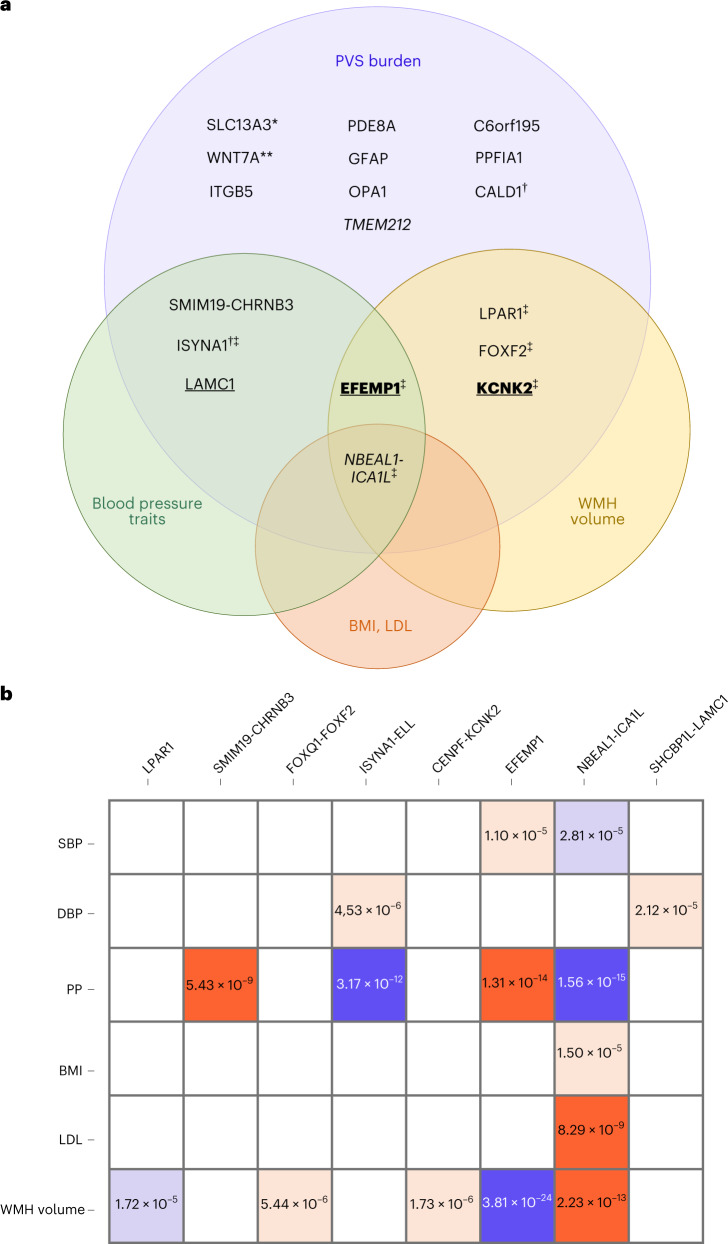
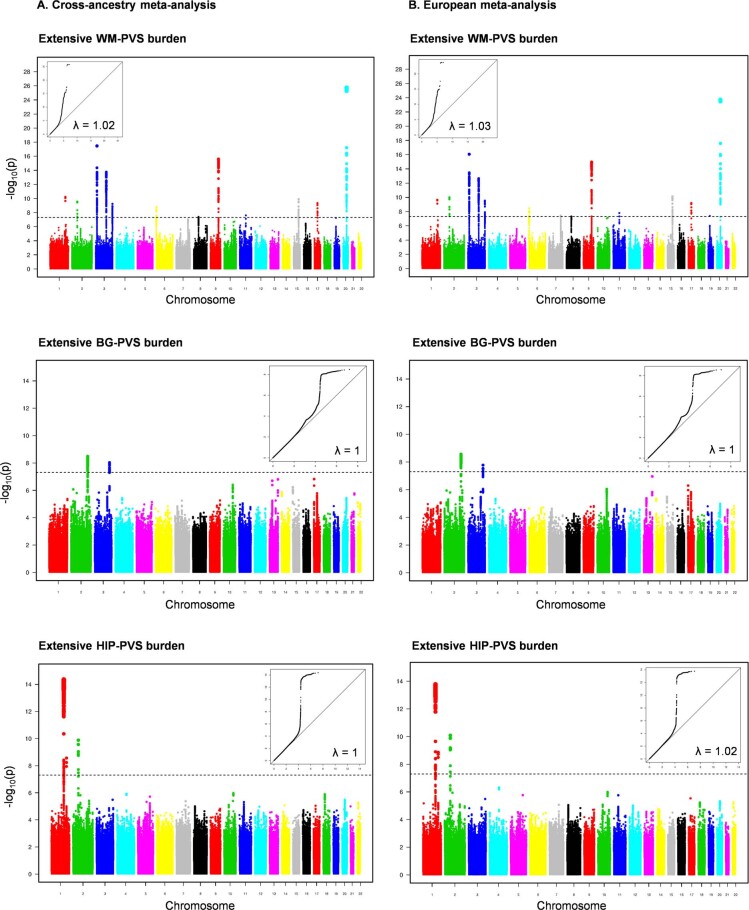
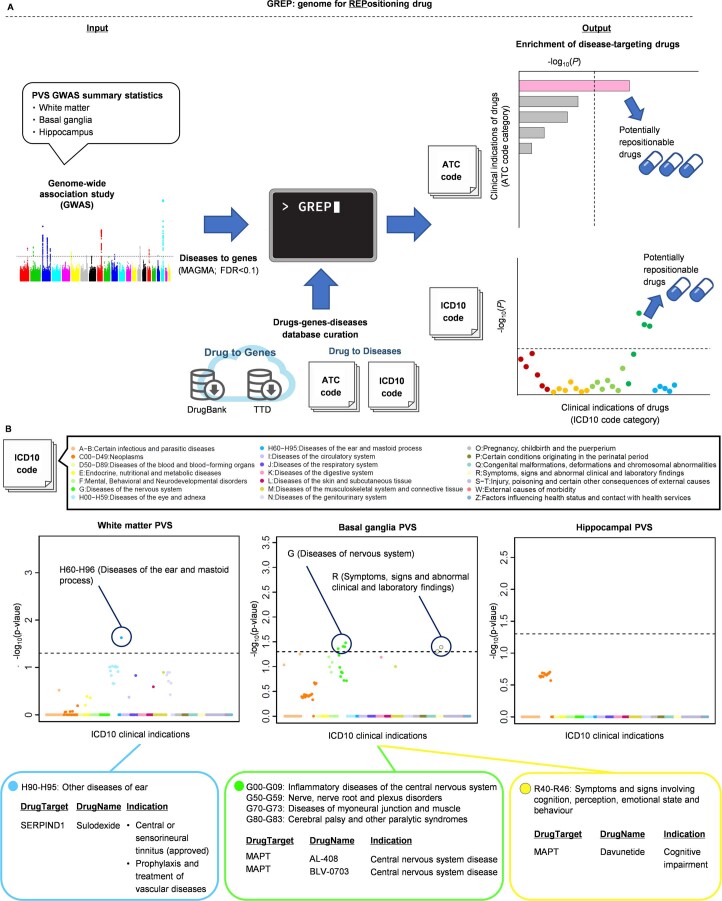
Perivascular space (PVS) burden is an emerging, poorly understood, magnetic resonance imaging marker of cerebral small vessel disease, a leading cause of stroke and dementia. Genome-wide association studies in up to 40,095 participants (18 population-based cohorts, 66.3 ± 8.6 yr, 96.9% European ancestry) revealed 24 genome-wide significant PVS risk loci, mainly in the white matter. These were associated with white matter PVS already in young adults (N = 1,748; 22.1 ± 2.3 yr) and were enriched in early-onset leukodystrophy genes and genes expressed in fetal brain endothelial cells, suggesting early-life mechanisms. In total, 53% of white matter PVS risk loci showed nominally significant associations (27% after multiple-testing correction) in a Japanese population-based cohort (N = 2,862; 68.3 ± 5.3 yr). Mendelian randomization supported causal associations of high blood pressure with basal ganglia and hippocampal PVS, and of basal ganglia PVS and hippocampal PVS with stroke, accounting for blood pressure. Our findings provide insight into the biology of PVS and cerebral small vessel disease, pointing to pathways involving extracellular matrix, membrane transport and developmental processes, and the potential for genetically informed prioritization of drug targets.


Conflict of interest statement

The authors declare no competing interests.

Figures

Fig. 1
Fig. 1. Illustration of extensive PVS burden and results of the cross-ancestry PVS GWAS meta-analysis, MTAG analysis and gene-based test.
a, Extensive PVS burden (arrows) in WM (top, WM-PVS), BG (middle, BG-PVS) and hippocampus (bottom, HIP-PVS) on T1-weighted axial magnetic resonance images. b, Circular Manhattan plot. The inner circle corresponds to the cross-ancestry GWAS meta-analyses results, the middle circle to the results of the MTAG analysis and the outer circle to gene-based test results. Results for WM-PVS are in blue, for BG-PVS in purple and for HIP-PVS in green. The gray line corresponds to the genome-wide significance threshold (P = 5 × 10−8, two-sided, correcting for multiple testing at the genome-wide level).
Fig. 2
Fig. 2. Association of PVS loci with vascular risk factors and other MRI markers of cSVD.
a, Venn diagram displaying significant association of genome-wide significant risk loci for PVS burden with vascular risk factors and other MRI markers of cSVD: in italics for BG-PVS; underlined for HIP-PVS; underlined and in bold for HIP- and WM-PVS; all others for WM-PVS only (P < 3.3 × 10−5, two-sided, correcting for multiple testing (21 independent phenotypes, 3 PVS locations and 24 independent loci)); *6 independent loci; **2 independent loci; genome-wide significant in Europeans only; in colocalization analyses the posterior probability PP4 was higher than 75% for these loci (only with WMH at NBEAL1-ICA1L). Exact P values are provided in Supplementary Table 16. b, Direction of association and level of significance of pleiotropic SNPs displayed in a: in red when the risk allele for extensive PVS burden is positively associated with the trait, in blue when the PVS risk allele is negatively associated with the trait (unexpected direction), in dark red and dark blue for genome-wide significant associations and in light red and light blue for significant association after multiple-testing correction (P < 3.3 × 10−5, two-sided, correcting for multiple testing (21 independent phenotypes, 3 PVS locations and 24 independent loci)). PP, pulse pressure; BMI, body mass index; LDL, LDL cholesterol.
Fig. 3
Fig. 3. Genetic correlations of extensive PVS burden with risk factors, neurological diseases and other MRI markers of brain aging.
ac, Genetic correlation using LD-score regression of extensive PVS burden with putative risk factors (a), neurological diseases (b) and other MRI markers of brain aging (c); two-sided exact P values are provided for nominally significant results (*P < 0.05) and significant results after multiple-testing correction (**P < 7.9 × 10−4, correcting for 21 independent phenotypes and the three PVS locations); full results are provided in Supplementary Table 9. Larger colored squares correspond to more significant P values and the colors represent the direction of the genetic correlation (positive in red, negative in blue). HDL, high-density lipoprotein; amygdala, accumbens (nucleus), caudate (nucleus), pallidum, and putamen correspond to the volumes of these subcortical structures.
Fig. 4
Fig. 4. Transcriptome-wide significant genes with extensive PVS burden.
We used precomputed functional weights from 22 publicly available gene expression reference panels from brain (GTEx v7, CommonMind Consortium (CMC)), peripheral nerve tissues (GTEx v7), heart and arteries (GTEx v7), and blood (Netherlands Twin Registry (NTR) and Young Finns Study (YFS)). Transcriptome-wide significant genes (eGenes) and the corresponding eQTLs were determined using Bonferroni correction, based on the average number of features (4,235 genes) tested across all tissues and correcting for the three independent PVS locations (P < 3.93 × 10−6). *Significant result in the TWAS and conditional analyses; **significant result in the TWAS and conditional analyses, and with a COLOC PP4 > 0.75; eGenes for loci identified in the GWAS (), gene-based test () or both GWAS and gene-based test (§).
Extended Data Fig. 1
Extended Data Fig. 1. Manhattan and QQ plots of extensive PVS burden in the cross-ancestry and European meta-analyses.
Manhattan and Quantile-Quantile (QQ) plots of the p-values (observed versus expected) in the cross-ancestry (A) and European (B) GWAS meta-analyses are presented along with the genomic inflation factor (λ). For QQ plots the observed -log10(p) is represented in the y-axis and the expected -log10(p) in x-axis. The dotted line corresponds to the genome-wide significance threshold (p = 5×10⁻⁸, two sided). PVS indicates perivascular spaces; WM, white matter; BG, basal ganglia; HIP, hippocampus.
Extended Data Fig. 2
Extended Data Fig. 2. Two-sample Mendelian randomization analysis between putative risk factors and extensive PVS burden.
Two-sample Mendelian randomization was conducted using European PVS GWAS summary statistics (N = 38,598 (WM-PVS), N = 38,903 (BG-PVS) and N = 38,871 (HIP-PVS)), combined with summary statistics for lacunes (N = 1,715 cases / N = 15,096 controls) and WMH volume (N = 48,454) in MTAG, for the outcomes and European GWAS summary statistics for blood pressure traits (N = 757,601) to generate instruments for exposures (Supplementary Tables 1 and 29). Only significant associations after multiple testing correction (p < 1.19×10⁻³) in GSMR are shown. Each dot (or triangle if p < 1.19×10⁻³) represents the beta estimate from Mendelian randomization with lines representing the 95% confidence interval. Two-sided p-values of GSMR are reported. PVS indicates perivascular spaces; WM, white matter; BG, basal ganglia; HIP, hippocampus; MTAG, multi-trait analysis of genome-wide association summary statistics; DBP, diastolic blood pressure; PP, pulse pressure; SBP, systolic blood pressure; NS, not significant; GSMR, Generalised Summary-data-based Mendelian Randomisation; IVW, Inverse variance weighted; 2SMR, Two-SampleMR.
Extended Data Fig. 3
Extended Data Fig. 3. Two-sample Mendelian randomization analysis between extensive PVS burden and neurological traits.
Two-sample Mendelian randomization was conducted using European GWAS summary statistics for any stroke (N = 40,585 cases / N = 406,111 controls), ischemic stroke (N = 34,217 cases / N = 400,201 controls) and small vessel stroke (N = 5,386 cases / N = 254,558 controls) for outcomes and European PVS GWAS summary statistics (N = 38,598 (WM-PVS), N = 38,903 (BG-PVS) and N = 38,871 (HIP-PVS)), combined with summary statistics for lacunes (N = 1,715 cases / N = 15,096 controls) and WMH volume (N = 48,454) in MTAG, to generate instruments for exposures (Supplementary Tables 1 and 29). Only significant associations after multiple testing correction (p < 1.19×10⁻³) in GSMR are shown. Each dot (or triangle if p < 1.19×10⁻³) represents the beta estimate from Mendelian randomization with lines representing the 95% confidence interval. Two-sided p-values of GSMR are reported. PVS indicates perivascular spaces; WM, white matter; BG, basal ganglia; HIP, hippocampus; MTAG, multi-trait analysis of genome-wide association summary statistics; NS, not significant; GSMR, Generalised Summary-data-based Mendelian Randomisation; IVW, Inverse variance weighted; 2SMR, Two-SampleMR.
Extended Data Fig. 4
Extended Data Fig. 4. Enrichment of PVS risk loci in genes mutated in OMIM syndromes.
Enrichment of all perivascular spaces (PVS) loci (left) and WM-PVS loci only (right) in genes mutated in OMIM syndromes associated with white matter hyperintensities, leukodystrophy, leukoencephalopathy, according to distance from the lead variant; * p < 0.05; ** p < (0.05/5); *** p < (0.05/5/2). Exact p-values for all PVS loci: p = 0.041 (genes with intragenic SNPs), p = 9,27×10−06 (genes with intragenic lead SNPs); exact p-values for WM-PVS loci only: p = 0,018 (genes within 10 kb distance), p = 0.008 (genes with intragenic SNPs), p = 8,61×10−08 (genes with intragenic lead SNPs), full results are provided in Supplementary Table 22.
Extended Data Fig. 5
Extended Data Fig. 5. Brain expression pattern across the lifespan of genes near genome-wide significant PVS loci that are also identified in the TWAS and peaking in the pre-natal period (UMPS and LAMC1).
The figure displays brain expression patterns across the lifespan of the 2 significant PVS TWAS-COLOC genes from genome-wide significant PVS GWAS loci peaking in the pre-natal period (UMPS for WM-PVS and LAMC1 for HIP-PVS) (see Supplementary Table 4 for brain expression pattern across the lifespan of other genes). The spatio-temporal gene expression level is plotted as log2-transformed exon array signal intensity (y-axis) against the post conception days (x-axis) as provided by the Human Brain Transcriptome project database. Periods of human development and adulthood are indicated by vertical dashed lines: 4-8 post conception weeks [PCW] (period 1), 8-10 PCW (period 2), 10-13 PCW (period 3), 13-16 PCW (period 4), 16-19 PCW (period 5), 19-24 PCW (period 6), 24-38 PCW (period 7), birth-6 postnatal months (period 8), 6-12 postnatal months (period 9), 1-6 years (period 10), 6-12 years (period 11), 12-20 years (period 12), 20-40 years (period 13), 40-60 years (period 14), and 60 years + (period 15). The boundary between pre- and postnatal periods is indicated by the solid vertical line. Each colored point represents the expression level of each gene across 16 anatomical brain regions and ages. Brain structure includes 11 neocortical areas (NCX, blue), and 5 subcortical regions: hippocampus (HIP, cyan), amygdala (AMY, orange), striatum (STR, black), mediodorsal nucleus of thalamus (MD, dark green), and cerebellar cortex (CBC, red). Neocortical areas include orbital prefrontal cortex (OFC), dorsolateral prefrontal cortex (DFC), ventrolateral prefrontal cortex (VFC), medial prefrontal cortex (MFC), primary motor cortex (M1C), primary somatosensory cortex (S1C), posterior inferior parietal cortex (IPC), primary auditory cortex (A1C), posterior superior temporal cortex (STC), inferior temporal cortex (ITC), and primary visual cortex (V1C).
Extended Data Fig. 6
Extended Data Fig. 6. Enrichment of PVS genes in targets of drugs validated in other indications (Genome for REPositioning drugs, using ICD10 codes).
Using the Genome for REPositioning drugs (GREP) software (A), we found a significant enrichment of BG-PVS genes in targets of drugs for diseases of the nervous system (ICD10 codes G50-G59, G70-G73, and G80-G83, OR = 51.0, 49.7, and 60.4, p = 3.90×10⁻², 4.00×10⁻², and 3.32×10⁻²) and for symptoms and signs involving cognition, perception, emotional state and behaviour (ICD10 codes R40-R46, OR = 48.4, p = 4.10×10⁻²), driven by MAPT (chr17q21.31), a target for davunetide (B). We also found a significant enrichment of HIP-PVS genes in targets of drugs for diseases of the ear (ICD10 codes H90-H95, OR = 57.6, p = 2.34×10⁻²), driven by SERPIND1 (chr22q11.21) a target for sulodexide, also used for the prophylaxis and treatment of vascular diseases with increased risk of thrombosis (B). PVS indicates perivascular spaces; ATC, Anatomical Therapeutic Chemical classification; ICD10, the 10th revision of the International Statistical Classification of Diseases and Related Health Problems; TTD, Therapeutic Target Database.
Extended Data Fig. 7
Extended Data Fig. 7. Enrichment of PVS genes in targets of drugs validated in other indications (Genome for REPositioning drugs, using ATC codes).
We found a significant enrichment of BG-PVS genes in targets for antiinfectives for systemic use (ATC J01, OR = 252.4, P = 8.85×10⁻³), driven by CRHR1 (chr17q21.31), a target for telavancin (A, B); of note, CRHR1 antagonists were shown to attenuate blood brain barrier permeability, cortical vascular hyperpermeability and tight junction disruption. ATC indicates Anatomical Therapeutic Chemical classification.
Extended Data Fig. 8
Extended Data Fig. 8. Enrichment of PVS genes in targets of drugs validated in other indications (Trans-Phar).
We used the Integration of Transcriptome-wide Association Study and Pharmacological Database (Trans-Phar) software, leveraging TWAS on all GTEx v7 tissues and a database of compound-regulated gene expression (C-map) (Methods). A TWAS using FOCUS, which demonstrates fine-mapping of causal gene sets from TWAS results, and 27 tissues in the GTEx v7 database (corresponding to defined 13 tissue-cell-type categories assigned by the 27 tissues in GTEx v7 database and 77 LINCS CMap L1000 library cell types) was performed to identify up- and down-regulated genes in participants with extensive PVS burden, and select the top 10% genes with the highest expression variation. We observed significant enrichment of HIP-PVS in drugs for vascular diseases, including simvastatin (lipid-lowering drug, p = 1.64×10⁻⁴), vincamine (vasodilator increasing cerebral blood flow, p = 2.87×10⁻⁴), and macitentan (used for pulmonary arterial hypertension, p = 7.46×10⁻⁴). PVS indicates perivascular spaces.

Comment in

References

    1. Pollock H, Hutchings M, Weller RO, Zhang ET. Perivascular spaces in the basal ganglia of the human brain: their relationship to lacunes. J. Anat. 1997;191:337–346. doi: 10.1046/j.1469-7580.1997.19130337.x. - DOI - PMC - PubMed
    1. Wardlaw JM, et al. Perivascular spaces in the brain: anatomy, physiology and pathology. Nat. Rev. Neurol. 2020;16:137–153. doi: 10.1038/s41582-020-0312-z. - DOI - PubMed
    1. Wardlaw JM, et al. Neuroimaging standards for research into small vessel disease and its contribution to ageing and neurodegeneration. Lancet Neurol. 2013;12:822–838. doi: 10.1016/S1474-4422(13)70124-8. - DOI - PMC - PubMed
    1. Jessen NA, Munk ASF, Lundgaard I, Nedergaard M. The glymphatic system: a beginner’s guide. Neurochem. Res. 2015;40:2583–2599. doi: 10.1007/s11064-015-1581-6. - DOI - PMC - PubMed
    1. Sargurupremraj M, et al. Cerebral small vessel disease genomics and its implications across the lifespan. Nat. Commun. 2020;11:6285. doi: 10.1038/s41467-020-19111-2. - DOI - PMC - PubMed

Publication types

MeSH terms