. 2023 May;8(5):787-802.
doi: 10.1038/s41564-023-01355-5. Epub 2023 Apr 17.

The gut microbiota contributes to the pathogenesis of anorexia nervosa in humans and mice

Affiliations

The gut microbiota contributes to the pathogenesis of anorexia nervosa in humans and mice

Yong Fan et al. Nat Microbiol. 2023 May.

Abstract

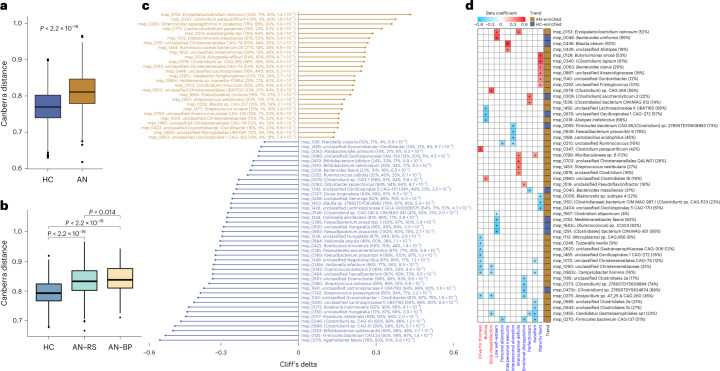
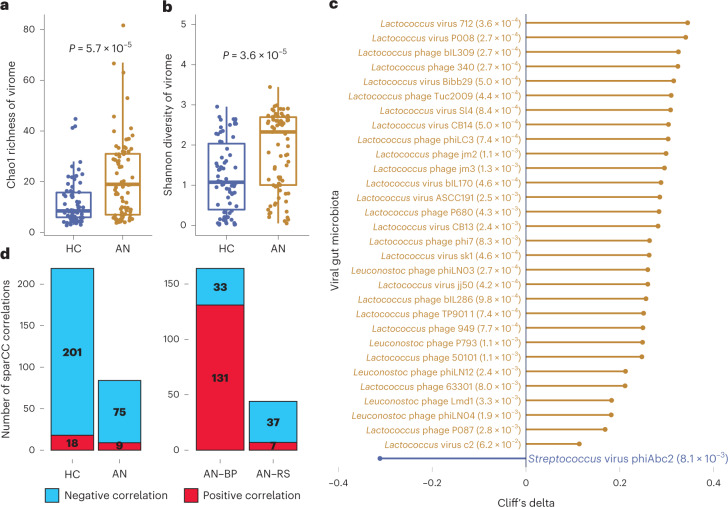
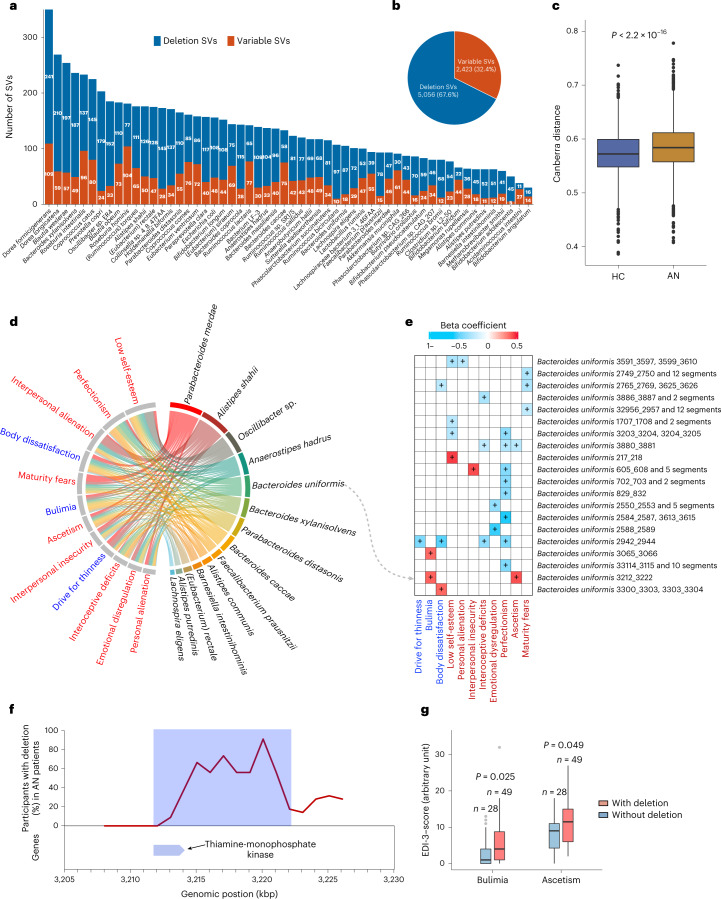
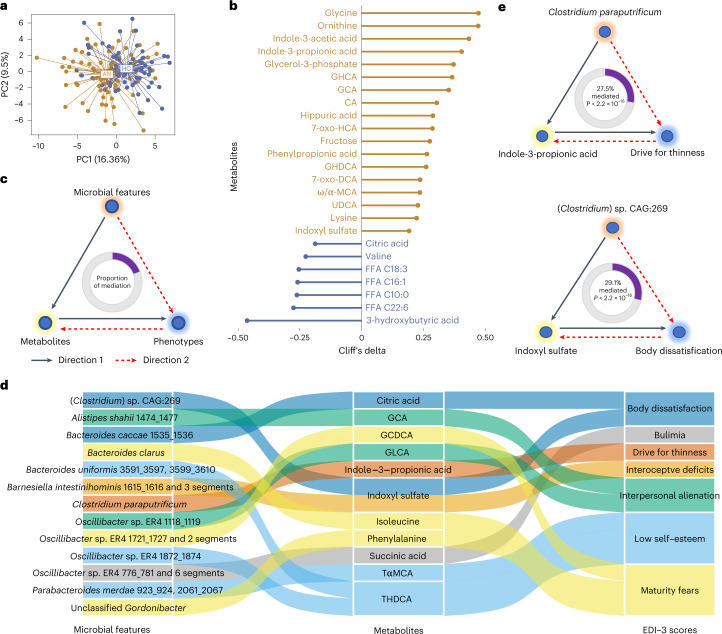
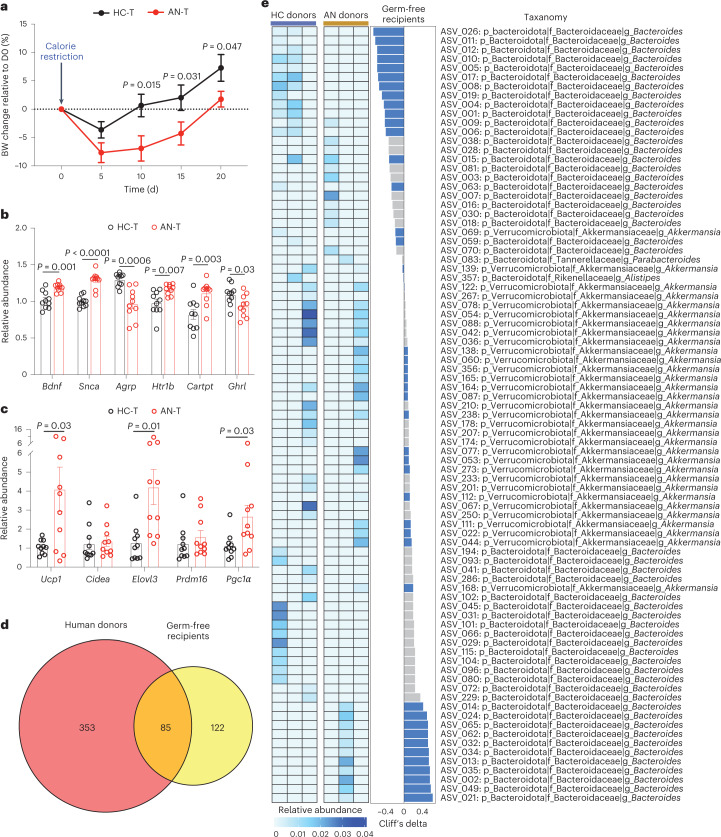
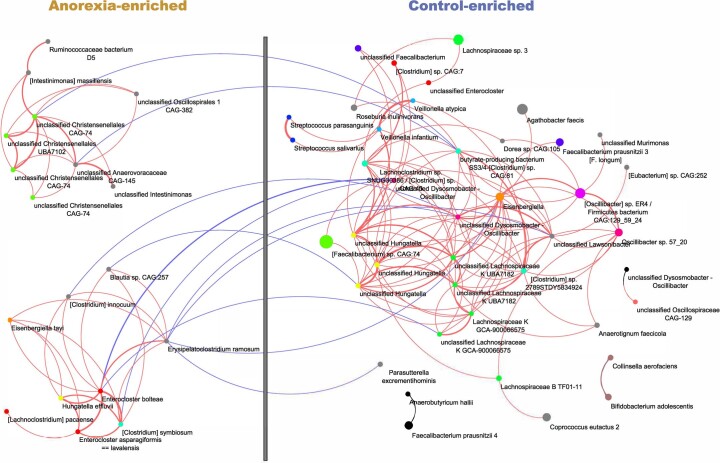
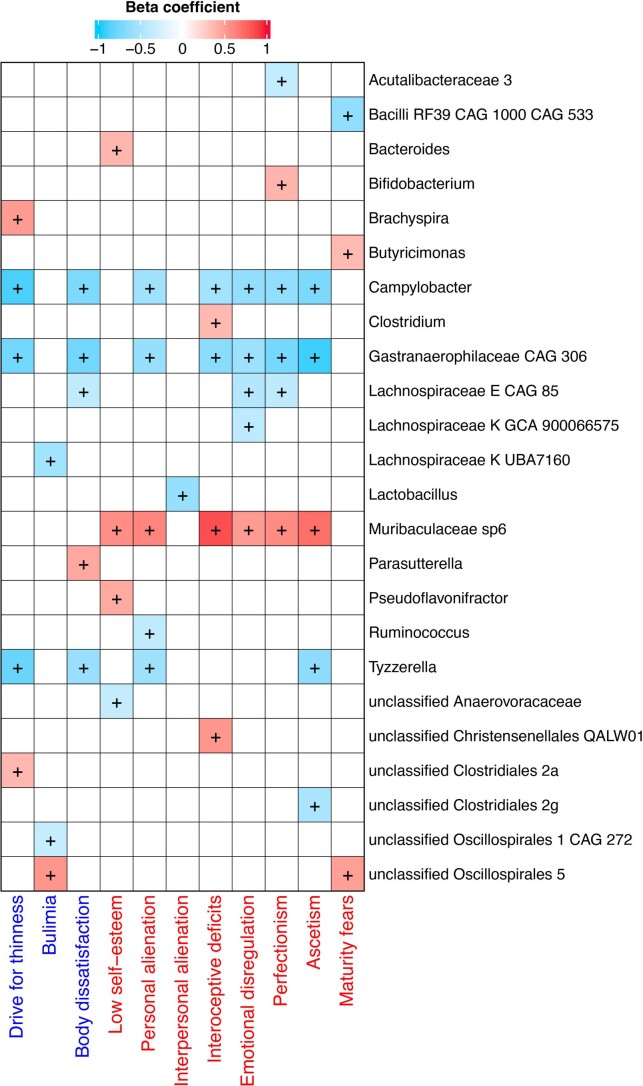
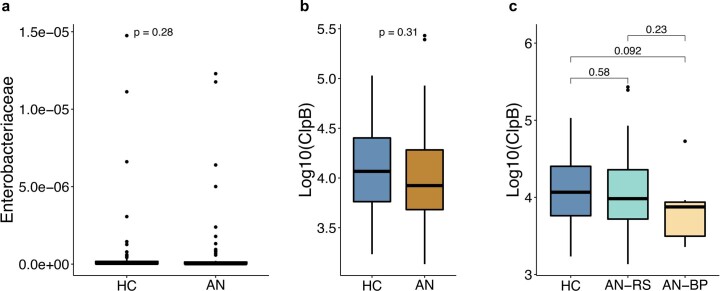
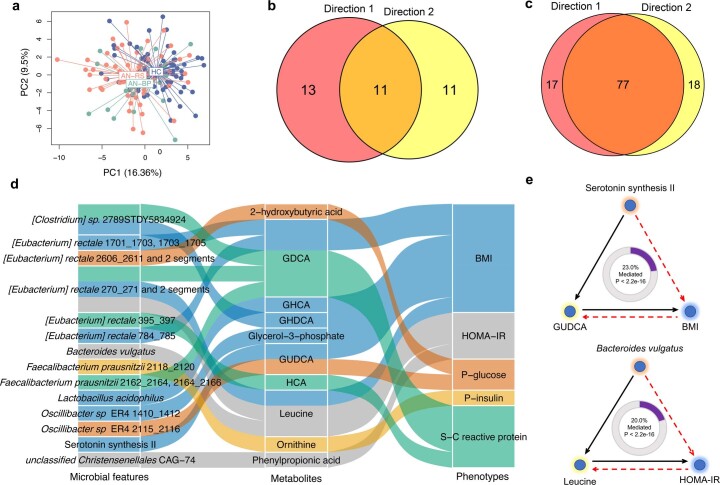
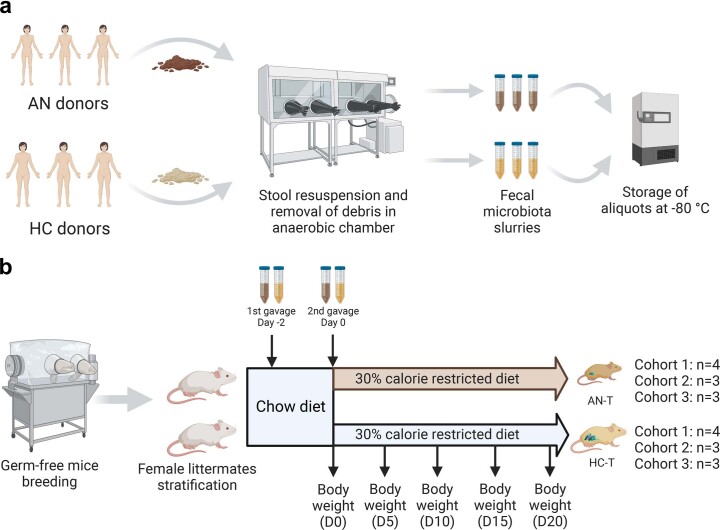
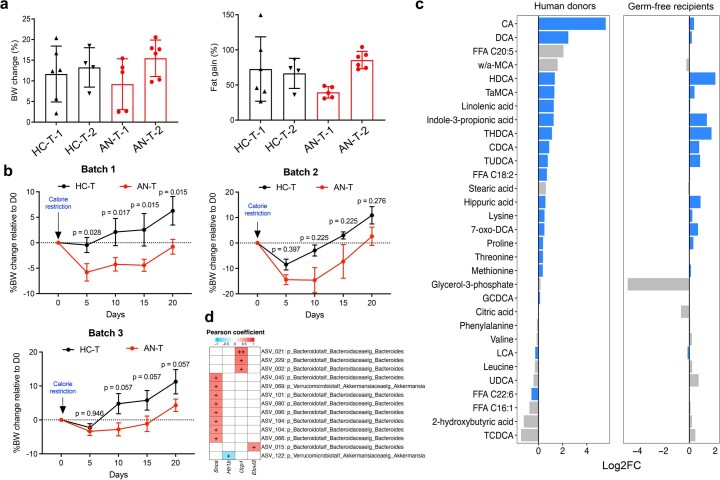
Anorexia nervosa (AN) is an eating disorder with a high mortality. About 95% of cases are women and it has a population prevalence of about 1%, but evidence-based treatment is lacking. The pathogenesis of AN probably involves genetics and various environmental factors, and an altered gut microbiota has been observed in individuals with AN using amplicon sequencing and relatively small cohorts. Here we investigated whether a disrupted gut microbiota contributes to AN pathogenesis. Shotgun metagenomics and metabolomics were performed on faecal and serum samples, respectively, from a cohort of 77 females with AN and 70 healthy females. Multiple bacterial taxa (for example, Clostridium species) were altered in AN and correlated with estimates of eating behaviour and mental health. The gut virome was also altered in AN including a reduction in viral-bacterial interactions. Bacterial functional modules associated with the degradation of neurotransmitters were enriched in AN and various structural variants in bacteria were linked to metabolic features of AN. Serum metabolomics revealed an increase in metabolites associated with reduced food intake (for example, indole-3-propionic acid). Causal inference analyses implied that serum bacterial metabolites are potentially mediating the impact of an altered gut microbiota on AN behaviour. Further, we performed faecal microbiota transplantation from AN cases to germ-free mice under energy-restricted feeding to mirror AN eating behaviour. We found that the reduced weight gain and induced hypothalamic and adipose tissue gene expression were related to aberrant energy metabolism and eating behaviour. Our 'omics' and mechanistic studies imply that a disruptive gut microbiome may contribute to AN pathogenesis.


Conflict of interest statement

F.B. is a shareholder in Implexion Pharma. The other authors declare no competing interests.

Figures

Fig. 1
Fig. 1. Alterations in gut bacterial species in AN cases compared to healthy controls, and associations with eating disorder scores.
a,b Box plot (line, median; box, interquartile range (IQR); whiskers, 1.5× IQR) of β-diversity of AN (n = 77) and HC (n = 70) gut microbiota (a) and of two AN subtypes (AN-RS n = 56, AN-BP n = 21) and HC gut microbiota (b) at bacterial species level (Canberra distance). Statistical significance of differences between two groups was determined by Wilcoxon rank-sum test (two-sided). c, Significantly contrasted bacterial species between AN and HC. Differences in abundance were detected using the metadeconfoundR pipeline where covariates including age, BMI, smoking and multiple drug intake were corrected. Cliff’s delta values give estimates of effect size. For each contrasted MSP, prevalence in the whole cohort, HC, AN, and Padj are given next to the MSP annotation. d, Heat map showing that gut bacterial species are linked to eating disorder scores in AN cases, using a linear regression model where age, BMI, smoking and multiple drug intake were defined as covariates and adjusted for. Variables in specific eating disorder scale are marked in blue, and general psychological scale is marked in red. Right panel to the heat map indicates the direction of each variable. For each MSP, prevalence in AN is given next to the MSP annotation. +, Padj < 0.05 by Benjamini-Hochberg method (see for exact P values). Source data
Fig. 2
Fig. 2. The viral gut microbiota differs between AN cases and controls.
a,b, Box plot (line, median; box, IQR; whiskers, 1.5× IQR) of changes in Chao1 richness (a) and Shannon diversity (b) of the viral gut microbiota between AN (n = 77) and HC (n = 70) at viral species level. Significance was examined by two-sided Wilcoxon rank-sum test (a,b). c, Cliff’s delta values of contrasted gut viral species between AN and HC with Padj < 0.05 by Benjamini-Hochberg correction (given next to the viral annotation). The differential species were identified by metadeconfoundR pipeline where impacts of cofactors including age, smoking and multiple drug intake were deconfounded. d, Difference in number of trans-kingdom ecologic correlations between the viral and bacterial gut microbiota in AN (n = 77) compared to HC (n = 70), and between two AN subtypes (AN-RS n = 56, AN-BP n = 21) using the SparCC algorithm. Source data
Fig. 3
Fig. 3. Predicted functional potentials of the bacterial gut microbiome in AN cases and healthy control participants.
a, Cliff’s delta effect size of contrasted functional modules between AN (n = 77) and HC (n = 70) using the metadeconfoundR pipeline where interferences from covariates including age, BMI, smoking and multiple drug intake were corrected. Gold bars, functional modules more abundant in AN; blue bars, functional modules more abundant in HC. For each contrasted module, P value after Benjamini-Hochberg correction is given next to the module annotation. b, Heat map of the associations between clinical variables and functional potentials of gut bacteriome by linear regression model where impacts of covariates including age, smoking and multiple drug intake were deconfounded. + indicates P < 0.05 by Benjamini-Hochberg correction (see for exact P values). Source data
Fig. 4
Fig. 4. Structural variations in the bacterial and archaeal gut microbiota in AN cases and healthy controls.
a, Number of SVs of each bacterial or archaeal species in 147 (77 cases and 70 controls) study participants. For each species, the number of deletion and variable SVs are given. b, Pie chart showing the total identified SVs numbers. c, Box plot (line, median; box, IQR; whiskers, 1.5× IQR) of β-diversity (Canberra distance) of SV-based genetic composition in AN (n = 77) and HC (n = 70) bacteriome. P value was determined by two-sided Wilcoxon rank-sum test. d, Chord diagram showing significant associations between eating disorder scores and bacterial SVs after adjusting for age, BMI, smoking and multiple drug intake. e, Heat map showing the associations between SVs of Bacteroides uniformis and EDI-3 scores using linear regression model where impacts of age, BMI, smoking and multiple drug intake were deconfounded. + indicates P < 0.05 corrected by Benjamini-Hochberg (see for exact P values). In d and e, variables of eating disorder scale are coloured in blue, general psychological scale are in red, and bacterial SVs are in black. f, The deletion rate of the 10-kbp deletion SV harbouring thiamine-monophosphate kinase in B. uniformis genome in the AN group. g, Box plot (line, median; box, IQR; whiskers, 1.5× IQR) showing the EDI-3 scores in anorexia individuals with (n = 49) and without (n = 28) the 10-kbp deletion. Significance was determined by Wilcoxon rank-sum test (two-sided). Source data
Fig. 5
Fig. 5. Serum metabolites differ between AN cases and controls and may be mediating the impact of gut microbial features on eating disorder traits.
a, Principal component analysis (PCA) of the serum metabolome profile of AN cases and HC participants. b, Cliff’s delta values of contrasted metabolites between AN (n = 77) and HC (n = 70) after adjusting for age, BMI, smoking and multiple drug intake. Gold lollipops are metabolites enriched in AN, and blue lollipops show serum metabolites enriched in HC. c, Workflow for the bidirectional mediation analysis for gut microbial features, serum metabolites and host phenotypes. d, Sankey diagram showing the inferred causal relationship network of direction 1 where gut microbial features including bacterial species, gut brain/metabolic modules and bacterial genetics were treated as causal factors, metabolites are mediators, and EDI-3 scores are outcomes. e, Examples of inferred causal relationships between microbial features, metabolites and EDI-3 scores. Direction 1 means microbial features → eating disorder scores mediated by metabolites, illustrated with a black line; direction 2 means microbial features → metabolites mediated by EDI-3 scores, illustrated with a dashed red line. The proportions of mediation effects are shown at the centre of ring charts. FFA, free fatty acid. Source data
Fig. 6
Fig. 6. FMT using samples from AN donors induces AN-relevant phenotypes in GF mice.
a, Body weight (BW) change compared to the body weight at day 0 after energy-restricted diet (AN-T n = 10, HC-T, n = 10 examined over 3 independent experiments). Significance was calculated by two-way analysis of variance (ANOVA), followed by Benjamini-Hochberg post hoc test. b,c, mRNA levels of the indicated mice genes in hypothalamus (b) and inguinal white adipose tissue (c) in the faecal microbiota mouse recipients (AN-T n = 10, HC-T, n = 10, examined over 3 independent experiments). Significance between the two groups was tested using unpaired two-tailed Student’s t-test. Data are presented as mean ± s.e.m. (ac). d, Venn diagram of the identified and transferred ASVs between human donors and GF mouse recipients. e, Left: heat map of the 84 conserved ASVs in human donors. Middle: differences in the 84 conserved ASVs derived from the caecal content between AN-T and HC-T GF mouse recipients (AN-T n = 10, HC-T, n = 10, examined over 3 independent experiments). Transferred microbial alterations are marked in blue. Right: taxonomic information of ASVs. Source data
Extended Data Fig. 1
Extended Data Fig. 1. Graphical abstract of the study workflow and findings.
Workflow was created with BioRender.com.
Extended Data Fig. 2
Extended Data Fig. 2. Taxonomic differences at phylum, family and genus level and differences in enterotypes in cases with AN compared with healthy women.
a,b,e Box plot (line, median; box, interquartile range (IQR); whiskers, 1.5× IQR) of comparison between AN (gold, n = 77) and HC (blue, n = 70) of relative abundance of the 12 bacterial phyla detected in at least 10% of individuals (a), the 20 most abundant bacterial families (b), and the top 30 genera (e). Features are sorted by decreasing mean abundance. Zero values are set to 1e-10. Features colored in blue are enriched in HC group, and gold are enriched in AN group. Significance was determined by two-sided Wilcoxon rank-sum test, followed by drug-deconfounding and multiple testing correction by Benjamini-Hochberg method on all features (a,b,and e, see Source Data for exact p values). c,f, Absolute values of Cliff’s Delta effect size of families (c) and genera (f) contrasted between AN and HC after drug-deconfounding (adjusted p-value ≤ 0.1). Gold barplots indicate features more abundant in AN; blue barplots indicate features more abundant in HC (c,f). d,g, Box plot (line, median; box, IQR; whiskers, 1.5× IQR) showing β-diversity (Canberra distance) of gut bacteriome at genus level (d) and richness of Metagenomic Species Pan-genomes (MSPs) (g) between AN (gold, n = 77) and HC (blue, n = 70). Significance was determined by two-sided Wilcoxon rank-sum test (d,g). h, Upper panel demonstrates enterotype prevalence in AN (n = 77) and HC (n = 70), lower panel shows enterotype prevalence in HC and AN patients split into AN-RS (n = 56) and AN-BP (n = 21) groups. Source data
Extended Data Fig. 3
Extended Data Fig. 3. Co-occurrence network deducted from bacterial species enriched in AN cases (left) and healthy controls (right) after drug-deconfounding.
Node size and node colour represent the mean abundance and the genus of a given MSP, respectively. Genera represented by only one MSP are coloured in grey. Red and blue lines indicate positive and negative correlations, respectively. Line thickness represents the absolute correlation coefficient. Only correlations with an absolute coefficient above 0.4 are shown; MSP without any correlation above the threshold are hidden.
Extended Data Fig. 4
Extended Data Fig. 4. Heatmap showing that gut bacterial genera are linked to eating disorder scores in AN cases after drug de-confounding.
Variables in specific eating disorder scale are marked in blue, and in general psychological scale are marked in red. +, adjusted p < 0.05 (see Source Data for exact p values). Source data
Extended Data Fig. 5
Extended Data Fig. 5. Fasting plasma concentration of Caseinolytic protease B (ClpB) in control subjects and AN subtypes.
a, Relative abundance of Enterobacteriaceae family in HC (n = 70) and AN (n = 77) groups. b, Log-scale transformed fasting plasma ClpB concentration between HC (n = 70) and AN (n = 77) groups. c, Log-scale transformed fasting plasma ClpB concentration between restrictive AN (AN-RS n = 56) and binge-purge AN (AN-BP n = 21) subtypes. Significance was calculated by two-sided Wilcoxon rank-sum test between two groups (a-c). Box plots indicate median and interquartile range (IQR) and whiskers represent 1.5× IQR (a-c). Source data
Extended Data Fig. 6
Extended Data Fig. 6. Altered dynamic growth rates of bacterial species between AN (n = 77) and control (n = 70) groups.
Box plots indicate median and interquartile range (IQR), whiskers indicate 1.5× IQR. Significance was determined by two-sided Wilcoxon rank-sum test. Source data
Extended Data Fig. 7
Extended Data Fig. 7. SVs in bacterial gut microbiota from AN cases and associations with anorexia-relevant traits.
a-c, Scatterplot showing, HOMA-IR, fasting plasma insulin and glucose in individuals harboring a 1-kbp variation in the A. putredinis genome (n = 147). Significance determined by two-sided spearman correlation test corrected by false discovery rate using Benjamini and Hochberg method. Error band is linear regression line with 95% confidence band (a-c). Dots representing AN and HC individuals were colored in red and blue, respectively. d, Upper panel, standardized variability (y axis) along a genomic region of A. putredinis (x axis). Lower panel, locations (blue bar) of the gene of interest. Source data
Extended Data Fig. 8
Extended Data Fig. 8. In silico analysis using bidirectional mediation inference.
a, Principal component analysis (PCA) plot of the serum metabolome of AN subtypes, AN-BP (binge/purge anorexia), AN-RS (restrictive anorexia). b, Summary number of inferred mediation relationship for direction 1 (gut microbial features → eating disorder scores mediated by serum metabolites), direction 2 (gut microbial features → serum metabolites mediated by eating disorder scores). c, Summary number of inferred mediation relationship for direction 1 (gut microbial features → phenotypes mediated by serum metabolites), direction 2 (gut microbial features → serum metabolites mediated by phenotypes) for the whole cohort. d, Sankey diagram showing the inferred causal relationship network of direction 1 where gut microbial features including bacterial species, gut brain and metabolic modules, and bacterial genetics were treated as causal factors, serum metabolites are mediators, and metabolic traits are outcomes. e, Examples of inferred causal relationships between gut microbial features, metabolites, and host metabolic traits. Direction 1that means microbial features → metabolic traits mediated by serum metabolites is illustrated with a black line while direction 2 that means microbial features → serum metabolites mediated by metabolic traits is illustrated with a stipulated red line. The proportion of mediation effect are shown at the center of ring charts. GDCA, glycodeoxycholic acid; GHCA, glycohyocholic acid; GHDCA, glycohyodeoxycholic acid; GUDCA, glycoursodeoxycholic acid; HCA, hyocholic acid; HOMA-IR homeostatic model assessment of insulin resistance; P-, plasma; S-, serum. Source data
Extended Data Fig. 9
Extended Data Fig. 9. Workflow diagram of fecal microbiota transplantation from human donors to germ-free mice littermates.
a, Workflow for the preparation of fecal microbiota slurry. Stool (250 mg) from both anorexia (AN) and control (HC) was cut on dry ice, transferred to anaerobic chamber, and resuspended with 5 ml of LYBHI media diluted in 20% glycerol. The resuspended fecal slurries were aliquoted in cryotubes and refrozen back quickly at -80 °C until further use. All stool samples of matched AN and HC donors were prepared on the same day and frozen aliquots were stored frozen for gavage to mice. b, Experimental scheme for the GF mice transplantation study. In each independent litter study, GF female littermates at age of six weeks old were taken out of breeding isolator and were randomly assigned to receive 200 µl of fecal slurries from three AN cases or three HC subjects. Both groups of mice were housed in autoclaved individually ventilated cages and were given autoclaved chow diet and water ad libitum for two days. After two days, mice were gavaged with a second dose of fecal material from the same matched AN and HC donors as before. Thereafter, mice in both groups were single housed and subjected to 30% calorie restricted chow diet for three weeks. Water was given ad libitum during this period. Both the anorexia-transplanted (AN-T) and the normal control-transplanted (HC-T) mice were weighed every five days after the start of energy-restricted diet. Created with Biorender.com.
Extended Data Fig. 10
Extended Data Fig. 10. Effects of FMT from AN and controls to female GF mouse littermates.
a, Body weight change and fat percentage of germ-free (GF) mouse littermates (n = 21) fed with ad libitum chow diet and transplanted with microbiota from anorexia patients. b, Body weight change compared to the body weight at day 0 after energy-restricted diet for three independent experiments (n = 8, 6, and 6 for independent batches, respectively). Data are expressed as mean ± s.e.m.(a,b). Significance was calculated by two-way analysis of variance (ANOVA), followed by Benjamini-Hochberg post hoc test. c, Serum metabolome profile in human donors and GF mouse recipients fed with 30% energy-restricted diet. Data were expressed as the log2-transformed fold changes (log2FC) between AN and control groups. Positive log2FC values indicate AN-enriched metabolites, while negative log2FC values indicate HC-enriched metabolites. Serum metabolites that were persistently changed between AN and HC groups in human donors and GF mouse recipients were marked with blue bars. CA, cholic acid; DCA, deoxycholic acid; FFA, free fatty acid; w/a-MCA, ω/α-muricholic acid; HDCA, hyodeoxycholic acid; TaMCA, taurine-α-muricholic acid; CDCA, chenodeoxycholic acid; LCA, lithocholic acid; UDCA, ursodeoxycholic acid; G, glycine-conjugated bile acids; T, taurine-conjugated bile acids. d, Heat map on the left panel showing the correlation between ASVs and quantified genes in hypothalamus or subcutaneous white adipose tissue. Taxonomic information of ASVs is given on the right panel. +, p < 0.05 corrected by Benjamini-Hochberg method (see Source Data for exact p values). Source data

Comment in

  • The gut microbiome in anorexia nervosa.
    Hildebrandt T, Peyser D. Hildebrandt T, et al. Nat Microbiol. 2023 May;8(5):760-761. doi: 10.1038/s41564-023-01372-4. Nat Microbiol. 2023. PMID: 37069402 No abstract available.

References

    1. American Psychiatric Association Diagnostic and Statistical Manual of Mental Disorders 5th edn (American Psychiatric Publishing, Inc., 2013).
    1. Smink FR, Van Hoeken D, Hoek HW. Epidemiology of eating disorders: incidence, prevalence and mortality rates. Curr. Psychiatry Rep. 2012;14:406–414. doi: 10.1007/s11920-012-0282-y. - DOI - PMC - PubMed
    1. Bulik CM. The challenges of treating anorexia nervosa. Lancet. 2014;383:105–106. doi: 10.1016/S0140-6736(13)61940-6. - DOI - PubMed
    1. Winkler LA-D, Bilenberg N, Hørder K, Støving RK. Does specialization of treatment influence mortality in eating disorders?—A comparison of two retrospective cohorts. Psychiatry Res. 2015;230:165–171. doi: 10.1016/j.psychres.2015.08.032. - DOI - PubMed
    1. Støving RK, et al. Purging behavior in anorexia nervosa and eating disorder not otherwise specified: a retrospective cohort study. Psychiatry Res. 2012;198:253–258. doi: 10.1016/j.psychres.2011.10.009. - DOI - PubMed

Publication types