Three tyrosine kinase inhibitors cause cardiotoxicity by inducing endoplasmic reticulum stress and inflammation in cardiomyocytes
- PMID: 37069550
- PMCID: PMC10108821
- DOI: 10.1186/s12916-023-02838-2
Three tyrosine kinase inhibitors cause cardiotoxicity by inducing endoplasmic reticulum stress and inflammation in cardiomyocytes
Abstract
Background: Tyrosine kinase inhibitors (TKIs) are anti-cancer therapeutics often prescribed for long-term treatment. Many of these treatments cause cardiotoxicity with limited cure. We aim to clarify molecular mechanisms of TKI-induced cardiotoxicity so as to find potential targets for treating the adverse cardiac complications.
Methods: Eight TKIs with different levels of cardiotoxicity reported are selected. Phenotypic and transcriptomic responses of human cardiomyocytes to TKIs at varying doses and times are profiled and analyzed. Stress responses and signaling pathways that modulate cardiotoxicity induced by three TKIs are validated in cardiomyocytes and rat hearts.
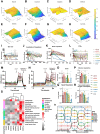
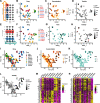
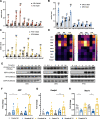
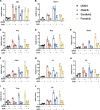
Results: Toxicity rank of the eight TKIs determined by measuring their effects on cell viability, contractility, and respiration is largely consistent with that derived from database or literature, indicating that human cardiomyocytes are a good cellular model for studying cardiotoxicity. When transcriptomes are measured for selected TKI treatments with different levels of toxicity in human cardiomyocytes, the data are classified into 7 clusters with mainly single-drug clusters. Drug-specific effects on the transcriptome dominate over dose-, time- or toxicity-dependent effects. Two clusters with three TKIs (afatinib, ponatinib, and sorafenib) have the top enriched pathway as the endoplasmic reticulum stress (ERS). All three TKIs induce ERS in rat primary cardiomyocytes and ponatinib activates the IRE1α-XBP1s axis downstream of ERS in the hearts of rats underwent a 7-day course of drug treatment. To look for potential triggers of ERS, we find that the three TKIs induce transient reactive oxygen species followed by lipid peroxidation. Inhibiting either PERK or IRE1α downstream of ERS blocks TKI-induced cardiac damages, represented by the induction of cardiac fetal and pro-inflammatory genes without causing more cell death.
Conclusions: Our data contain rich information about phenotypic and transcriptional responses of human cardiomyocytes to eight TKIs, uncovering potential molecular mechanisms in modulating cardiotoxicity. ER stress is activated by multiple TKIs and leads to cardiotoxicity through promoting expression of pro-inflammatory factors and cardiac fetal genes. ER stress-induced inflammation is a promising therapeutic target to mitigate ponatinib- and sorafenib-induced cardiotoxicity.
Keywords: Cardiotoxicity; Endoplasmic reticulum stress; Inflammation; Transcriptomics; Tyrosine kinase inhibitor.
© 2023. The Author(s).
Conflict of interest statement
None declared.
Figures


Similar articles
-
Tyrosine Kinase Inhibitor Lenvatinib Causes Cardiotoxicity by Inducing Endoplasmic Reticulum Stress and Apoptosis through Activating ATF6, IRE1α and PERK Signaling Pathways.Recent Pat Anticancer Drug Discov. 2025;20(2):168-184. doi: 10.2174/0115748928265981231204044653. Recent Pat Anticancer Drug Discov. 2025. PMID: 38994620
-
CaMKII orchestrates endoplasmic reticulum stress and apoptosis in doxorubicin-induced cardiotoxicity by regulating the IRE1α/XBP1s pathway.J Cell Mol Med. 2022 Oct;26(20):5303-5314. doi: 10.1111/jcmm.17560. Epub 2022 Sep 16. J Cell Mol Med. 2022. PMID: 36111515 Free PMC article.
-
Computational model of cardiomyocyte apoptosis identifies mechanisms of tyrosine kinase inhibitor-induced cardiotoxicity.J Mol Cell Cardiol. 2021 Jun;155:66-77. doi: 10.1016/j.yjmcc.2021.02.014. Epub 2021 Mar 3. J Mol Cell Cardiol. 2021. PMID: 33667419 Free PMC article.
-
Endoplasmic reticulum stress in doxorubicin-induced cardiotoxicity may be therapeutically targeted by natural and chemical compounds: A review.Pharmacol Res. 2021 Feb;164:105383. doi: 10.1016/j.phrs.2020.105383. Epub 2020 Dec 21. Pharmacol Res. 2021. PMID: 33348022 Review.
-
Mitochondrial Dysfunction in Cardiotoxicity Induced by BCR-ABL1 Tyrosine Kinase Inhibitors -Underlying Mechanisms, Detection, Potential Therapies.Cardiovasc Toxicol. 2023 Aug;23(7-8):233-254. doi: 10.1007/s12012-023-09800-x. Epub 2023 Jul 21. Cardiovasc Toxicol. 2023. PMID: 37479951 Review.
Cited by
-
Imatinib‑ and ponatinib‑mediated cardiotoxicity in zebrafish embryos and H9c2 cardiomyoblasts.Mol Med Rep. 2024 Oct;30(4):187. doi: 10.3892/mmr.2024.13311. Epub 2024 Sep 2. Mol Med Rep. 2024. PMID: 39219269 Free PMC article.
-
Insights into Drug Cardiotoxicity from Biological and Chemical Data: The First Public Classifiers for FDA Drug-Induced Cardiotoxicity Rank.J Chem Inf Model. 2024 Feb 26;64(4):1172-1186. doi: 10.1021/acs.jcim.3c01834. Epub 2024 Feb 1. J Chem Inf Model. 2024. PMID: 38300851 Free PMC article.
-
Insights into Drug Cardiotoxicity from Biological and Chemical Data: The First Public Classifiers for FDA DICTrank.bioRxiv [Preprint]. 2023 Oct 18:2023.10.15.562398. doi: 10.1101/2023.10.15.562398. bioRxiv. 2023. Update in: J Chem Inf Model. 2024 Feb 26;64(4):1172-1186. doi: 10.1021/acs.jcim.3c01834. PMID: 37905146 Free PMC article. Updated. Preprint.
-
Key Mechanisms of Oxidative Stress-Induced Ferroptosis in Heart Failure with Preserved Ejection Fraction and Potential Therapeutic Approaches.Rev Cardiovasc Med. 2025 Mar 25;26(3):26613. doi: 10.31083/RCM26613. eCollection 2025 Mar. Rev Cardiovasc Med. 2025. PMID: 40160560 Free PMC article. Review.
-
Overview of Oncology: Drug-Induced Cardiac Toxicity.Medicina (Kaunas). 2025 Apr 12;61(4):709. doi: 10.3390/medicina61040709. Medicina (Kaunas). 2025. PMID: 40283000 Free PMC article. Review.
References
-
- Petrikova L, Slezakova K, Sninska Z, Harvanova L, Martisova M, Hatalova A, et al. Cardiovascular events and atherogenic lipid profile in chronic myeloid leukemia patients treated with nilotinib versus imatinib. Bratisl Lek Listy. 2021;122(8):531–537. - PubMed
Publication types
MeSH terms
Substances
Grants and funding
LinkOut - more resources
Full Text Sources
Molecular Biology Databases

