. 2023 Apr 17;18(1):40.
doi: 10.1186/s13020-023-00745-5.

A novel microbial and hepatic biotransformation-integrated network pharmacology strategy explores the therapeutic mechanisms of bioactive herbal products in neurological diseases: the effects of Astragaloside IV on intracerebral hemorrhage as an example

Affiliations

A novel microbial and hepatic biotransformation-integrated network pharmacology strategy explores the therapeutic mechanisms of bioactive herbal products in neurological diseases: the effects of Astragaloside IV on intracerebral hemorrhage as an example

En Hu et al. Chin Med. .

Abstract

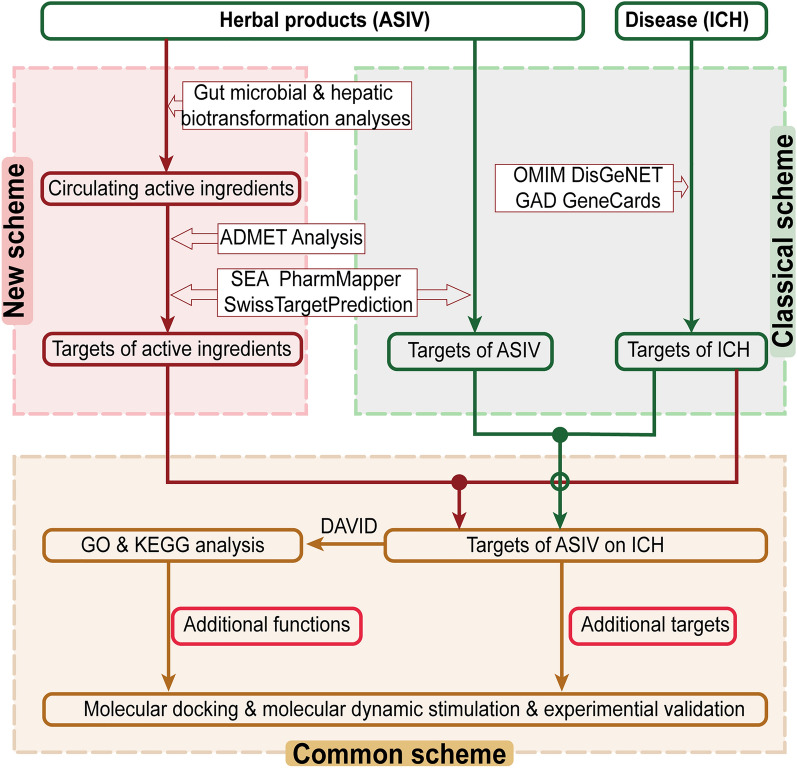
Background: The oral bioavailability and blood-brain barrier permeability of many herbal products are too low to explain the significant efficacy fully. Gut microbiota and liver can metabolize herbal ingredients to more absorbable forms. The current study aims to evaluate the ability of a novel biotransformation-integrated network pharmacology strategy to discover the therapeutic mechanisms of low-bioavailability herbal products in neurological diseases.

Methods: A study on the mechanisms of Astragaloside IV (ASIV) in treating intracerebral hemorrhage (ICH) was selected as an example. Firstly, the absorbed ASIV metabolites were collected by a literature search. Next, the ADMET properties and the ICH-associated targets of ASIV and its metabolites were compared. Finally, the biotransformation-increased targets and biological processes were screened out and verified by molecular docking, molecular dynamics simulation, and cell and animal experiments.

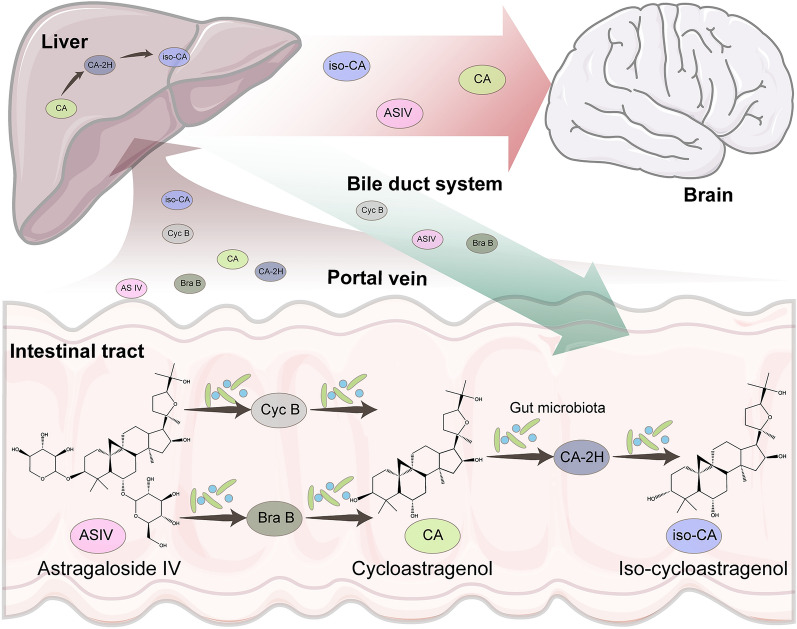
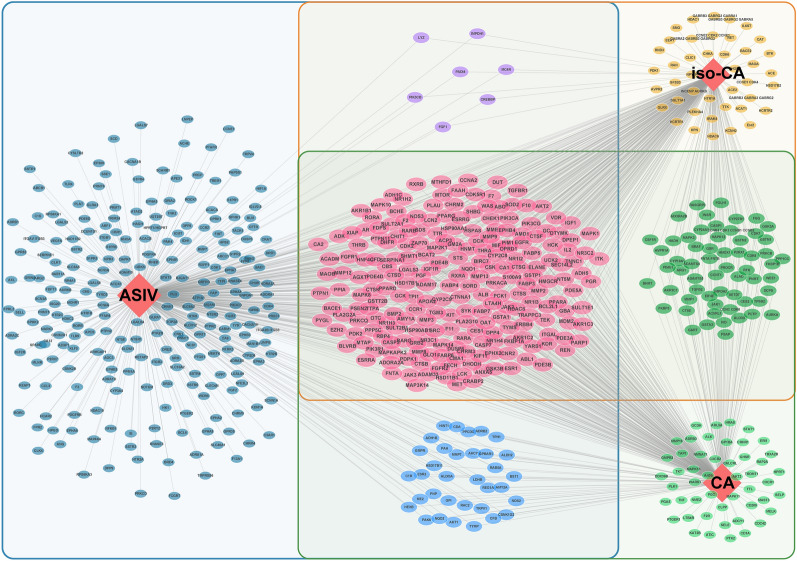
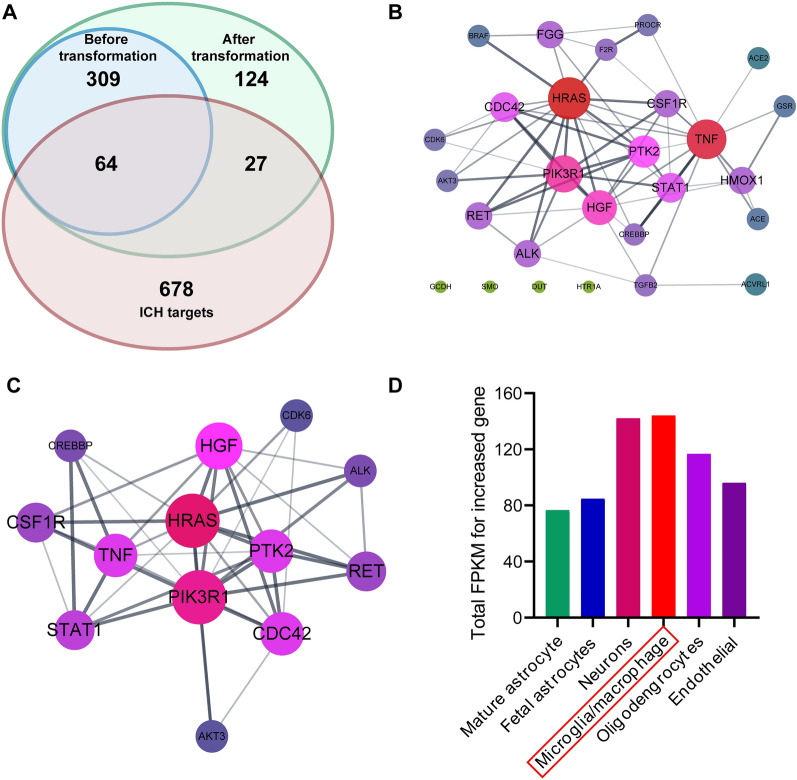
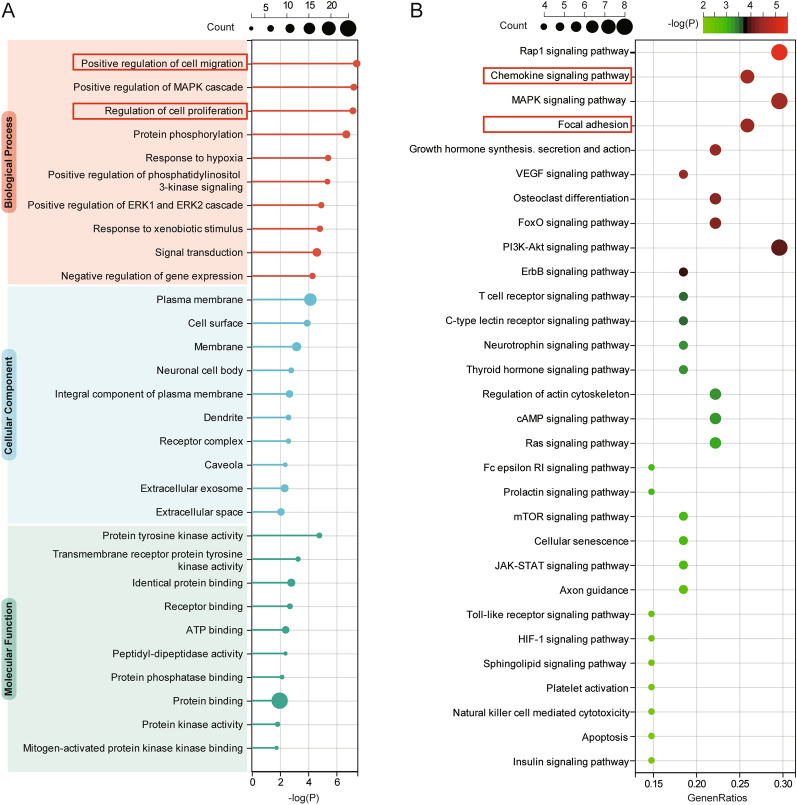
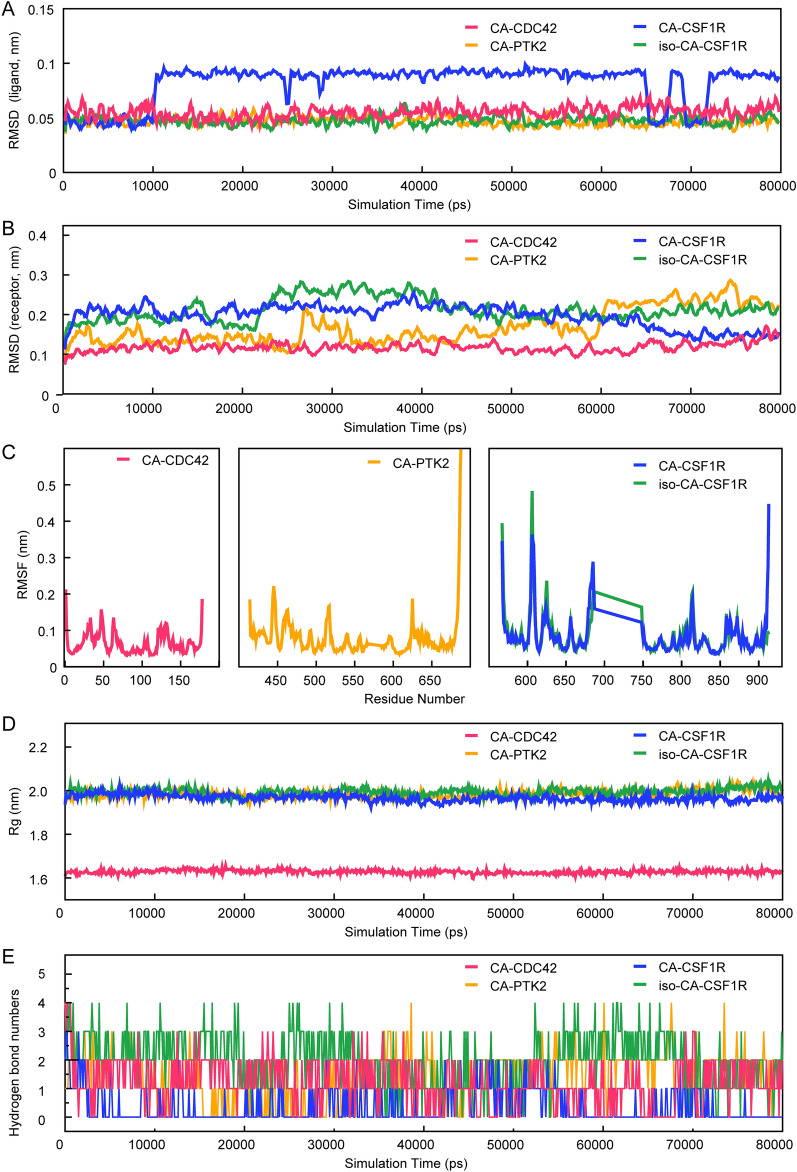
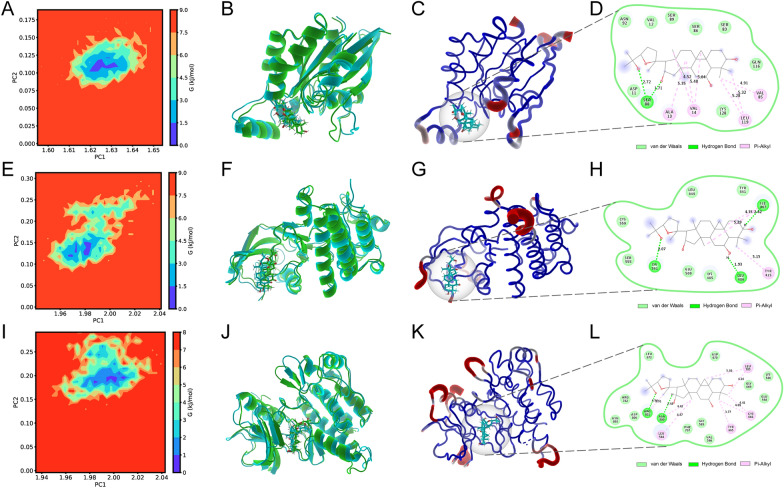
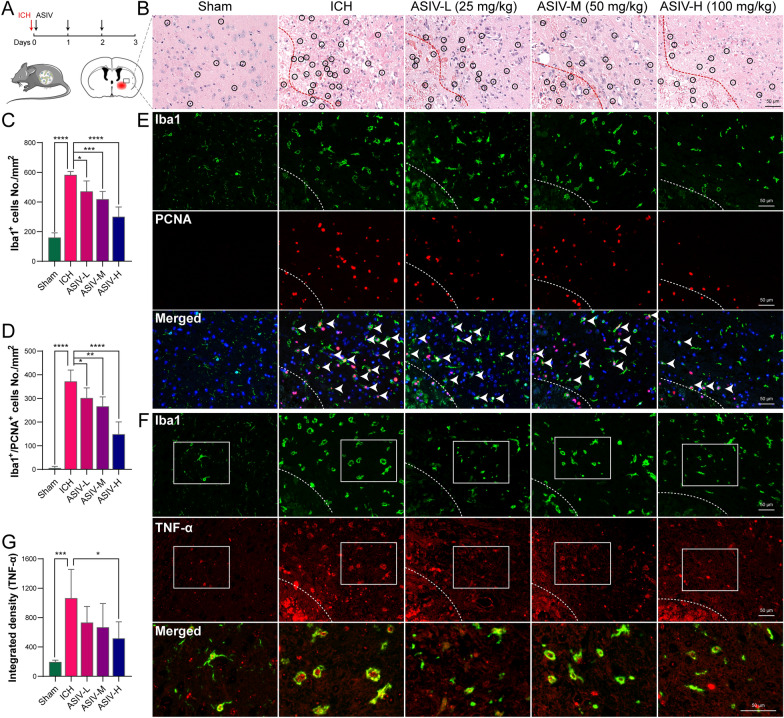
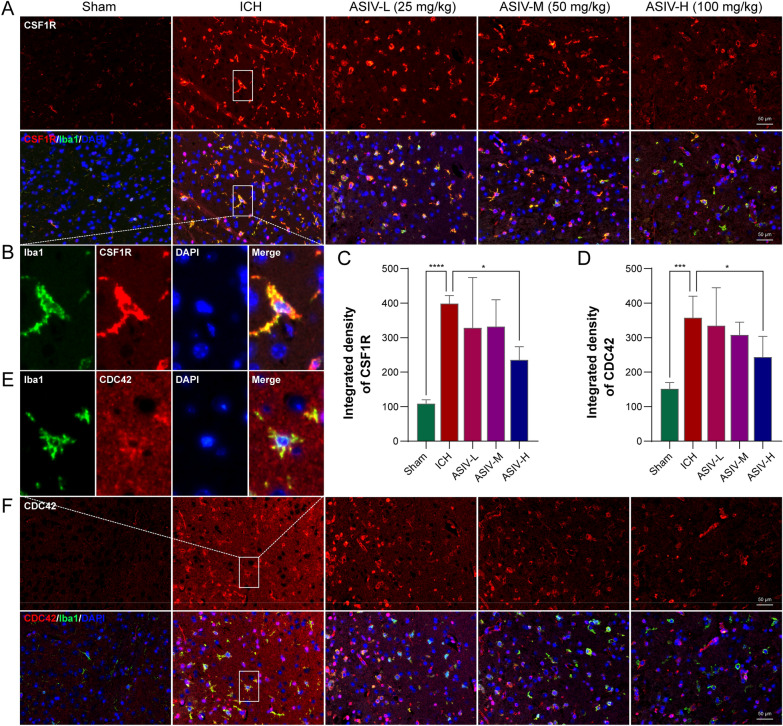
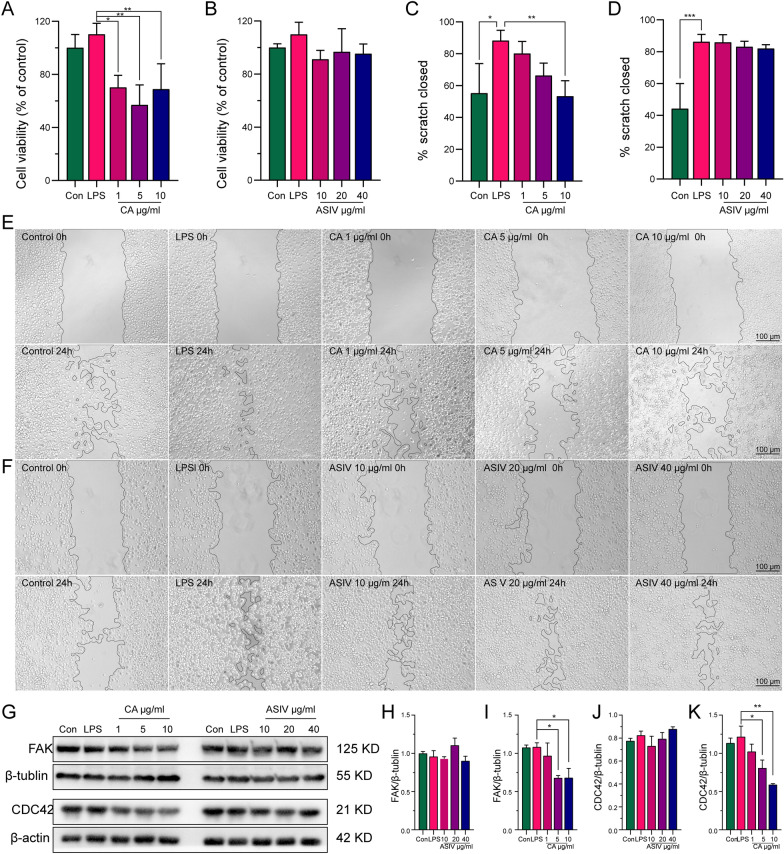
Results: The metabolites (3-epi-cycloastragenol and cycloastragenol) showed higher bioavailability and blood-brain barrier permeability than ASIV. Biotransformation added the targets ASIV in ICH, including PTK2, CDC42, CSF1R, and TNF. The increased targets were primarily enriched in microglia and involved in cell migration, proliferation, and inflammation. The computer simulations revealed that 3-epi-cycloastragenol bound CSF1R and cycloastragenol bound PTK2 and CDC42 stably. The In vivo and in vitro studies confirmed that the ASIV-derived metabolites suppressed CDC42 and CSF1R expression and inhibited microglia migration, proliferation, and TNF-α secretion.

Conclusion: ASIV inhibits post-ICH microglia/macrophage proliferation and migration, probably through its transformed products to bind CDC42, PTK2, and CSF1R. The integrated strategy can be used to discover novel mechanisms of herbal products or traditional Chinses medicine in treating diseases.

Keywords: 3-epi-cycloastragenol; Astragaloside IV; Biotransformation; Cycloastragenol; Gut microbiota; Herbal products; Intracerebral hemorrhage; Liver; Microglia; Network pharmacology.


Conflict of interest statement

The authors declare no competing financial interest.

Figures

Fig. 1
Fig. 1
Comparison of the new strategy with the classical scheme. Gut microbial- and hepatic-biotransformation analyses are performed before the target prediction of herbal products. Next, the ASIV targets after biotransformation are intersected with that of ICH. Then, GO and KEGG analyses enrich the related biological processes. At last, molecular docking, molecular dynamics simulation, and cell and animal experiments confirm the transformation-added targets and pathways. ASIV Astragaloside IV, ICH intracerebral hemorrhage. Solid circle: intersected; hollow circle: not intersected
Fig. 2
Fig. 2
Microbial and hepatic biotransformation of ASIV. ASIV is transformed by gut microbiota to form Cyc B, Bra B, CA, CA-2H, and iso-CA. The microbiota-transformed products are infused into the liver. Then CA is partly converted into CA-2H and iso-CA. The bile duct system exerts Cyc B, Bra B, and ASIV. Only ASIV, CA, and iso-CA are detectable in the bloodstream. ASIV Astragaloside IV, CA cycloastragenol; iso-CA 3-epi-cycloastragenol, Bra B 6-O-β-d-glucopyranosyl, Cyc B 3-O-β-d-xylopyranosyl-cycloastragenol; CA-2H dehydrogenated to 20R, 24S-epoxy-6α, 16β, 25-tyihydroxy-9-cycloartan-3-one
Fig. 3
Fig. 3
The potential targets of ASIV before and after microbial and hepatic biotransformation. There are 373 and 524 targets of ASIV before and after biotransformation, respectively. Two hundred and fifteen targets are common for ASIV, CA, and iso-CA (purple circles). The biotransformation results in 150 additional targets. ASIV Astragaloside IV, CA cycloastragenol, iso-CA 3-epi-cycloastragenol
Fig. 4
Fig. 4
The biotransformation-added targets of ASIV on ICH. A Twenty-seven additional genes overlap with ICH targets. B The PPI network of the 27 additional targets. C The distribution analysis of 27 additional targets suggests that the biotransformation products primarily act on microglia/macrophages. D The core subnetwork of 27 additional targets shows the central role of HRAS, PIK3R1, PTK2, CDC42, CSF1R, HGF, STAT1, and TNF
Fig. 5
Fig. 5
GO and KEGG analyses of the biotransformation-added targets. A The top 10 biological processes, cellular components, and molecular functions of ASIV enriched in GO analysis emphasize cell migration and proliferation. B The top 30 KEGG pathways indicate the essential roles of chemokines and focal adhesion on ASIV in treating ICH
Fig. 6
Fig. 6
The dynamic stability of the ligand-target complexes. A The RMSD of ligands in compound-targets complexes show limited fluctuations in CA-CDC42, CA-PTK2, and iso-CA-CSF1R complexes but relatively large volatility in CA-CSF1R. B The RMSDs of receptors in compound-targets complexes show limited fluctuations in CA-CDC42, CA-PTK2, CA-CSF1R, and iso-CA-CSF1R complexes. C The RMSFs indicate that the residue-specific fluctuations of receptors are also stable, especially for the CA-CDC42 complex. D The Rgs of the four complexes are less fluctuated
Fig. 7
Fig. 7
Exploration of the conformations with the lowest free binding energy. A The free energy landscape of CA-CDC42 during the 80-ns molecular dynamics simulation. 2D graph projects on the first two principal components (PC1 + PC2). Blue spots indicate the energy minima. B The overlapped graph of CA-CDC42 before (green) and after (blue) molecular dynamics simulation. C The low-energy conformation of CA-CDC42 is selected according to the free energy landscape. D The binding model of CA-CDC42 complex. Light green represents van der Waals, dark green represents hydrogen bonds, and pink represents hydrophobic interactions. E The free energy landscape of CA-PTK2 during the 80-ns molecular dynamics simulation. F The overlapped graph of CA-CDC42 before (green) and after (blue) molecular dynamics simulation. G The low-energy conformation of CA-PTK2 is selected according to the free energy landscape. H The binding model of CA-PTK2 complex. I The free energy landscape of iso-CA-CSF1R during the 80-ns molecular dynamics simulation. J The overlapped graph of iso-CA-CSF1R before (green) and after (blue) molecular dynamics simulation. K The low-energy conformation of iso-CA-CSF1R is selected according to the free energy landscape. L The binding model of the iso-CA-CSF1R complex. M The free energy landscape of CA-CSF1R
Fig. 8
Fig. 8
The effects of orally administrated ASIV on microglia/macrophage proliferation, migration, and chemokine secretion after ICH. A Flow chart of the animal experiments. B H&E staining suggests that ASIV alleviates brain disorganization and inflammatory cell infiltration. C The statistic graph of Iba1 immunofluorescent suggests that ASIV dose-dependently reduces the number of perihematomal microglia/macrophages. D The statistic graph of Iba1 and PCNA double staining suggests that ASIV reduces the number of proliferating microglia/macrophage (green cells encircles red nuclei). E The representative images of Iba1 (green) and PCNA (red) immunofluorescent. F The representative images of Iba1 (green) and TNF-α (red) double staining indicate that TNF-α is predominantly expressed by microglia/macrophage. G The statistical graph of TNF-α immunofluorescent suggests that a high dose of ASIV declines TNF-α production. Dashed line: hematoma (B, E, F). Data are expressed as mean ± SD, n = 5. *P < 0.05, **P < 0.01, ***P < 0.001, ****P < 0.0001. Scale bar = 50 μm
Fig. 9
Fig. 9
The effects of orally administrated ASIV on CDC42 and CSF1R after ICH. A The representative double-staining images of Iba1 (green) and CSF1R (red) show that ASIV decreases CSF1R expression. B The enlarged images show that CSF1R is mainly expressed in microglia/macrophage. C The statistical graph indicates that ASIV suppresses the expression of CSF1R. D The statistical graph indicates that ASIV suppresses the expression of CDC42. E The enlarged images show that CDC42 (red) is highly expressed on Iba1-positive microglia/macrophage (green). F The representative double-staining images of Iba1 and CDC42 show ASIV decreases CDC42 expression. Data are expressed as mean ± SD, n = 5. *P < 0.05, ***P < 0.001, ****P < 0.0001. Scale bar = 50 μm
Fig. 10
Fig. 10
CA suppresses BV2 proliferation and migration, but ASIV does not. A CCK-8 shows that CA inhibits BV2 proliferation. B CCK-8 shows that ASIV doesn’t affect BV2 proliferation. C Scratch assay suggests that CA inhibits BV2 migration. D Scratch assay suggests that CA doesn’t inhibit BV2 migration. E Representative image of the scratch assay for CA. F Representative image of the scratch assay for ASIV. G Representative images of WB show that CA decreases FAK and CDC42 expressions. H The statistical graph shows that ASIV doesn’t affect the FAK level. I The statistical graph shows that CA decreases FAK expression. J The statistical graph shows that ASIV doesn’t affect CDC42 expression. K The statistical graph shows that CA suppresses the CDC42 level. Data are expressed as mean ± SD, n = 3. *P < 0.05, **P < 0.01, ***P < 0.001. Scale bar = 100 μm (EF)

References

    1. Newman DJ, Cragg GM. Natural products as sources of new drugs over the nearly four decades from 01/1981 to 09/2019. J Nat Prod. 2020;83:770–803. doi: 10.1021/acs.jnatprod.9b01285. - DOI - PubMed
    1. Alomar HA, Fathallah N, Abdel-Aziz MM, Ibrahim TA, Elkady WM. Gc-ms profiling, anti-helicobacter pylori, and anti-inflammatory activities of three apiaceous fruits’ essential oils. Plants. 2022;11:2617. doi: 10.3390/plants11192617. - DOI - PMC - PubMed
    1. Li S, Zhang B. Traditional Chinese medicine network pharmacology: theory, methodology and application. Chin J Nat Med. 2013;11:110–120. doi: 10.3724/SP.J.1009.2013.00110. - DOI - PubMed
    1. Kibble M, Saarinen N, Tang J, Wennerberg K, Mäkelä S, Aittokallio T. Network pharmacology applications to map the unexplored target space and therapeutic potential of natural products. Nat Prod Rep. 2015;32:1249–1266. doi: 10.1039/C5NP00005J. - DOI - PubMed
    1. Cardona F, Andrés-Lacueva C, Tulipani S, Tinahones FJ, Queipo-Ortuño MI. Benefits of polyphenols on gut microbiota and implications in human health. J Nutr Biochem. 2013;24:1415–1422. doi: 10.1016/j.jnutbio.2013.05.001. - DOI - PubMed

LinkOut - more resources