. 2023 Apr 17;18(1):24.
doi: 10.1186/s13024-023-00616-5.

NF-κB is a critical mediator of post-mitotic senescence in oligodendrocytes and subsequent white matter loss

Affiliations

NF-κB is a critical mediator of post-mitotic senescence in oligodendrocytes and subsequent white matter loss

Judith Stefanie Schlett et al. Mol Neurodegener. .

Abstract

Background: Inflammaging represents an accepted concept where the immune system shifts to a low-grade chronic pro-inflammatory state without overt infection upon aging. In the CNS, inflammaging is mainly driven by glia cells and associated with neurodegenerative processes. White matter degeneration (WMD), a well-known process in the aging brain, manifests in myelin loss finally resulting in motor, sensory and cognitive impairments. Oligodendrocytes (OL) are responsible for homeostasis and maintenance of the myelin sheaths, which is a complex and highly energy demanding process sensitizing these cells to metabolic, oxidative and other forms of stress. Yet, the immediate impact of chronic inflammatory stress like inflammaging on OL homeostasis, myelin maintenance and WMD remains open.

Methods: To functionally analyze the role of IKK/NF-κB signaling in the regulation of myelin homeostasis and maintenance in the adult CNS, we established a conditional mouse model allowing NF-κB activation in mature myelinating oligodendrocytes. IKK2-CAPLP-CreERT2 mice were characterized by biochemical, immunohistochemical, ultrastructural and behavioral analyses. Transcriptome data from isolated, primary OLs and microglia cells were explored by in silico pathway analysis and validated by complementary molecular approaches.

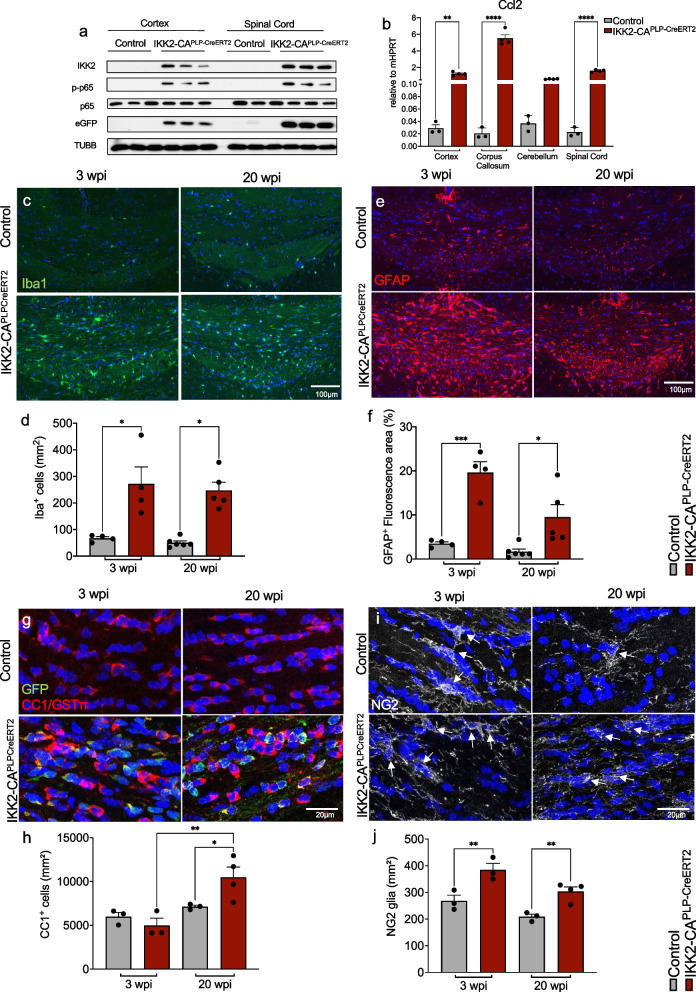
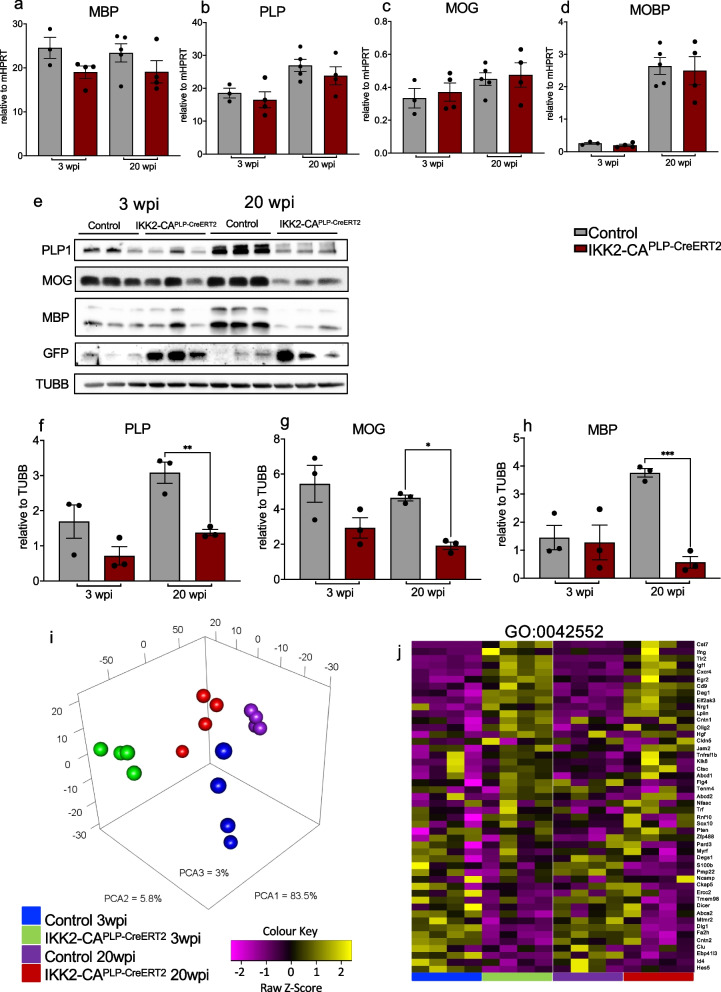
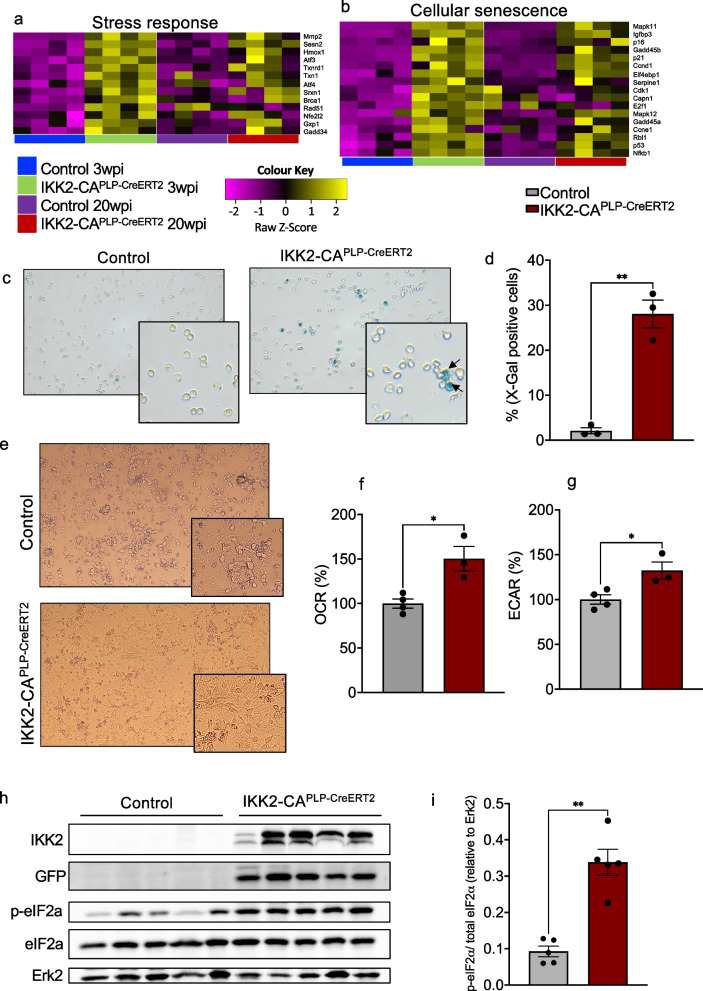
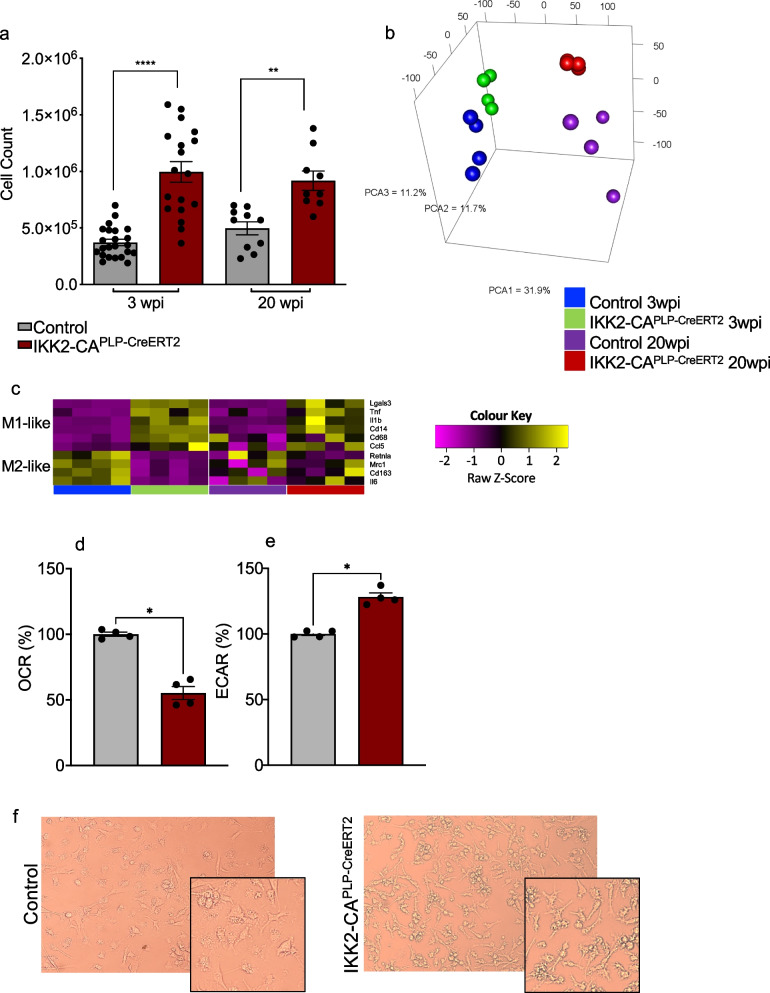
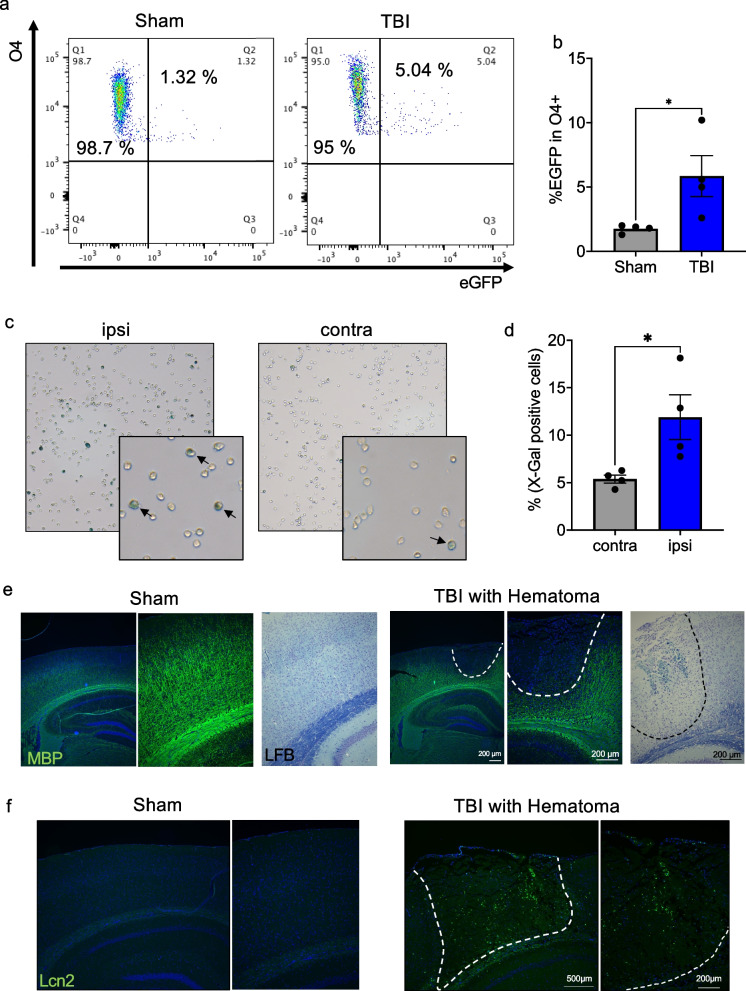
Results: Chronic NF-κB activation in mature OLs leads to aggravated neuroinflammatory conditions phenocopying brain inflammaging. As a consequence, IKK2-CAPLP-CreERT2 mice showed specific neurological deficits and impaired motoric learning. Upon aging, persistent NF-κB signaling promotes WMD in these mice as ultrastructural analysis revealed myelination deficits in the corpus callosum accompanied by impaired myelin protein expression. RNA-Seq analysis of primary oligodendrocytes and microglia cells uncovers gene expression signatures associated with activated stress responses and increased post mitotic cellular senescence (PoMiCS) which was confirmed by elevated senescence-associated β-galactosidase activity and SASP gene expression profile. We identified an elevated integrated stress response (ISR) characterized by phosphorylation of eIF2α as a relevant molecular mechanism which is able to affect translation of myelin proteins.

Conclusions: Our findings demonstrate an essential role of IKK/NF-κB signaling in mature, post-mitotic OLs in regulating stress-induced senescence in these cells. Moreover, our study identifies PoMICS as an important driving force of age-dependent WMD as well as of traumatic brain injury induced myelin defects.

Keywords: Inflammaging; Integrated stress response; Mature oligodendrocytes; NF-κB; PoMICS; White matter degeneration.


Conflict of interest statement

The authors declare no conflict of interest. The funders had no role in the design of the study; in the collection, analyses, or interpretation of data; in the writing of the manuscript; or in the decision to publish the results.

Figures

Fig. 1
Fig. 1
IKK2/NF-κB activation in oligodendrocytes induces an inflammatory phenotype in the CNS. a Immunoblot analysis of extracts from cortex and spinal cord tissue from control and IKK2-CAPLP−CreERT2 mice 3 weeks post induction (wpi). Strong expression of IKK2 and eGFP demonstrate tamoxifen-dependent transgene activation in IKK2-CAPLP−CreERT2 mice. High levels of phosphorylated p65 (p-p65) validate functional activation of NF-κB signaling upon transgene expression (n = 3). b Gene expression analysis of Ccl2 as an inflammatory marker and NF-κB target gene in tissue extracts from cortex, corpus callosum, cerebellum and spinal cord proves functionality of the transgenic system and depicts the inflammatory milieu within the CNS (n = 3–4). c and d Immunofluorescent staining and quantification of Iba1 reveals persistent microgliosis in the CC (3 wpi – Control (n = 4): 67 ± 6 cells/mm2, IKK2-CAPLP−CreERT2 (n = 4): 271 ± 64 cells/mm2, 20 wpi—Control (n = 6): 50 ± 7 cells/mm2, IKK2-CAPLP−CreERT2 (n = 5): 247 ± 31 cells/mm2). e and f Immunofluorescent staining and quantification of GFAP + astrocytes identifies an increased number of GFAP + astrocytes in the CC at 3 wpi that declines at 20 wpi (3 wpi – Control (n = 4): 3.50% ± 0.34 fluorescent area, IKK2-CAPLP−CreERT2 (n = 4): 19.62% ± 2.13 fluorescent area; 20wpi – Control (n = 6): 1.67% ± 0.53 fluorescent area, IKK2-CAPLP−CreERT2 (n = 5): 9.50% ± 2.53 fluorescent area). g and h Immunohistochemical analysis of oligodendrocytes (OLs) 3 and 20 wpi shows a significant increase in the overall CC1 + cell number in the corpus callosum (CC) of IKK2-CAPLP−CreERT2 animals at 20 wpi with a constant number of GFP + CC1 + cells (3 wpi—Control (n = 3): 5997 ± 398 cells/mm2, IKK2-CAPLP−CreERT2 (n = 3): 4979 ± 685 cells/mm2; 20 wpi – Control (n = 3): 7123 ± 147 cells/mm2, IKK2-CAPLP−CreERT2 (n = 4): 10,484 ± 1014 cells/mm2; GFP + cells- IKK2-CAPLP−CreERT2: 3 wpi: 3141 ± 575 cells/mm2, 20 wpi: 3883 ± 434 cells/mm2). i and j Immunohistochemical analysis of NG2 glia at 3 and 20 wpi reveals higher numbers of progenitor cells in IKK2-CAPLP−CreERT2 mice. White Arrows indicate NG2 glia. (3 wpi—Control (n = 3): 268 ± 17 cells/mm2, IKK2-CAPLP−CreERT2 (n = 3): 385 ± 20 cells/mm2; 20 wpi – Control (n = 3): 209 ± 8 cells/mm2, IKK2-CAPLP−CreERT2 (n = 4): 304 ± 15 cells/mm2). Data are shown as mean ± SEM. Grey bars, control; red bars, IKK2-CAPLP−CreERT2. Statistical analysis: One-way or Two-way ANOVA multiple comparison test followed by Bonferroni´s post hoc test (*p < 0.05; **p < 0.01; ***p < 0.001; ****p < 0.0001 NS, non-significant (p > 0.05))
Fig. 2
Fig. 2
IKK2-CAPLP−CreERT2 mice develop neurological deficits and show decreased motoric learning. a IKK2-CAPLP−CreERT2 mice exhibit an increased neurological severity score (NSS) over the time course of 40 weeks, peaking at 3 to 4 wpi. b 9 training trials on the rotarod on 3 consecutive days (3 trials per day) immediately after tamoxifen withdrawal show no difference in rotarod performance between IKK2-CAPLP−CreERT2 and control littermates. c Constant NF-κB activation in OLs significantly affects rotarod performance. At 20 wpi, IKK2-CAPLP−CreERT2 animals show a significantly decreased latency to fall off the rotarod, when first trained at this timepoint. Furthermore, animals do not improve with trial number within the 9 trials on 3 consecutive days (3 trials per day) compared to controls. d and e Constant training attenuates motor deficits in IKK2-CAPLP−CreERT2 mice. Mice were either introduced right after transgene induction and then trained for 20 weeks bi-weekly in the beam walking test (“trained”) or introduced to the beam walking test at 20 wpi (“untrained”). No differences were found in easier tasks like crossing the 12 mm square and 17 mm round beam. Untrained and trained control and IKK2-CAPLP−CreERT2 mice mastered the beam walking task in comparable times (untrained: 12 mm: Control: 8 ± 0.9 s, IKK2-CAPLP−CreERT2: 16 ± 1.2 s, 17 mm: Control: 9 ± 1.3 s, IKK2-CAPLP−CreERT2: 14 ± 1.1 s, trained: 12 mm: Control: 15 ± 2.0 s, IKK2-CAPLP−CreERT2: 26 ± 5.3 s, 17 mm: Control: 18 ± 2.6 s, IKK2-CAPLP−CreERT2: 32 ± 6.5 s, n = 7–10). For smaller and therefore more difficult beams, 5 mm square or 11 mm round beam, untrained IKK2-CAPLP−CreERT2 animals take significantly longer to cross the beam than untrained control mice. Crossing times of trained and untrained controls are similar. Trained IKK2-CAPLP−CreERT2 animals cross the 5 mm beam in significantly less time compared to untrained IKK2-CAPLP−CreERT2 animals, no difference was found between trained control and IKK2-CAPLP−CreERT2 animals on the 11 mm beam (untrained: 5 mm: Control: 23 ± 2.9 s, IKK2-CAPLP−CreERT2: 111 ± 8.9 s, 11 mm: Control: 12.5 ± 1.5 s, IKK2-CAPLP−CreERT2: 87.5 ± 17.2 s, trained: 5 mm: Control: 25 ± 3.3 s, IKK2-CAPLP−CreERT2: 61.1 ± 17.3 s, 11 mm: Control: 21.6 ± 3.4 s, IKK2-CAPLP−CreERT2: 49.3 ± 14.8 s, n = 7–10). f and g The ladderwalk test revealed distinct motoric deficits 20 wpi. IKK2-CAPLP−CreERT2 animals showed significantly more missteps in the irregular as well as in the regular ladderwalk there to even greater extent. Missteps are mainly shown in the hindlimbs (irregular: all limbs: Control: 8.0 ± 0.38 missteps, IKK2-CAPLP−CreERT2: 10.3 ± 0.84 missteps, front limbs: Control: 5.3 ± 0.35 missteps, IKK2-CAPLP−CreERT2: 5.1 ± 0.23 missteps, hind limbs: Control: 2.7 ± 0.27 missteps, IKK2-CAPLP−CreERT2: 5.3 ± 0.77 missteps, regular: all limbs: Control: 10.7 ± 0.74 missteps, IKK2-CAPLP−CreERT2: 15.8 ± 0.46 missteps, front limbs: Control: 8.7 ± 0.87 missteps, IKK2-CAPLP−CreERT2: 10.4 ± 0.75 missteps, hind limbs: Control: 2.0 ± 0.30 missteps, IKK2-CAPLP−CreERT2: 5.4 ± 0.70 missteps, n = 8–10). h Grip strength was measured up to 17 wpi revealing significantly decreased grip strength in IKK2-CAPLP−CreERT2 mice. Data are shown as mean ± SEM. Black dots/grey bars, control; red dots/bars, IKK2-CAPLP−CreERT2; striped bars: untrained controls and IKK2-CAPLP−CreERT2. Statistical analysis: Two-way ANOVA multiple comparison test followed by Bonferroni´s post hoc test (*p < 0.05; **p < 0.01; ***p < 0.001; ****p < 0.0001 NS, non-significant (p > 0.05))
Fig. 3
Fig. 3
Chronic NF-κB activation in OLs leads to white matter loss in the corpus callosum. a and b Luxol Fast Blue (LFB) staining revealed a significant decrease (B) in the width of the CC in IKK2-CAPLP−CreERT2 animals at 20 wpi (Bregma—2 mm; 3wpi: Control: 366 ± 9.0 μm, IKK2-CAPLP−CreERT2: 352 ± 13.3 μm; 20wpi: Control: 405 ± 10.0 μm, IKK2-CAPLP−CreERT2: 364.6 ± 12.6 μm, n = 3–4). c to f Myelinated axons do not show differences in myelin sheath structure. Ultrastructural analysis using electron microscopy reveals proper myelination of single axons in the CC (c and d). G-ratio, the ratio of the inner and outer diameter of the myelin sheath used as reference for optimal myelination, did not differ between IKK2-CAPLP−CreERT2 and control animals at both time points (e and f). g NF-κB activation in OLs affects overall axonal myelination. The percentage of myelinated axons is significantly decreased in the CC of IKK2-CAPLP−CreERT2 animals at 20 wpi. Number of myelinated axons remain at the level of 3 wpi in IKK2-CAPLP−CreERT2 mice (3 wpi: Control: 42.1 ± 3.2%, IKK2-CAPLP−CreERT2: 37.7 ± 3.6%; 20 wpi: Control: 74.4 ± 2.1%, IKK2-CAPLP−CreERT2: 46.7 ± 4.0%, n = 5). h Axon diameter of unmyelinated axons is significantly increased in the CC of IKK2-CAPLP−CreERT2 animals 20 wpi in comparison to IKK2-CAPLP−CreERT2 animals at 3 wpi as well as controls (3 wpi: Control: 0.24 ± 0.01 μm, IKK2-CAPLP−CreERT2: 0.27 ± 0.02 μm; 20 wpi: Control: 0.25 ± 0.01 μm, IKK2-CAPLP−CreERT2: 0.35 ± 0.01 μm, n = 5). Data are shown as mean ± SEM. Black dots/grey bars, control; red dots/bars, IKK2-CA.PLP−CreERT2. Statistical analysis: Two-tailed Mann–Whitney-U Test, Two-way ANOVA multiple comparison test followed by Bonferroni´s post hoc test, (*p < 0.05; **p < 0.01; ***p < 0.001; ****p < 0.0001 NS, non-significant (p > 0.05))
Fig. 4
Fig. 4
NF-κB activation in OLs impairs myelin-associated protein expression. a to d qRT-PCR reveals no differences in gene expression of Mbp (a), Plp (b), Mog (c) and Mobp (d) at 3 and 20 wpi in cortex tissue (n = 3–5). e to h Western blot analysis of cortex tissue indicates significantly decreased protein levels of MBP, MOG and PLP1 at 20 wpi in IKK2-CAPLP−CreERT2 mice, while protein levels at 3 wpi were comparable between control and IKK2-CAPLP−CreERT2 animals (n = 3). i Principal component analysis of isolated O4+ OLs (RNA sequencing) at 3 and 20 wpi shows distinct clustering within control and IKK2-CAPLP−CreERT2 groups (n = 4, two brains with identical genotype were pooled to n = 1). j Transcriptome analysis determined mild gene expression changes between IKK2-CAPLP−CreERT2 and control O4+ OLs in genes related to to the GO class (GO:0,042,552) myelination, myelin assembly and maintenance, regulation of myelination and paranodal junction assembly. Out of all genes depicted in the heatmap only Cst7, Tlr2, Igf1, Eif2ak3, Cxcr4, Lpin1, Egr2, Cd9, Dag1, and Epb41l3 were significantly deregulated at both timepoints. At 3wpi additionally Ifng, Hes 5, Cntn2 and Dlg1 reached significance, at 20 wpi Nrg1, Id4, Tmem98 and S100b were found significantly deregulated in addition. Data are shown as mean ± SEM. Grey bars, control; red bars, IKK2-CAPLP−CreERT2. Statistical analysis: Two-way ANOVA multiple comparison test followed by Bonferroni´s post hoc test, (*p < 0.05; **p < 0.01; ***p < 0.001; ****p < 0.0001 NS, non-significant (p > 0.05))
Fig. 5
Fig. 5
Genes associated with stress responses and cellular senescence are upregulated upon NF-κB activation in OLs. a and b Heatmaps indicate significantly elevated gene signatures indicative for stress responses (a) and cellular senescence (b) in IKK2-CAPLP−CreERT2 O4+ OLs compared to control OLs at 3 and 20 wpi. c and d X-gal staining revealed significantly increased senescence associated ß-galactosidase activity in freshly isolated IKK2-CAPLP−CreERT2 O4+ OLs at 3 wpi. Blue X-gal positive cells are indicated by black arrows (Control: 2.1% ± 0.67% X-gal positive cells, IKK2-CAPLP−CreERT2: 28.1% ± 3.05% x-gal positive cells, n = 3). e Primary O4+ OLs isolated from IKK2-CAPLP−CreERT2 mice show senescence associated cell morphology as they adopt a larger and flattened morphology. f and g IKK2-CAPLP−CreERT2 O4+ OLs show an overall increased metabolic activity as oxidative phosphorylation (F, OCR normalized to control; IKK2-CAPLP−CreERT2: 150.2 ± 11.9%, n = 3–4) as well as glycolysis (G, ECAR normalized to control; IKK2-CAPLP−CreERT2: 132.3 ± 8.3%, n = 3–4) is significantly increased. h NF-κB activation in O4+ OLs leads to an increase in phosphorylated eIF2α indicating activation of the integrated stress response as revealed by western blot analysis at 3wpi. Prominent IKK2 and GFP reporter gene expression confirm transgene activation in IKK2-CAPLP−CreERT2 cells. i Quantification of h (n = 5). Data are shown as mean ± SEM. Grey bars, control; red bars, IKK2-CA.PLP−CreERT2. Statistical analysis: Two-tailed Mann–Whitney-U Test, (*p < 0.05; **p < 0.01; ***p < 0.001; ****p < 0.0001 NS, non-significant (p > 0.05))
Fig. 6
Fig. 6
Chronic NF-κB activation in OLs triggers non-cell-autonomous expansion and activation of microglia cells. a Cell number of isolated Cd11b+ microglia cells from IKK2-CAPLP−CreERT2 mice is significantly increased compared to Cd11b+ microglia cells derived from control mice at 3 and 20 wpi (3 wpi: Control: 0.37 ± 0.03 × 106, IKK2-CAPLP−CreERT2: 1.3 ± 0.24 × 106 n = 20–23, 20 wpi: Control: 0.5 ± 0.05 × 106, IKK2-CAPLP−CreERT2: 0.85 ± 0.1 × 106, n = 10–23, two brains with identical genotype were pooled and set to n = 1). b Principal component analysis determines distinct differential gene expression between control and IKK2-CAPLP−CreERT2 Cd11b+ microglia at 3 and 20 wpi. c IKK2-CAPLP−CreERT2 Cd11b+ microglia are activated towards an M1 pro-inflammatory phenotype. RNA Sequencing analysis reveals upregulation of M1-like and downregulation of M2-like marker genes in IKK2-CAPLP−CreERT2 Cd11b+ microglia compared to control Cd11b+ microglia as depicted in the heatmap. All deregulated genes shown reached significance at 3 wpi, while only Lgals3, IL1β and Cd14 reached significance at 20 wpi. d and e Seahorse analysis of Cd11b+ microglia from IKK2-CAPLP−CreERT2 mice revealed decreased oxidative phosphorylation (D, OCR normalized to control; IKK2-CAPLP−Cre−ERT2: 55.2 ± 4.9%, n = 3–4) and increased glycolysis (E, ECAR normalized to control; IKK2-CAPLPCreERT2: 128.2 ± 3.1%, n = 3–4) 3 wpi. fEx-vivo analysis of primary Cd11b+ microglia revealed distinct morphological differences between control and IKK2-CAPLP−CreERT2 Cd11b+ microglia. IKK2-CAPLP−CreERT2 Cd11b+ microglia show a rather bushy, activated phenotype. Data are shown as mean ± SEM. Grey bars, control; red bars, IKK2-CA.PLP−CreERT2. Statistical analysis: Two-way ANOVA multiple comparison test followed by Bonferroni´s post hoc test, Two-tailed Mann–Whitney-U Test, (*p < 0.05; **p < 0.01; ***p < 0.001; ****p < 0.0001 NS, non-significant (p > 0.05))
Fig. 7
Fig. 7
Traumatic brain injury induces senescence in OLs and myelin loss in the impact area. a and b NF-ĸB is activated in O4+OLs post TBI as determined by FACS analysis of O4+ OLs isolated from sham and TBI treated ĸ-EGFP reporter gene mice. A significant fraction of O4+ cells from TBI-treated ĸ-EGFP mice show eGFP expression 14 days post TBI (sham 1.75 ± 0.15%, TBI: 5.85 ± 1.58% n = 4). c and d A significant higher percentage of X-gal positive cells was detected in O4.+ OLs isolated from the ipsilateral hemisphere 14 dpi post TBI indicating senescence associated ß-galactosidase activity compared to uninjured contralateral hemisphere. Black arrows mark blue colored X-gal positive cells (contra: 5.38 ± 0.37%, ipsi: 11.89 ± 2.04%, n = 4). e Immunofluorescence and LFB analysis revealed strong loss of myelin basic protein (MBP) and reduced LFB staining within the insult area as indicated by dotted lines (3 dpi). f In contrast, the NF-ĸB target gene and SASP factor Lcn2 is found upregulated in the insult region as determined by immunofluorescence staining (3 wpi post TBI). Dotted lines indicate the TBI insult area. Data are shown as mean ± SEM. Grey bar, sham/contra; blue bar, TBI/ipsi. Statistical analysis: Two-tailed Mann–Whitney-U Test, (*p < 0.05; **p < 0.01; ***p < 0.001; ****p < 0.0001 NS, non-significant (p > 0.05))

References

    1. Mattson MP, Arumugam TV. Hallmarks of brain aging: adaptive and pathological modification by metabolic states. Cell Metab. 2018;27(6):1176–1199. - PMC - PubMed
    1. Drayer BP. Imaging of the aging brain. Part I Normal findings Radiology. 1988;166(3):785–796. - PubMed
    1. Chapman TW, Hill RA. Myelin plasticity in adulthood and aging. Neurosci Lett. 2020;715:134645. - PMC - PubMed
    1. Tang Y, Nyengaard J, Pakkenberg B, Gundersen H. Age-induced white matter changes in the human brain: a stereological investigation. Neurobiol Aging. 1997;18(6):609–615. - PubMed
    1. Liu H, Yang Y, Xia Y, Zhu W, Leak RK, Wei Z, Wang J, Hu X. Aging of cerebral white matter. Ageing Res Rev. 2017;34:64–76. - PMC - PubMed

Publication types