. 2023 Apr 17;20(1):94.
doi: 10.1186/s12974-023-02773-2.

Noninvasive ultrasound stimulation to treat myocarditis through splenic neuro-immune regulation

Affiliations

Noninvasive ultrasound stimulation to treat myocarditis through splenic neuro-immune regulation

Tianshu Liu et al. J Neuroinflammation. .

Abstract

Background: The cholinergic anti-inflammatory pathway (CAP) has been widely studied to modulate the immune response. Current stimulating strategies are invasive or imprecise. Noninvasive low-intensity pulsed ultrasound (LIPUS) has become increasingly appreciated for targeted neuronal modulation. However, its mechanisms and physiological role on myocarditis remain poorly defined.

Methods: The mouse model of experimental autoimmune myocarditis was established. Low-intensity pulsed ultrasound was targeted at the spleen to stimulate the spleen nerve. Under different ultrasound parameters, histological tests and molecular biology were performed to observe inflammatory lesions and changes in immune cell subsets in the spleen and heart. In addition, we evaluated the dependence of the spleen nerve and cholinergic anti-inflammatory pathway of low-intensity pulsed ultrasound in treating autoimmune myocarditis in mice through different control groups.

Results: The echocardiography and flow cytometry of splenic or heart infiltrating immune cells revealed that splenic ultrasound could alleviate the immune response, regulate the proportion and function of CD4+ Treg and macrophages by activating cholinergic anti-inflammatory pathway, and finally reduce heart inflammatory injury and improve cardiac remodeling, which is as effective as an acetylcholine receptor agonists GTS-21. Transcriptome sequencing showed significant differential expressed genes due to ultrasound modulation.

Conclusions: It is worth noting that the ultrasound therapeutic efficacy depends greatly on acoustic pressure and exposure duration, and the effective targeting organ was the spleen but not the heart. This study provides novel insight into the therapeutic potentials of LIPUS, which are essential for its future application.

Keywords: CCR2+ macrophage; CD4+ Treg cell; Cholinergic anti-inflammatory pathway; Experimental autoimmune myocarditis; Low-intensity pulsed ultrasound.


Conflict of interest statement

We declare that we have no conflict of interest.

Figures
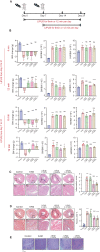
Fig. 1
Fig. 1
The therapeutic effect of LIPUS on myocarditis and optimal parameter screening. A Timeline of an EAM intervention experiment performed in the presented study in which animals were immunized with 200 μg of cardiac-specific peptide on day 0 and 7, then treated with focused ultrasound that targeted the spleen on day 0 or day 7. B Data from different experimental conditions (1.0 MHz US at 0.1 MPa, 0.35 MPa, 0.473 MPa; 1 s on /5 s off burst for 6 or 12 min per day) were shown. On the final day of the experiment, BW change, SW/BW and HW/BW of ultrasound treated animals in different experimental periods day 0–21 or day 7–21. C HE staining for the degree of inflammatory cell infiltration of EAM hearts. Scale: 500 μm (top) and 50 μm (bottom). (D) MASSON staining determined collagen deposition in the inflammatory region. Scale: 500 μm (top) and 50 μm (bottom). Representative HE and MASSON staining images of indicated groups. Bar graphs on the right in C and D show quantitation of data (n = 5). E HE staining of spleen tissue sections. n = 5. Scale: 50 μm. * Represents control vs. EAM; # represents LIPUS 0.1 MPa vs. EAM; & represents LIPUS 0.35 MPa vs. EAM; + represents LIPUS 0.473 MPa vs. EAM. (Data were shown as the mean ± SD, ordinary one-way analysis of variance, Tukey's multiple comparisons test; *P or +P < 0.05, ##P, &&P or ++P < 0.01, ***P, ###P, &&&P or +++P < 0.001). BW: body weight; SW/BW: spleen weight to body weight; HW/BW: heart weight to body weight; EAM: experimental autoimmune myocarditis; HE: hematoxylin and eosin
Fig. 2
Fig. 2
Effect of LIPUS therapy on left ventricular dysfunction and the inflammatory immune response of EAM. A M-mode echocardiography images, quantification of EF and FS were shown to evaluate the cardiac function of EAM mice (n = 5). Blood pressure showed systemic circulation under LIPUS stimulation (n = 3). B The mRNA expression of various cytokines/chemokines in spleen and heart isolated cells was detected. The expression level relative to the internal standard β-actin appeared in the heat map. C Representative FACS quantification of splenic Th17, Treg and macrophage from EAM mice with or without LIPUS treatment at day 21. Control mice served as a negative control (n = 5). D FACS analysis of different immune cells in heart at day 21 after EAM (n = 5). * Represents control vs. EAM; # represents LIPUS-0.35 MPa vs. EAM; + represents LIPUS-0.35 MPa vs. control. (Data were shown as the mean ± SD, Student’s t-test for two-group comparison and one-way analysis of variance, followed by Tukey’s multiple comparison test for comparison of multiple groups; *P or #P < 0.05, ##P or ++P < 0.01, ***P, ###P or +++P < 0.001). EAM: experimental autoimmune myocarditis; EF: ejection fraction; FS: fractional shortening; LIPUS: low-intensity pulsed ultrasound; FACS: fluorescence activated cell sorting
Fig. 3
Fig. 3
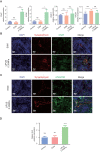
Identifying neuromodulation and cholinergic anti-inflammatory pathway involved in LIPUS therapy. A mRNA expression profiles of acetylcholine production-related genes in the mouse spleen. The relative abundance of transcripts was quantified and normalized to β-actin. Immunofluorescent staining detected B choline acetyl transferase-positive (green) or C α7nAChR-positive (green) cells in the spleen of EAM and LIPUS-0.35 MPa mice. Synaptophysin-positive nerve endings were found in close proximity to acetyl transferase-positive or α7nAChR-positive cells. n = 4. Scale: 20 μm. D The expression of acetylcholine in spleen of EAM mice with or without LIPUS-0.35 MPa. * Represents control vs. EAM; # represents LIPUS-0.35 MPa vs. EAM; + represents LIPUS-0.35 MPa vs. control. (Data were shown as the mean ± SD, ordinary one-way analysis of variance, Tukey's multiple comparisons test; #P < 0.05, ##P < 0.01, ###P or +++P < 0.001.) EAM: experimental autoimmune myocarditis; LIPUS: low-intensity pulsed ultrasound; α7nAChR: α7 nicotinic acetylcholine receptor
Fig. 4
Fig. 4
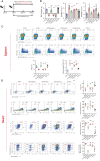
Identifying the target organ of LIPUS. A Timeline of LIPUS stimulation or α7nAChR agonists (GTS-21, 5 mg/kg) intervention in EAM mice. Different therapeutic targeting was assigned, including spleen, heart and contralateral abdomen opposite to the spleen. The characteristics and immune response of EAM were evaluated on day 21. B The BW change, SW/BW and HW/BW of EAM mice in different experimental groups (n = 3). C, D Representative FACS quantification of Treg and macrophage percentage of splenic (C) or heart (D) isolated immune cells from EAM mice with additional LIPUS stimulation at 21 days (n = 3). * Represents control vs. EAM; # represents LIPUS-spleen vs. EAM; & represents LIPUS-heart vs. EAM; represents LIPUS-contra vs. EAM; + represents GTS-21 vs. EAM. (Data were shown as the mean ± SD, ordinary one-way analysis of variance, Tukey's multiple comparisons test; *P, #P or +P < 0.05, ##P, or ++P < 0.01, ***P, ###P or +++P < 0.001.) LIPUS: low-intensity pulsed ultrasound; α7nAChR: α7 nicotinic acetylcholine receptor; EAM: experimental autoimmune myocarditis; BW: body weight; SW/BW: spleen weight to body weight; HW/BW: heart weight to body weight; FACS: fluorescence activated cell sorting
Fig. 5
Fig. 5
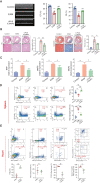
The effect of LIPUS stimulation on EAM mice with splenic denervation surgery. A Timeline of a LIPUS treatment experiment on EAM mice with splenic denervation surgery. B Photographs of surgical exposure and alcohol application for denervation operation. C Representative images of whole spleen sections of EAM mice or denervated EAM mice 6 days after surgery. Red, tyrosine hydroxylase (TH) staining. Blue, nuclear staining. In statistical analysis, quantification revealed a significant decrease in tyrosine hydroxylase immunoreactivity in denervated spleens relative to spleens from mice subjected to EAM (n = 3). * Represents EAM vs. EAM + SDN. D HE and MASSON staining for the degree of inflammatory cell infiltration and collagen deposition of EAM hearts. Scale: 500 μm (top) and 50 μm (bottom). Representative HE and MASSON staining images of indicated groups. Bar graphs on the right show quantitation of data (n = 6). E The BW change, SW/BW and HW/BW of EAM mice in different experimental groups (n = 6). F, G Representative FACS quantification of Treg and macrophage percentage of splenic (F) or heart (G) isolated immune cells from EAM mice with additional LIPUS stimulation at 21 days (n = 6). * Represents EAM vs. LIPUS-0.35 MPa; # represents LIPUS-0.35 MPa vs. LIPUS + SDN; + represents EAM vs. LIPUS + SDN. (Data were shown as the mean ± SD, Student’s t-test for two-group comparison and one-way analysis of variance, followed by Tukey’s multiple comparison tests for comparison of multiple groups; *P or #P < 0.05, **P or ##P < 0.01, ***P or ###P < 0.001.) EAM: experimental autoimmune myocarditis; LIPUS: low-intensity pulsed ultrasound. SDN: splenic denervation; TH: tyrosine hydroxylase; HE: hematoxylin and eosin; BW: body weight; SW/BW: spleen weight to body weight; HW/BW: heart weight to body weight; FACS: fluorescence activated cell sorting
Fig. 6
Fig. 6
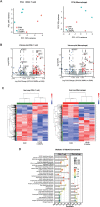
RNA sequencing of T cell and macrophage in LIPUS-treated animals. A Two-dimensional PCA representation of CD4+ T cell and CD11b + macrophage transcriptomes at day 21. B Volcano plot of DEGs from T cell and macrophage between EAM and LIPUS-0.35 MPa mice. Log fold change was plotted against the Edge R-generated p-value (−log base 10). Red indicates upregulated genes, and blue indicates downregulated genes. The gray area shows the gene expression below the threshold criteria (|log2fold-change|> 0.58 or adjusted P-value < 0.05 or P-value < 0.01). C Hierarchical clustering of DEGs in CD4+ T cell and CD11b+ macrophage of EAM group and LIPUS stimulation group. D Pathway analysis of significantly enriched DEGs. The top 31 statistically significant enriched pathways are shown. LIPUS: low-intensity pulsed ultrasound; EAM: experimental autoimmune myocarditis; PCA: principal component analysis; DEGs differential expressed genes
Fig. 7
Fig. 7
The effect of LIPUS stimulation on immune response of chronic EAM mice. A M-mode echocardiography images, quantification of EF and FS were shown to evaluate the cardiac function of EAM mice (n = 5). B HE and MASSON staining for the degree of inflammatory cell infiltration and collagen deposition of EAM hearts. Scale: 500 μm (top) and 50 μm (bottom). Representative HE and MASSON staining images of indicated groups. Bar graphs on the right show quantitation of data (n = 5). C The expression of BNP, MMP2 and MMP9 in heart of EAM mice with or without LIPUS-0.35 MPa (n = 3). Representative FACS quantification of Treg and macrophage percentage of splenic (D) or heart (E) isolated immune cells from EAM mice under LIPUS-0.35 MPa stimulation until day 56 (n = 5). * Represents control vs. EAM; # represents LIPUS-0.35 MPa vs. EAM; + represents LIPUS-0.35 MPa vs. control. (Data were shown as the mean ± SD, Student’s t-test for two-group comparison and one-way analysis of variance, followed by Tukey’s multiple comparison test for comparison of multiple groups; #P or +P < 0.05, **P or ##P < 0.01, ***P or ###P < 0.001.) LIPUS: low-intensity pulsed ultrasound; EAM: experimental autoimmune myocarditis; EF: ejection fraction; FS: fractional shortening; HE: hematoxylin and eosin; FACS: fluorescence activated cell sorting; MMP2: matrix metallopeptidase 2; MMP9: matrix metallopeptidase 9; BNP: B-type natriuretic peptide

References

    1. Tschope C, et al. Myocarditis and inflammatory cardiomyopathy: current evidence and future directions. Nat Rev Cardiol. 2021;18:169–193. doi: 10.1038/s41569-020-00435-x. - DOI - PMC - PubMed
    1. Ma J, et al. Dexmedetomidine-mediated prevention of renal ischemia-reperfusion injury depends in part on cholinergic anti-inflammatory mechanisms. Anesth Analg. 2020;130:1054–1062. doi: 10.1213/ANE.0000000000003820. - DOI - PubMed
    1. Park J, Kang JW, Lee SM. Activation of the cholinergic anti-inflammatory pathway by nicotine attenuates hepatic ischemia/reperfusion injury via heme oxygenase-1 induction. Eur J Pharmacol. 2013;707:61–70. doi: 10.1016/j.ejphar.2013.03.026. - DOI - PubMed
    1. Rosas-Ballina M, et al. Splenic nerve is required for cholinergic antiinflammatory pathway control of TNF in endotoxemia. Proc Natl Acad Sci U S A. 2008;105:11008–11013. doi: 10.1073/pnas.0803237105. - DOI - PMC - PubMed
    1. Wang W, et al. The role of the cholinergic anti-inflammatory pathway in septic cardiomyopathy. Int Immunopharmacol. 2021;90:107160. doi: 10.1016/j.intimp.2020.107160. - DOI - PubMed