. 2023 Apr 17;24(1):74.
doi: 10.1186/s13059-023-02914-z.

JBrowse 2: a modular genome browser with views of synteny and structural variation

Affiliations

JBrowse 2: a modular genome browser with views of synteny and structural variation

Colin Diesh et al. Genome Biol. .

Abstract

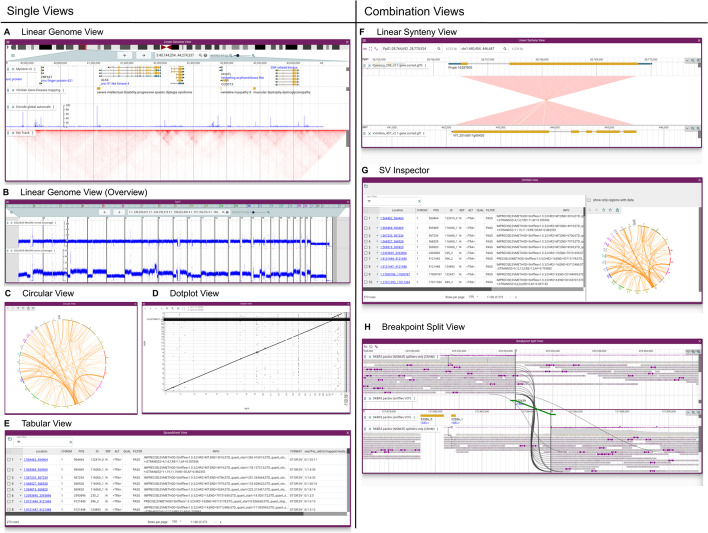
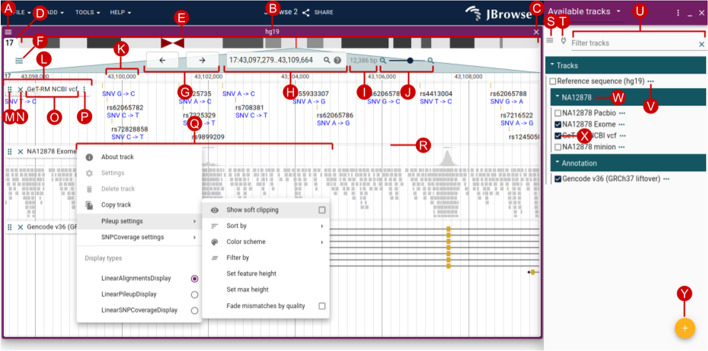
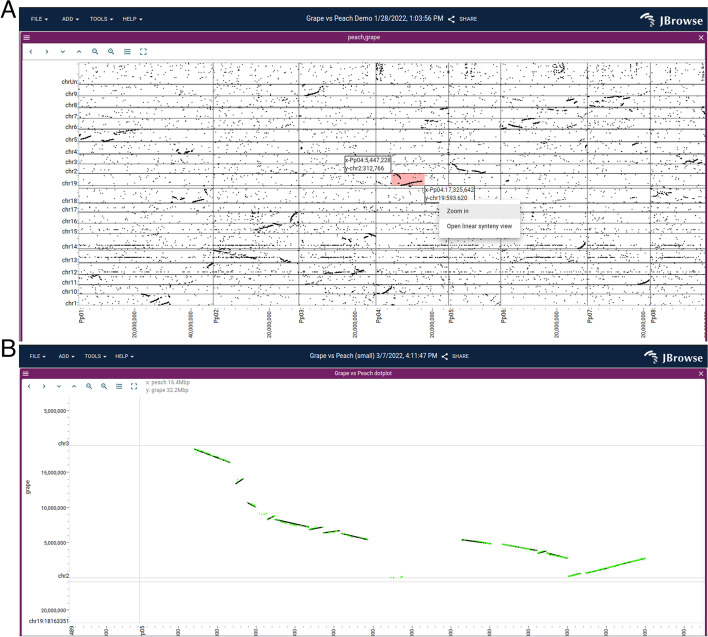
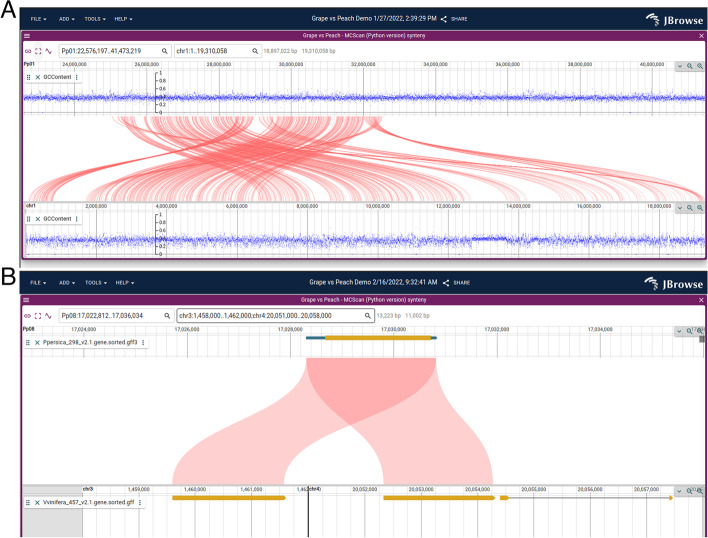
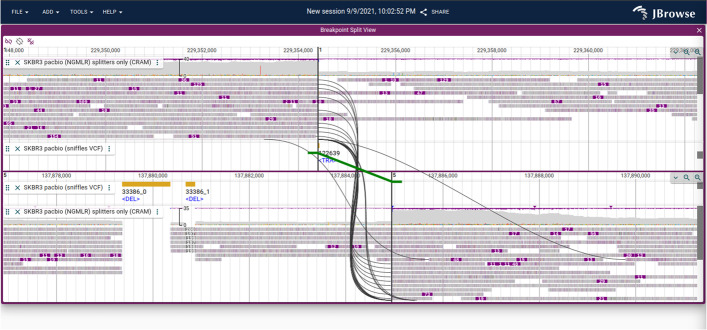
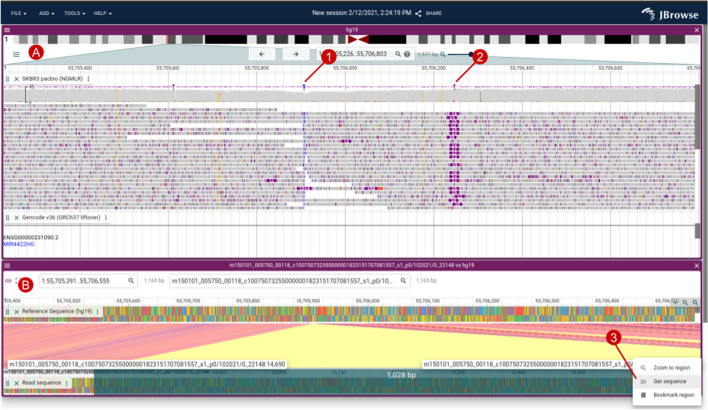
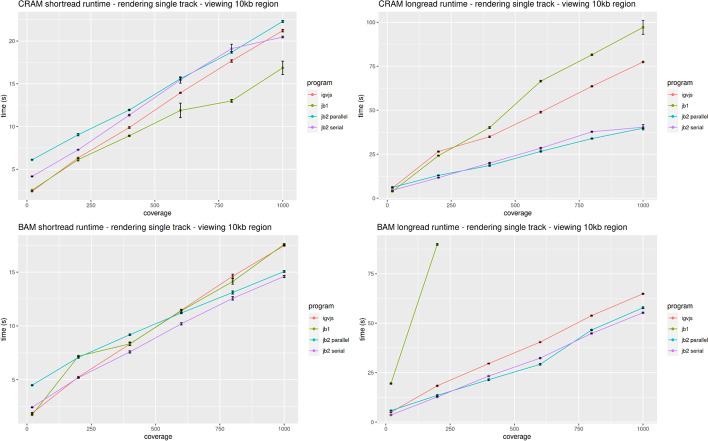
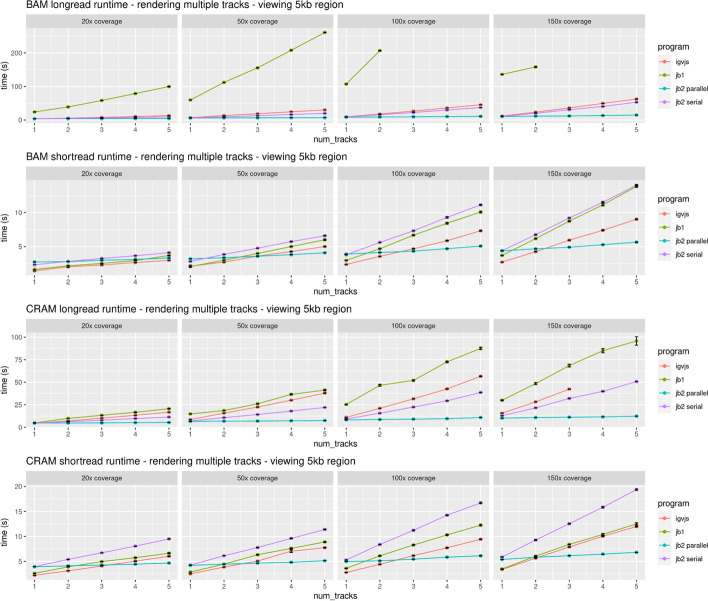
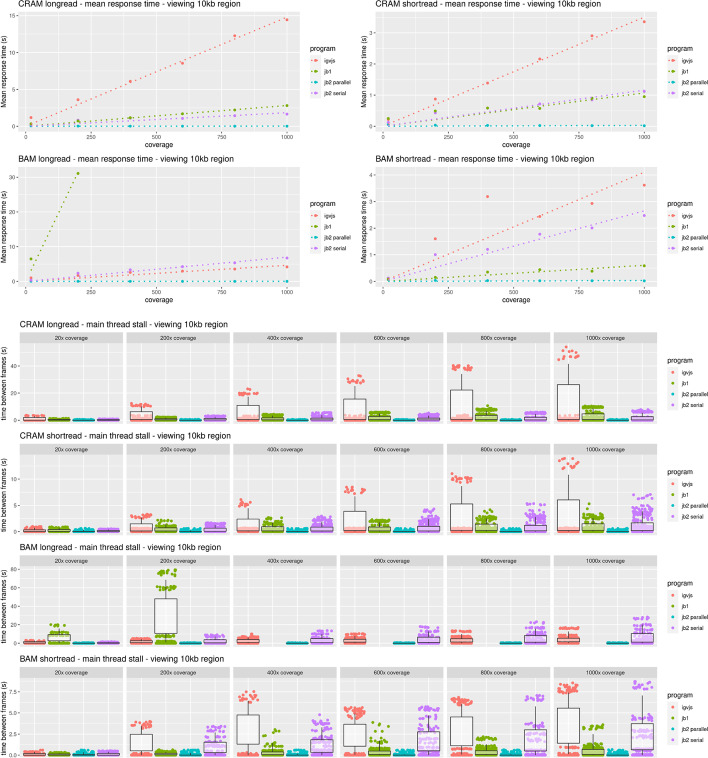
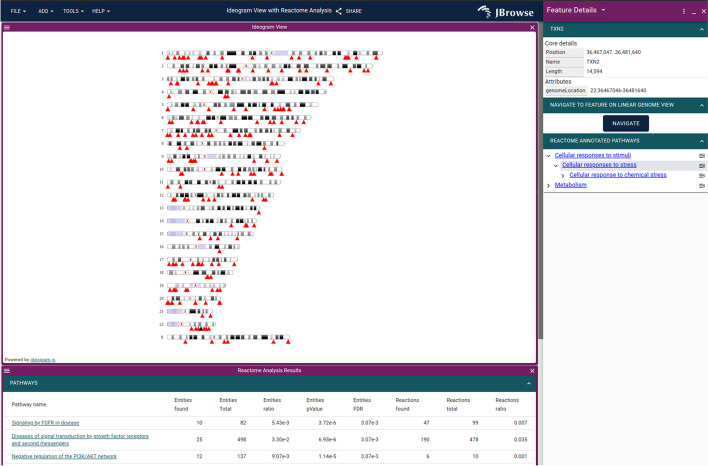
We present JBrowse 2, a general-purpose genome annotation browser offering enhanced visualization of complex structural variation and evolutionary relationships. It retains core features of JBrowse while adding new views for synteny, dotplots, breakpoints, gene fusions, and whole-genome overviews. It allows users to share sessions, open multiple genomes, and navigate between views. It can be embedded in a web page, used as a standalone application, or run from Jupyter notebooks or R sessions. These improvements are enabled by a ground-up redesign using modern web technology. We describe application functionality, use cases, performance benchmarks, and implementation notes for web administrators and developers.


Conflict of interest statement

The authors declare that they have no competing interests.

Figures

Fig. 1
Fig. 1
JBrowse 2 integrates many views into a single application. A The Linear Genome View displaying gene annotations, quantitative signals, and a Hi-C track. B The Linear Genome View can provide a whole genome overview, here showing tumor vs normal sequencing coverage in the COLO829 cell line [17]. C The Circular View gives an overview of long-range relationships within and between chromosomes (here, they are translocations in an SKBR3 cancer genome). D The Dotplot View shows relationships between two sequences (in this case the relationship between hg19 and hg38 human genomes). E The Tabular View summarizes features in a sortable, filterable list, showing in this example the SKBR3 variant calls from Sniffles. F The Linear Synteny View shows relationships between two genomes (in this case, peach and grape) each of which is rendered using a Linear Genome View. G The SV Inspector allows inspection of structural variants by combining a Tabular View and a Circular View; here, both the Tabular and Circular views are visualizing a VCF file of translocations in an SKBR3 cancer genome called using Sniffles [18]. H The Breakpoint Split View shows events such as gene fusions and translocations (in this case, in the SKBR3 cancer genome) by aligning two Linear Genome Views and tracing the split or paired read mappings across the two views
Fig. 2
Fig. 2
The Linear Genome View is the core view of JBrowse, allowing flexible and interactive examination of a genome sequence and its annotations. The user interface elements annotated on this diagram include (A) view menu, (B) view name, (C) close view button, (D) reference sequence name, (E) reference sequence overview with optional ideogram, (F) open track selector button, (G) pan buttons, (H) location and search box, (I) view size, (J) zoom buttons and slider, (K) major ruler coordinates, (L) track label, (M) track drag handle, (N) track close button, (O) track name, (P) track menu button, (Q) track menu, (R) track resize handle, (S) track selector menu button, (T) connection menu button, (U) track selector filter, (V) track configuration menu button, (W) collapsible category label, (X) track select box, and (Y) add track/connection button
Fig. 3
Fig. 3
A A dotplot showing a whole-genome alignment of the grape vs peach genome, computed by minimap2 and loaded in PAF format, reveals a large-scale syntenic structure. The user can click and drag on this view, highlighting an area shown by the small pink rectangle, to open up a detailed view (B) showing multiple synteny tracks, with individual gene pairs (green) and larger syntenic blocks (black) from MCScan
Fig. 4
Fig. 4
A The Linear Synteny View comparing the grape and peach genomes using data from MCScan reveals a complex rearrangement. B A close-up view of a gene duplication visualized with the Linear Synteny View, with discontinuous regions (chr3 and chr4) displayed side by side on the bottom panel
Fig. 5
Fig. 5
The SV Inspector showing structural variants in the SKBR3 breast cancer long read dataset. The SV Inspector places the Circular and Tabular views side-by-side. On the left, the Tabular view can be filtered using simple text expression filters (text box at top left), or column filters (controls in each column header). The results of filtering are reflected in the circular view at right
Fig. 6
Fig. 6
A Breakpoint Split View showing a chromosomal translocation connecting chr1 and chr5 in the SKBR3 breast cancer cell line. The split long read alignments are connected using curved black lines, and the variant call itself is shown with a green line with directional “feet” showing which sides of the breakpoint are joined
Fig. 7
Fig. 7
A An alignments track showing SKBR3 PacBio alignments, with a large (> 1000 bp) insertion highlighted by soft-clipped reads in blue (1) and a smaller insertion in purple (2). B The “Read vs ref” view created by right-clicking a read in the Alignments Track creates a Linear Synteny View comparing the read vs the reference genome, which allows you to see the inserted non-reference bases easily. Users can also select regions on the read or reference sequence and select “Get sequence” (3)
Fig. 8
Fig. 8
JBrowse 2’s performance is comparable to igv.js and significantly exceeds JBrowse 1’s performance on large long read datasets, as reflected in these benchmarks rendering aligned reads of varying coverage and file formats in a 10-kb region. The incomplete data for JBrowse 1 on the BAM long-read benchmark reflects the fact that JBrowse 1 times out this benchmark (i.e., its rendering time exceeds 5 min). Full details of the benchmark can be found under “Performance and Scalability benchmark details” in the “Methods” section
Fig. 9
Fig. 9
When displaying multiple tracks at once, JBrowse 2’s parallel rendering strategy shows significant gains compared to single-threaded (serial) strategies, as reflected in these benchmarks rendering aligned reads of varying coverage and file formats in a 5-kb region. The incomplete data for JBrowse 1 and igv.js on some of the benchmarks reflects the fact that these apps time out our benchmark under some circumstances (i.e., rendering time exceeds 5 min). Full details of the benchmark can be found under “Performance and Scalability benchmark details” in the “Methods” section
Fig. 10
Fig. 10
JBrowse 2’s parallel rendering strategy yields significant improvements in user interface responsiveness, as reflected in these benchmarks rendering aligned reads of varying coverage and file types in a 10-kb region. We define the response time as the delay, during the rendering phase of the benchmark, from a randomly sampled time point until the time the next frame is rendered. This directly reflects the perceived delay between when a user initiates an action and when the app responds. The response time is a random variable; its expectation gives a sense of average lag, while its variation gives a sense of how unpredictable the user interface delays can be. Panel A plots the expectation of the response time as a function of sequencing coverage. At high coverage, JBrowse 2’s parallel strategy maintains a low response time, in contrast to single-threaded strategies whose response time can grow large, with the perception that the browser is “hanging” or “frozen.” The relationship between response time and coverage is approximately linear for all browsers, as shown by the dotted linear regression fit. The incomplete data for JBrowse 1 on the BAM long read benchmark reflects the fact that the simulation times out (rendering time > 5 min). Panel B shows the same data plotted as a scatterplot of time between frames. The plotted points show the raw time between frame values and are overlaid with boxplots that show the variation in response times (25th and 75th percentiles shown in the boxes, 5th and 95th percentiles shown in the tails). Full details of the benchmark can be found under “Performance and Scalability benchmark details” in the “Methods” section
Fig. 11
Fig. 11
The ideogram view showing the Reactome pathway analysis on a gene list using the JBrowse 2 Ideogram plugin, which uses ideogram.js [39]

References

    1. Stein LD, Mungall C, Shu S, Caudy M, Mangone M, Day A, et al. The generic genome browser: a building block for a model organism system database. Genome Res. 2002;12(10):1599–1610. doi: 10.1101/gr.403602. - DOI - PMC - PubMed
    1. Skinner ME, Uzilov AV, Stein LD, Mungall CJ, Holmes IH. JBrowse: a next-generation genome browser. Genome Res. 2009;19(9):1630–1638. doi: 10.1101/gr.094607.109. - DOI - PMC - PubMed
    1. Buels R, Yao E, Diesh CM, Hayes RD, Munoz-Torres M, Helt G, et al. JBrowse: a dynamic web platform for genome visualization and analysis. Genome Biol. 2016;17:66. doi: 10.1186/s13059-016-0924-1. - DOI - PMC - PubMed
    1. McKay SJ, Vergara IA, Stajich JE. Using the Generic Synteny Browser (GBrowse_syn). Curr Protoc Bioinformatics. 2010;Chapter 9:Unit 9.12. - PMC - PubMed
    1. Carver TJ, Rutherford KM, Berriman M, Rajandream MA, Barrell BG, Parkhill J. ACT: the Artemis comparison tool. Bioinformatics. 2005;21(16):3422–3423. doi: 10.1093/bioinformatics/bti553. - DOI - PubMed

Publication types