. 2023 Apr 17;15(1):47.
doi: 10.1186/s13321-023-00708-w.

Exploring QSAR models for activity-cliff prediction

Affiliations

Exploring QSAR models for activity-cliff prediction

Markus Dablander et al. J Cheminform. .

Abstract

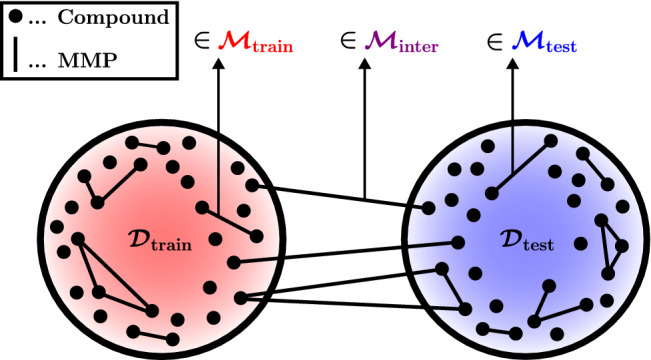
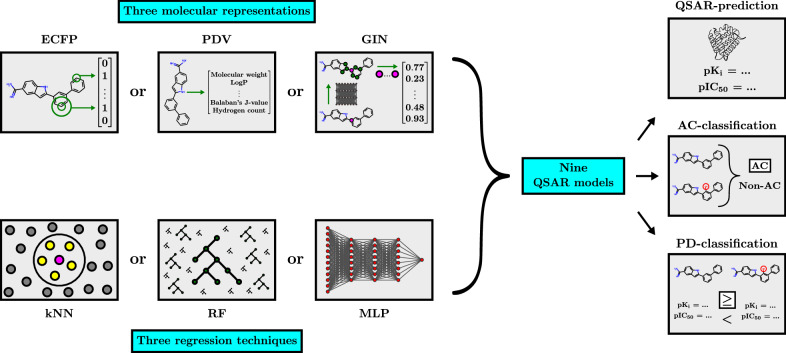
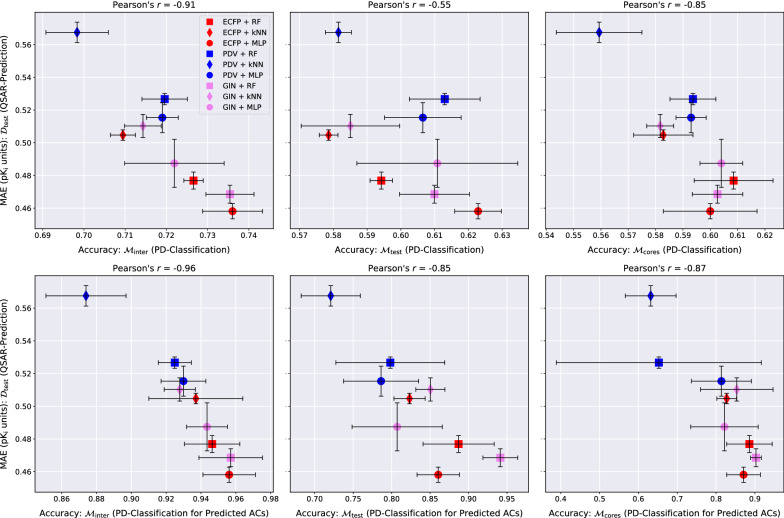
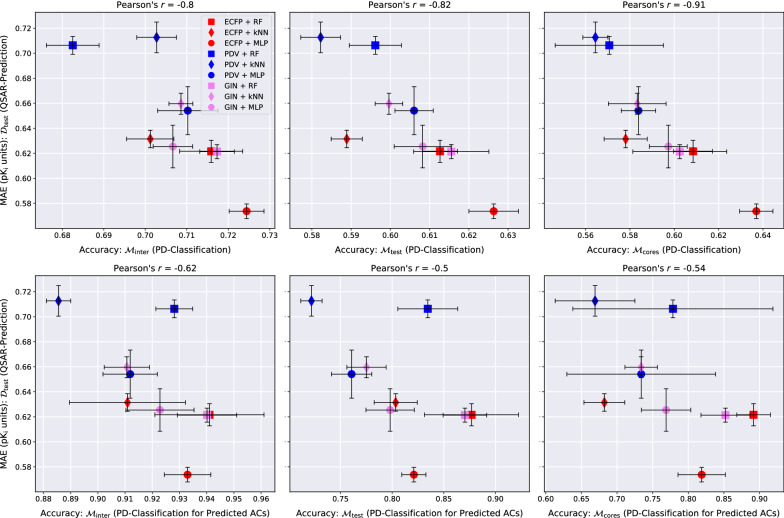
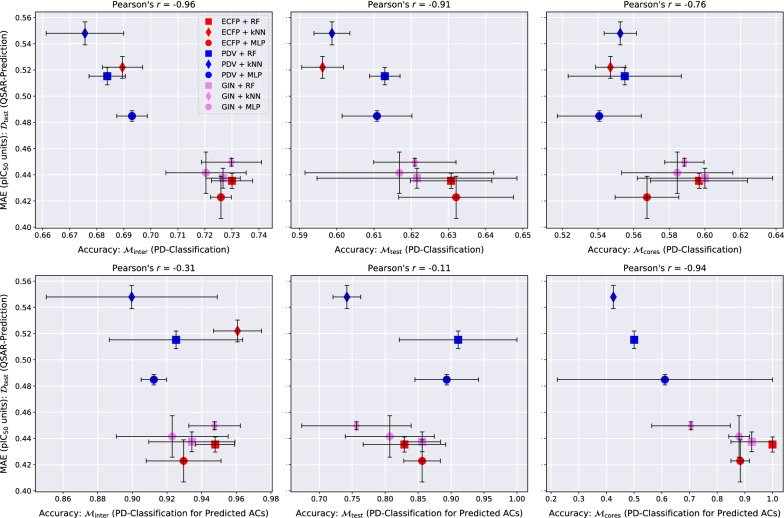
Introduction and methodology: Pairs of similar compounds that only differ by a small structural modification but exhibit a large difference in their binding affinity for a given target are known as activity cliffs (ACs). It has been hypothesised that QSAR models struggle to predict ACs and that ACs thus form a major source of prediction error. However, the AC-prediction power of modern QSAR methods and its quantitative relationship to general QSAR-prediction performance is still underexplored. We systematically construct nine distinct QSAR models by combining three molecular representation methods (extended-connectivity fingerprints, physicochemical-descriptor vectors and graph isomorphism networks) with three regression techniques (random forests, k-nearest neighbours and multilayer perceptrons); we then use each resulting model to classify pairs of similar compounds as ACs or non-ACs and to predict the activities of individual molecules in three case studies: dopamine receptor D2, factor Xa, and SARS-CoV-2 main protease.

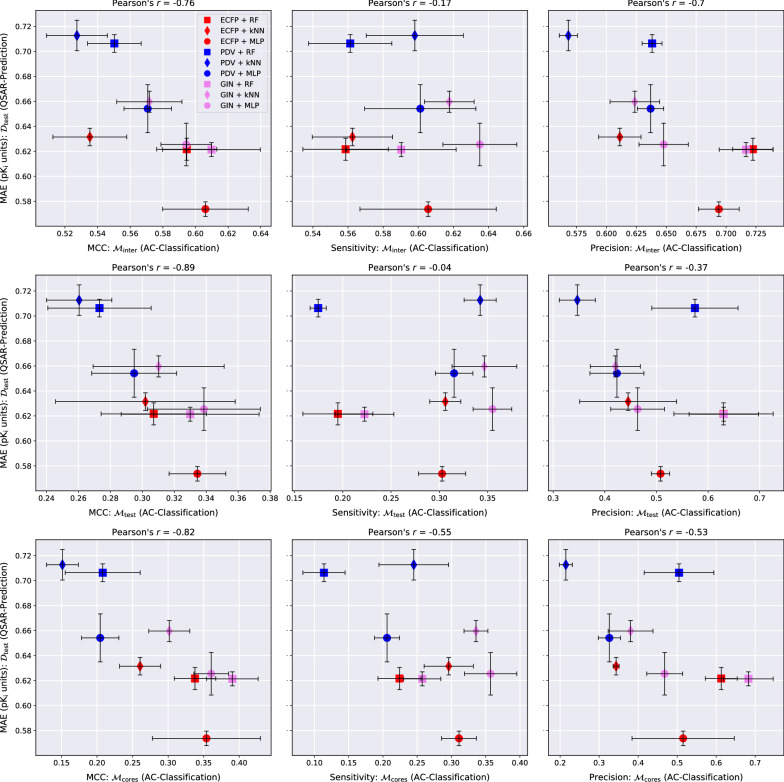
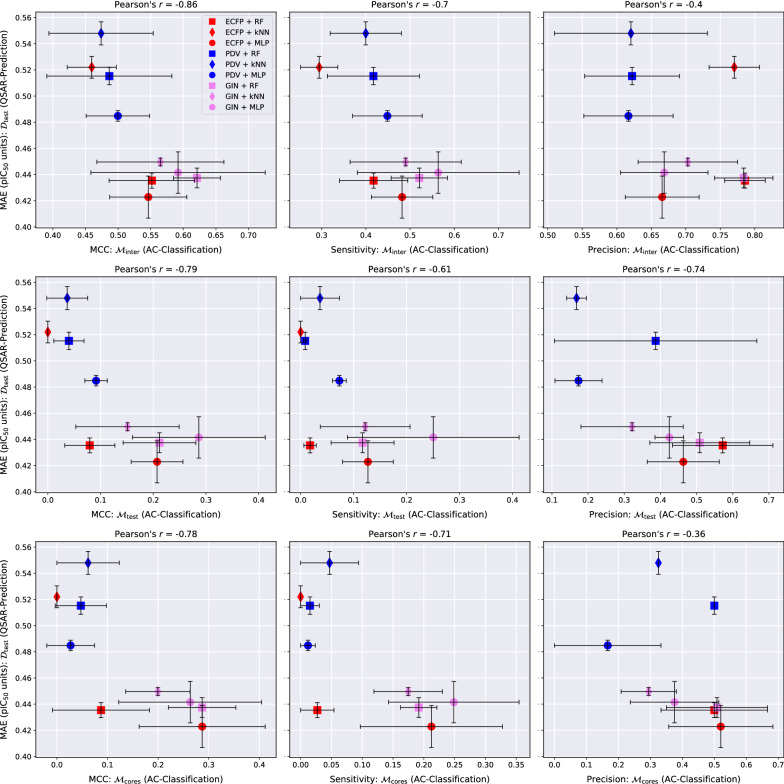
Results and conclusions: Our results provide strong support for the hypothesis that indeed QSAR models frequently fail to predict ACs. We observe low AC-sensitivity amongst the evaluated models when the activities of both compounds are unknown, but a substantial increase in AC-sensitivity when the actual activity of one of the compounds is given. Graph isomorphism features are found to be competitive with or superior to classical molecular representations for AC-classification and can thus be employed as baseline AC-prediction models or simple compound-optimisation tools. For general QSAR-prediction, however, extended-connectivity fingerprints still consistently deliver the best performance amongs the tested input representations. A potential future pathway to improve QSAR-modelling performance might be the development of techniques to increase AC-sensitivity.

Keywords: Activity cliff prediction; Activity cliffs; Binding affinity prediction; Deep learning; Extended-connectivity fingerprints; Graph isomorphism networks; Machine learning; Molecular representation; Physicochemical descriptors; QSAR modelling.


Conflict of interest statement

The authors declare that they have no competing interests.

Figures

Fig. 1
Fig. 1
Example of an activity cliff (AC) for blood coagulation factor Xa. A small structural transformation in the upper compound leads to an increase in inhibitory activity of almost three orders of magnitude. Both compounds were identified in the same ChEMBL assay with ID 658338
Fig. 2
Fig. 2
Illustration of our data splitting strategy. We distinguish between three MMP-sets, Mtrain,Minter and Mtest, depending on whether both MMP-compounds are in Dtrain, one MMP-compound is in Dtrain and the other one is in Dtest, or both MMP-compounds are in Dtest. We additionally consider a fourth MMP-set, Mcores, consisting of the MMPs in Mtest whose structural cores do not appear in MtrainMinter
Fig. 3
Fig. 3
Schematic showing the combinatorial experimental methodology used for the study. Each molecular representation method is systematically combined with each regression technique, giving a total of nine QSAR models. Each QSAR model is trained and evaluated for QSAR-prediction, AC-classification and PD-classification within a 2-fold cross validation scheme repeated with 3 random seeds. For each of the 23=6 trials, an extensive inner hyperparameter-optimisation loop on the training set is performed for each QSAR model
Fig. 4
Fig. 4
QSAR-prediction- and AC-classification results for dopamine receptor D2. For each plot, the x-axis corresponds to a combination of MMP-set and AC-classification performance metric and the y-axis shows the QSAR-prediction performance on the molecular test set Dtest. The total length of each error bar equals twice the standard deviation of the performance metric measured over all mk=32=6 hyperparameter-optimised models. For each plot, the lower right corner corresponds to strong performance at both prediction tasks
Fig. 5
Fig. 5
QSAR-prediction- and AC-classification results for factor Xa. For each plot, the x-axis corresponds to a combination of MMP-set and AC-classification performance metric and the y-axis shows the QSAR-prediction performance on the molecular test set Dtest. The total length of each error bar equals twice the standard deviation of the performance metric measured over all mk=32=6 hyperparameter-optimised models. For each plot, the lower right corner corresponds to strong performance at both prediction tasks
Fig. 6
Fig. 6
QSAR-prediction- and AC-classification results for SARS CoV-2 main protease. For each plot, the x-axis corresponds to a combination of MMP-set and AC-classification performance metric and the y-axis shows the QSAR-prediction performance on the molecular test set Dtest. The total length of each error bar equals twice the standard deviation of the performance metric measured over all mk=32=6 hyperparameter-optimised models. The precision of the AC-classification task is lacking for the ECFP + kNN technique on Mtest and Mcores since this method produced only negative AC-predictions for all trials on this data set. For each plot, the lower right corner corresponds to strong performance at both prediction tasks
Fig. 7
Fig. 7
QSAR-prediction- and PD-classification results for dopamine receptor D2. Each column corresponds to an upper plot and a lower plot for one of the MMP-sets Minter, Mtest or Mcores. The x-axis of each upper plot indicates the PD-classification accuracy on the full MMP-set; the x-axis of each lower plot indicates the PD-classification accuracy on a restricted MMP-set only consisting of MMP predicted to be ACs by the respective method. The y-axis of each plot shows the QSAR-prediction performance on the molecular test set Dtest. The total length of each error bar equals twice the standard deviation of the performance metrics measured over all mk=32=6 hyperparameter-optimised models. For each plot, the lower right corner corresponds to strong performance at both prediction tasks
Fig. 8
Fig. 8
QSAR-prediction- and PD-classification results for factor Xa. Each column corresponds to an upper plot and a lower plot for one of the MMP-sets Minter, Mtest or Mcores. The x-axis of each upper plot indicates the PD-classification accuracy on the full MMP-set; the x-axis of each lower plot indicates the PD-classification accuracy on a restricted MMP-set only consisting of MMP predicted to be ACs by the respective method. The y-axis of each plot shows the QSAR-prediction performance on the molecular test set Dtest. The total length of each error bar equals twice the standard deviation of the performance metrics measured over all mk=32=6 hyperparameter-optimised models. For each plot, the lower right corner corresponds to strong performance at both prediction tasks
Fig. 9
Fig. 9
QSAR-prediction- and PD-classification results for SARS-CoV-2 main protease. Each column corresponds to an upper plot and a lower plot for one of the MMP-sets Minter, Mtest or Mcores. The x-axis of each upper plot indicates the PD-classification accuracy on the full MMP-set; the x-axis of each lower plot indicates the PD-classification accuracy on a restricted MMP-set only consisting of MMP predicted to be ACs by the respective method. The y-axis of each plot shows the QSAR-prediction performance on the molecular test set Dtest. The total length of each error bar equals twice the standard deviation of the performance metrics measured over all mk=32=6 hyperparameter-optimised models. The accuracy of the PD-classification task for predicted ACs is lacking for the ECFP + kNN technique on Mtest and Mcores since this method produced only negative AC-predictions for all trials on this data set. For each plot, the lower right corner corresponds to strong performance at both prediction tasks

References

    1. Achdout H, Aimon A, Bar-David E, Barr H, Ben-Shmuel A, Bennett J, Bilenko VA, Bilenko VA, Boby ML, Borden B, Bowman GR, Brun J, et al (2022) Open science discovery of oral non-covalent SARS-CoV-2 main protease inhibitor therapeutics. BioRxiv. https://www.biorxiv.org/content/early/2022/01/30/2020.10.29.339317. Accessed 19 Jan 2023
    1. Akiba T, Sano S, Yanase T, Ohta T, Koyama M (2019) Optuna: a next-generation hyperparameter optimization framework. In: Proceedings of the 25th ACM SIGKDD International Conference on Knowledge Discovery & Data Mining, pp 2623–2631
    1. Asawa Y, Yoshimori A, Bajorath J, Nakamura H. Prediction of an MMP-1 inhibitor activity cliff using the SAR matrix approach and its experimental validation. Sci Rep. 2020;10(1):14710. doi: 10.1038/s41598-020-71696-2. - DOI - PMC - PubMed
    1. Bajorath J. Exploring activity cliffs from a chemoinformatics perspective. Mol Inf. 2014;33(6–7):438–442. doi: 10.1002/minf.201400026. - DOI - PubMed
    1. Beck JM, Springer C. Quantitative structure-activity relationship models of chemical transformations from matched pairs analyses. J Chem Inf Model. 2014;54(4):1226–1234. doi: 10.1021/ci500012n. - DOI - PubMed

LinkOut - more resources