. 2023 Mar 13:12:267.
doi: 10.12688/f1000research.131522.1. eCollection 2023.

Seasonal effects decouple SARS-CoV-2 haplotypes worldwide

Affiliations

Seasonal effects decouple SARS-CoV-2 haplotypes worldwide

Tre Tomaszewski et al. F1000Res. .

Abstract

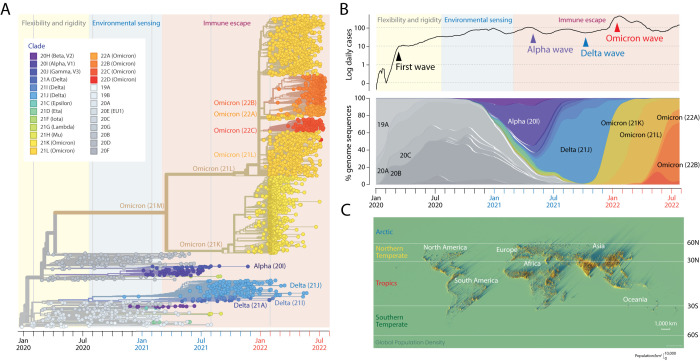
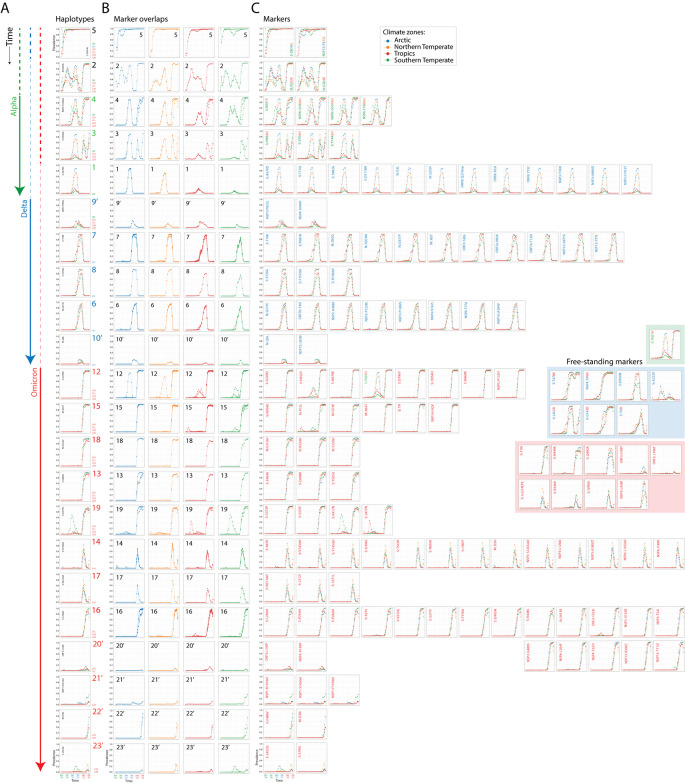
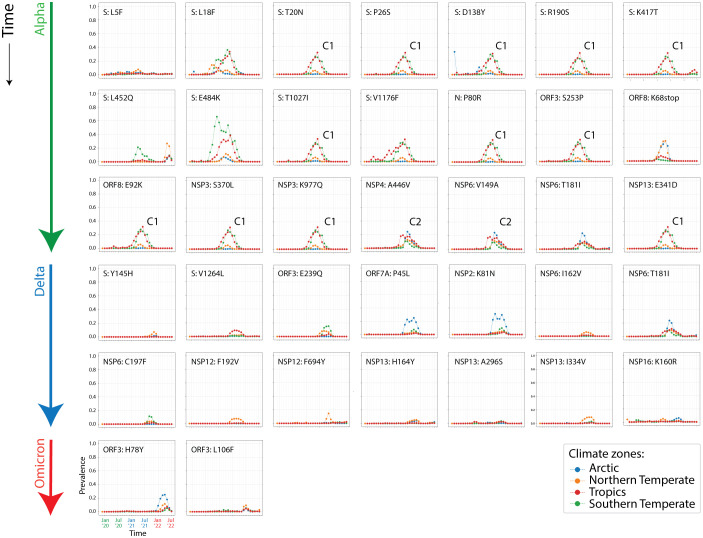
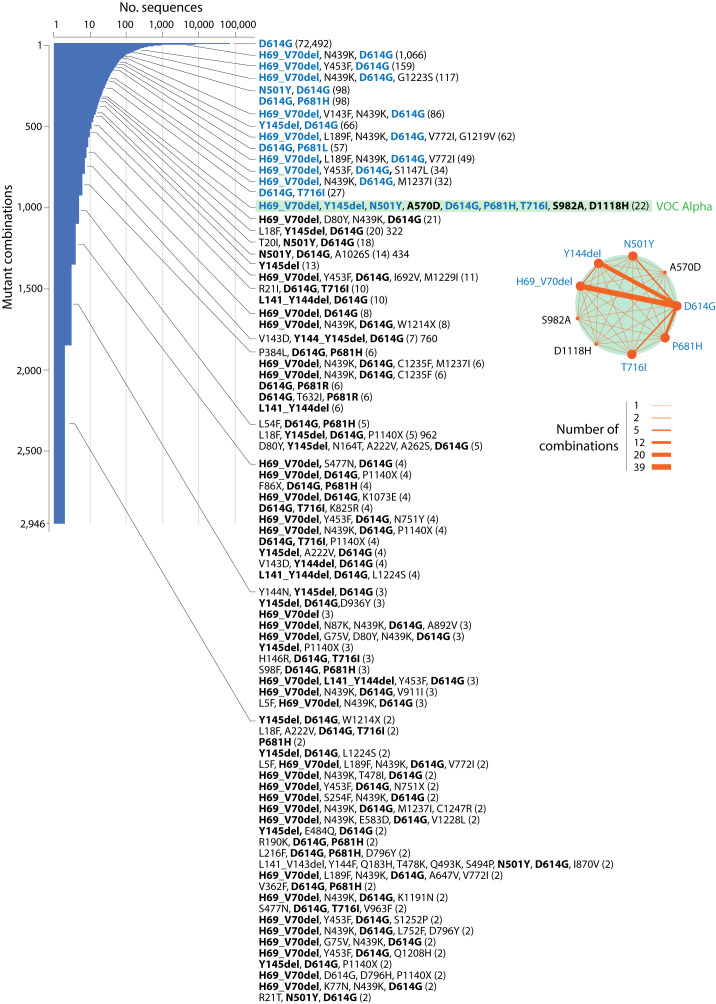
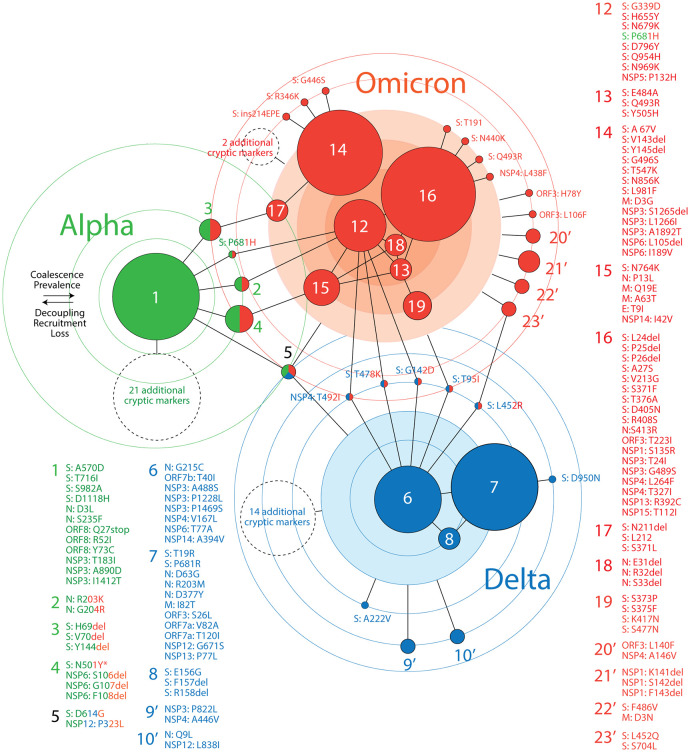
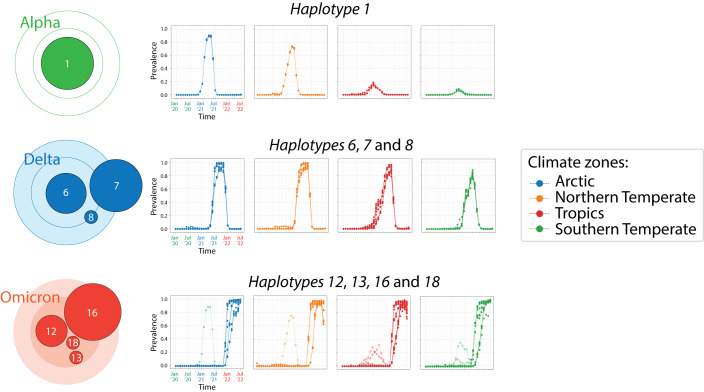
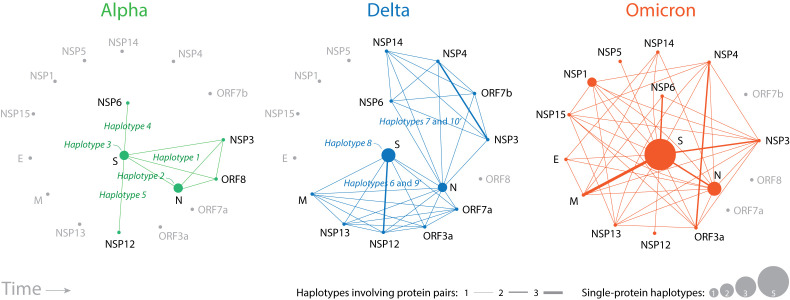
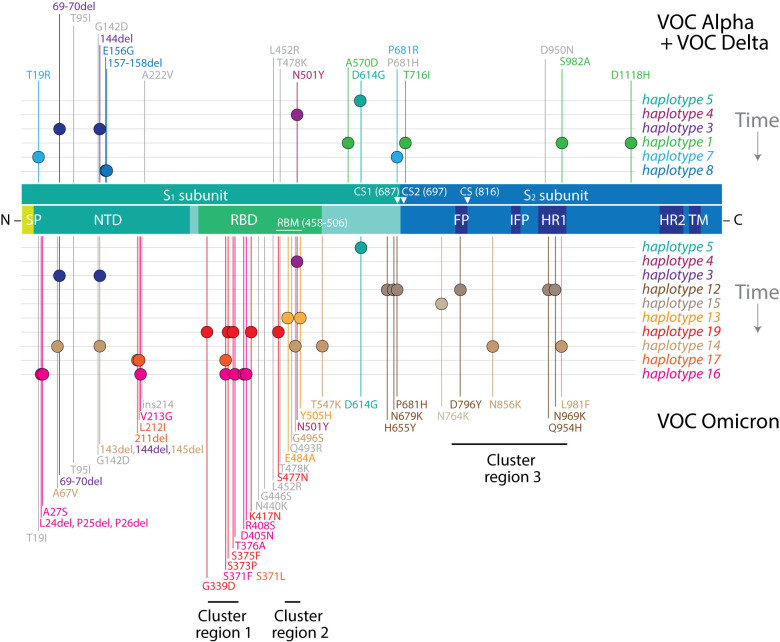
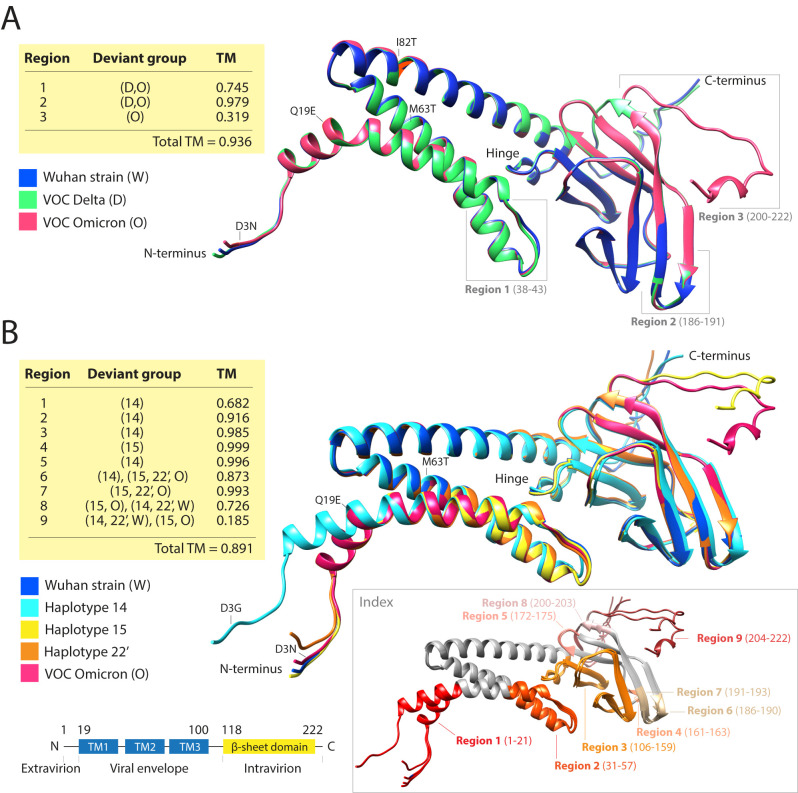
Background: Variants of concern (VOCs) have been replacing each other during the still rampant COVID-19 pandemic. As a result, SARS-CoV-2 populations have evolved increasingly intricate constellations of mutations that often enhance transmissibility, disease severity, and other epidemiological characteristics. The origin and evolution of these constellations remain puzzling. Methods: Here we study the evolution of VOCs at the proteome level by analyzing about 12 million genomic sequences retrieved from GISAID on July 23, 2022. A total 183,276 mutations were identified and filtered with a relevancy heuristic. The prevalence of haplotypes and free-standing mutations was then tracked monthly in various latitude corridors of the world. Results: A chronology of 22 haplotypes defined three phases driven by protein flexibility-rigidity, environmental sensing, and immune escape. A network of haplotypes illustrated the recruitment and coalescence of mutations into major VOC constellations and seasonal effects of decoupling and loss. Protein interaction networks mediated by haplotypes predicted communications impacting the structure and function of proteins, showing the increasingly central role of molecular interactions involving the spike (S), nucleocapsid (N), and membrane (M) proteins. Haplotype markers either affected fusogenic regions while spreading along the sequence of the S-protein or clustered around binding domains. Modeling of protein structure with AlphaFold2 showed that VOC Omicron and one of its haplotypes were major contributors to the distortion of the M-protein endodomain, which behaves as a receptor of other structural proteins during virion assembly. Remarkably, VOC constellations acted cooperatively to balance the more extreme effects of individual haplotypes. Conclusions: Our study uncovers seasonal patterns of emergence and diversification occurring amid a highly dynamic evolutionary landscape of bursts and waves. The mapping of genetically-linked mutations to structures that sense environmental change with powerful ab initio modeling tools demonstrates the potential of deep-learning for COVID-19 predictive intelligence and therapeutic intervention.

Keywords: AlphaFold2; epidemic calendar; membrane protein; mutation; protein interaction; protein structural prediction; proteome; seasonality; spike protein.


Conflict of interest statement

No competing interests were disclosed.

Figures

Figure 1.
Figure 1.. The mutational landscape of SARS-CoV-2 at the end of July 2022 and the spread of variants throughout the world during the pandemic.
(A). A maximum likelihood phylogenetic tree describing the worldwide history of the SARS-CoV-2 genome. The timetree of 2,906 genomes randomly sampled between December 2019 and July 29, 2022 was obtained from Nextstrain. The tree unfolds the time of genome collection date from left to right. Its leaves (taxa indicated with circles) are colored according to the clade (group of taxa with a common evolutionary origin) and emerging variants of concern (VOCs) nomenclature. The origin of VOCs occurs when a clade originates along branches of the phylogeny. Note the early arrival of VOC Alpha, followed by VOC Delta and then VOC Omicron. The timeline of clades and VOCs shows three successive phases driven by proteome flexibility and rigidity, environmental sensing, and vaccine-driven immune escape, which are shaded in light yellow, blue, and salmon, respectively ( Caetano-Anollés et al., 2022). (B). Plots showing the number of daily newly confirmed cases per million people (on a logarithmic scale and as 7-day rolling averages) and smooth percentages of genomes holding major VOCs since the beginning of the recorded COVID-19 pandemic. COVID-19 and genome data were retrieved from Johns Hopkins Univ., CSSE and GISAID, respectively. (C). Spike map showing a 3-dimensional representation of the population density of the world as a grid of vertical bars depicting the number of people per square kilometer of land area. Each spike represents the population in a grid of 2 km × 2 km. Light and shadow effects on the map highlight areas of high population density but also isolated population centers. Note the map shows no land. Instead it highlights locations where the 7.8 billion people of the world live (as of 2020). Labeled latitudes were used to split the world into four regions: Arctic, Northern Temperate, Tropics, and Southern Temperate, which are identified with colored letterings on the map and used to divide the genomic pool of the virus. The spike map is courtesy of Alasdair Rae, Automatic Knowledge Ltd., Sheffield, UK, reproduced with permission.
Figure 2.
Figure 2.. A chronology of SARS-CoV-2 haplotypes.
(A) Accumulation plots illustrating haplotypes emerging along a timeline of the pandemic with labels colored according to VOCs they belong and time unfolding from top to bottom. The accumulation plot of a single mutant illustrates each haplotype. (B) Accumulation plot overlaps of all mutant markers of haplotypes describe haplotype decoupling for individual climatic zones. (C) Accumulation plots for mutants belonging to each haplotype are displayed from left to right. Mutant names are colored according to the VOCs they belong. The inset shows accumulation plots for free-standing markers.
Figure 3.
Figure 3.. Other SARS-CoV-2 markers arising together with the VOC waves.
Prevalence plots describing the accumulation of minor markers that failed to achieve large prevalence levels but were retained by the relevance heuristic. Note the existence of two cryptic haplotypes associated with the rise of VOC Alpha in Tropical and Southern Temperate corridors (C1 and C2).
Figure 4.
Figure 4.. A frequency distribution plot describing the prevalence of S-protein mutant combinations appearing prior to VOC emergence during the first year of the COVID-19 pandemic.
The plot is indexed with the names of 83 combinations harboring markers of the VOC Alpha constellation (in bold) and corresponding prevalence (number of sequences in parentheses). Note that VOC Alpha was reported a month after the sampling of the 137,605 S-protein sequences analyzed on November 14, 2020. Markers highlighted in blue have a higher prevalence than the 22 sequences of a single mutant combination harboring all markers of VOC Alpha (highlighted in green). They represent 67% of markers of that combination, offering ample opportunities for recombination. The inset shows a network of co-occurrence of markers of the VOC Alpha constellation. Nodes are mutations and links of the graph represent their co-occurrence. Data were retrieved from the Supplementary Tables in Showers et al. (2022).
Figure 5.
Figure 5.. A network of haplotypes illustrating the worldwide emergence of major VOCs.
Nodes and edges of the graph describe how haplotypes and free-standing mutations coalesce towards the inner-most circles of the major VOC constellations. Haplotype and mutant labels are colored according to their presence in VOCs worldwide. Cryptic markers are listed in Figure 3.
Figure 6.
Figure 6.. Patterns of mutation accumulation in core haplotypes of VOCs revealing seasonal behavior.
Separate plots describe overlaps of mutation accumulation curves for the four climate zones. Open symbols describe regions of the timeline unrelated to the VOC of reference.
Figure 7.
Figure 7.. Evolving network diagrams describing SARS-CoV-2 protein interactions mediated by haplotypes.
Nodes are proteins and lines in the graph are protein interactions manifesting as joint protein presence in a haplotype. Node size is proportional to the number of haplotypes harboring markers that affect only one protein. Line width is proportional to the number of haplotypes sharing the same pair of proteins. Larger nodes and thicker lines highlight the significance of protein roles.
Figure 8.
Figure 8.. Haplotype markers clustered along the S-protein sequence.
The diagram maps mutations onto the amino acid sequence of the S-protein molecule, from the N- to the C-terminus, with markers specific to VOCs Alpha and Delta indicated at the top and those specific to VOC Omicron at the bottom. Mutations in VOC Omicron cluster in groups according to haplotype and are enriched in immune evasion functions associated with the RBD region. Mutations in haplotypes 1, 12, and 14 spread through the molecule and likely make up networks of allosteric interactions. Clusters 1, 2, and 3 represent mutation targets at codon sites known to be either negatively selected or evolving under no detectable selection in non-Omicron sequences ( Martin et al., 2022). Markers highlighted in grey represent free-standing mutations. SP, signal peptide; NTD, N-terminal domain; RBD, receptor-binding domain; RBM, receptor-binding motif; CS, cleavage site; FP, fusion peptide; IFP, internal fusion peptide; HR1, heptad repeat 1; HR2, heptad repeat 2; TM, transmembrane domain.
Figure 9.
Figure 9.. AlphaFold2 ab initio modeling of evolving atomic structures of the M-protein.
The structures of reference and mutated variants of the M-protein were modeled directly from their sequences using AlphaFold2. Their structures were then aligned, and regions exhibiting structural differences (indexed in the structural models) were further examined qualitatively by determining deviant groups and quantitatively using template modeling (TM) scores. (A) Structural alignment of M-protein molecules of the reference Wuhan strain and those typical of VOC Delta and VOC Omicron. The locations of mutations and regions with structural differences are indicated. The table describes deviant groups and TM-scores for the different regions. (B) Structural alignment of modeled molecules evaluating structural effects of mutations of the VOC Omicron constellation and related haplotypes. The left inset at the bottom shows a schematic view of M-protein domain organization mapped onto the sequence. The three transmembrane helices (TM1, TM2 and TM3) make up a bundle and multiple strands make up the C-terminal β-sheet domain. The right inset colors structural deviant regions directly onto the aligned structures.
Figure 10.
Figure 10.. Alignment of long and short forms of the M-protein acquired by cryo-EM (thin backbones) to AlphaFold2 predicted structures (thick backbones).
The superimposed regions with residues separated by distances less than 5 Å colored in red.

Similar articles

Cited by

References

    1. Arndt AL, Larson BJ, Hogue BG: A conserved domain in the coronavirus membrane protein tail is important for virus assembly. J. Virol. 2010;84:11418–11428. 10.1128/JVI.01131-10 - DOI - PMC - PubMed
    1. Ayona D, Fournier P-E, Henrissat B, et al. : Utilization of galectins by pathogens for infection. Front. Immunol. 2020;11:1877. 10.3389/fimmu.2020.01877 - DOI - PMC - PubMed
    1. Bai Z, Cao Y, Liu W, et al. : The SARS-CoV-2 nucleocapsid protein and Its role in viral structure, biological functions, and a potential target for drug or vaccine mitigation. Viruses. 2021;13:1115. 10.3390/v13061115 - DOI - PMC - PubMed
    1. Becerra-Flores M, Cardozo T: SARS-CoV-2 viral spike G614 mutation exhibits higher case fatality rate. Int. J. Clin. Pract. 2020;74:e13525. 10.1111/ijcp.13525 - DOI - PMC - PubMed
    1. Burra P, Soto-Díaz K, Chalen I, et al. : Temperature and latitude correlate with SARS-CoV-2 epidemiological variables but not with genomic change worldwide. Evol. Bioinform. Online. 2021;17:117693432198969. 10.1177/1176934321989695 - DOI - PMC - PubMed

Publication types