

Identification of key genes in bovine muscle development by co-expression analysis
- PMID: 37070092
- PMCID: PMC10105563
- DOI: 10.7717/peerj.15093
Identification of key genes in bovine muscle development by co-expression analysis
Abstract
Background: Skeletal muscle is not only an important tissue involved in exercise and metabolism, but also an important part of livestock and poultry meat products. Its growth and development determines the output and quality of meat to a certain extent, and has an important impact on the economic benefits of animal husbandry. Skeletal muscle development is a complex regulatory network process, and its molecular mechanism needs to be further studied.
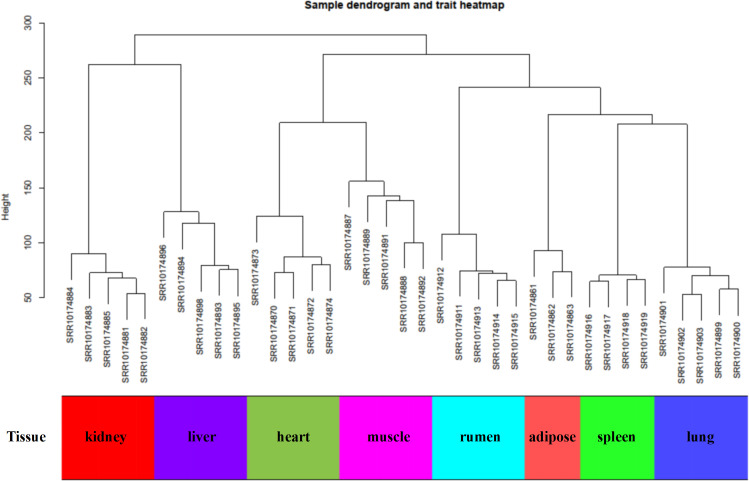
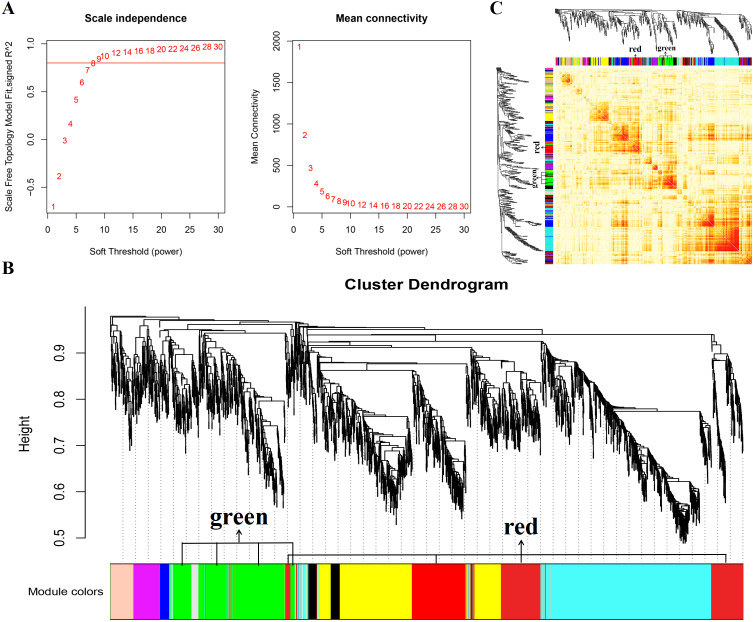
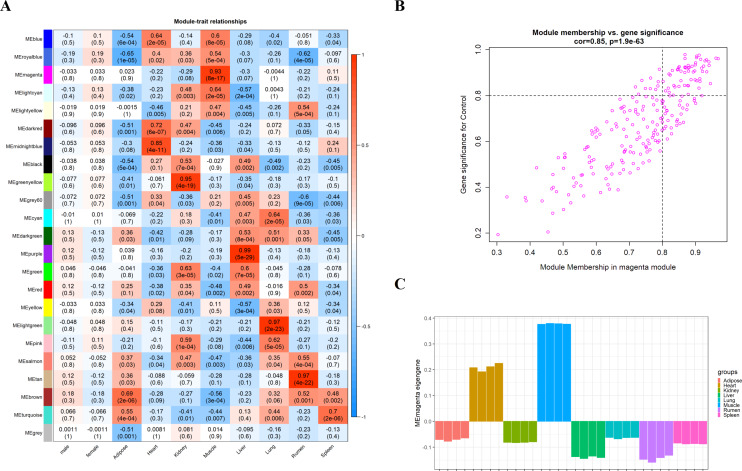
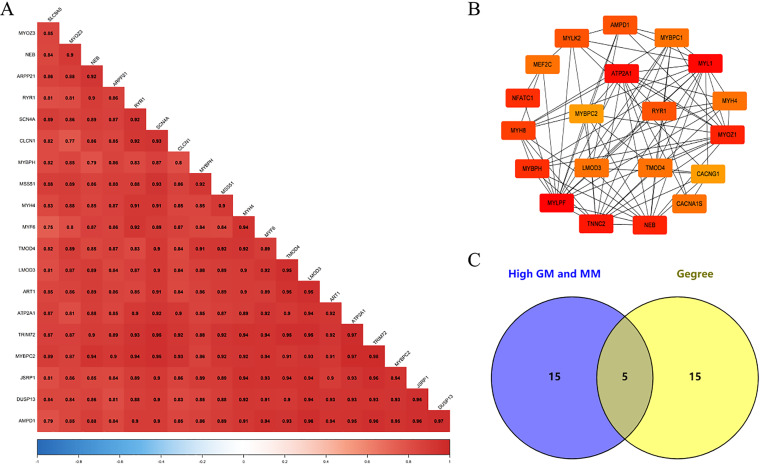
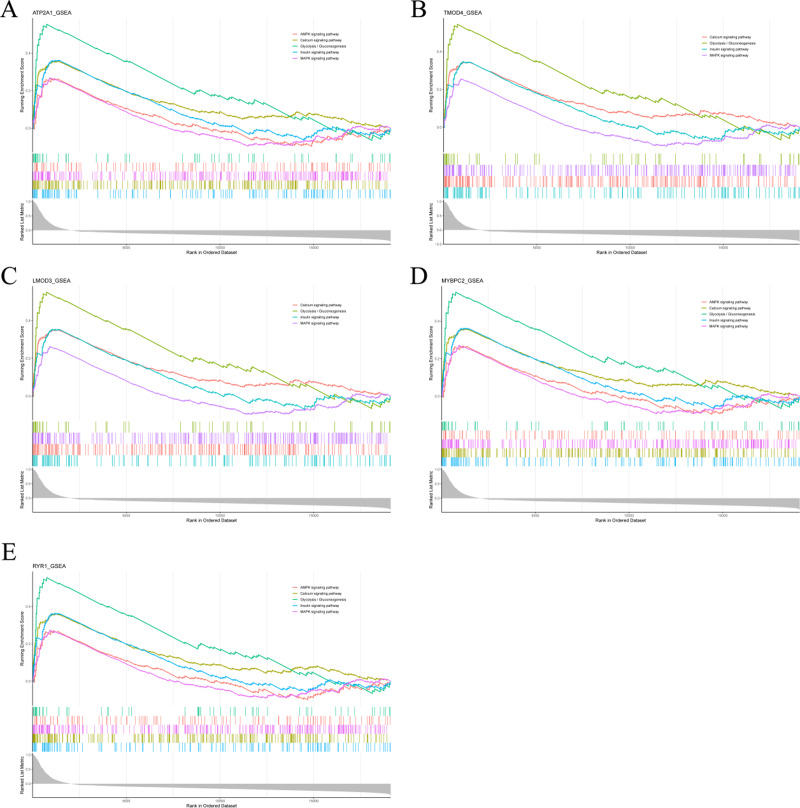
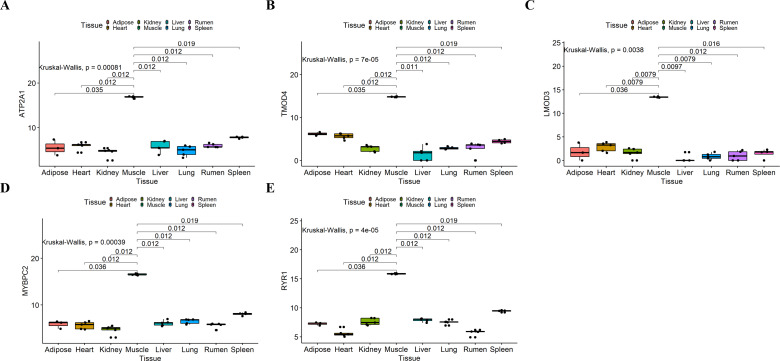
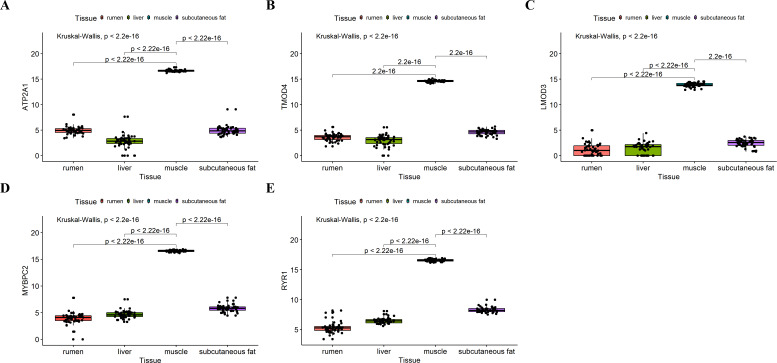
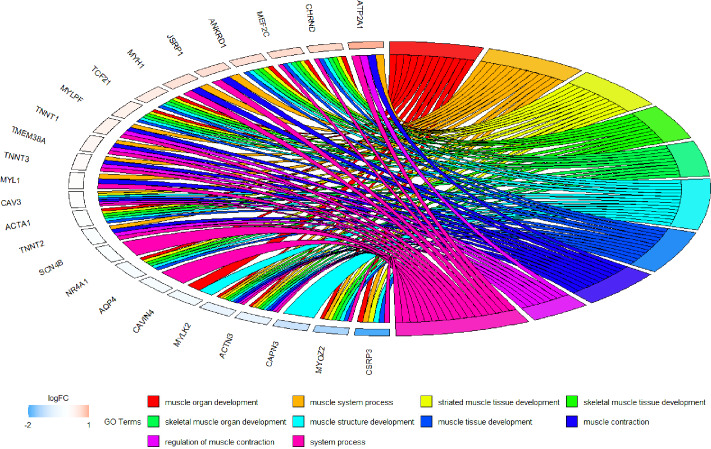
Method: We used a weighted co-expression network (WGCNA) and single gene set enrichment analysis (GSEA) to study the RNA-seq data set of bovine tissue differential expression analysis, and the core genes and functional enrichment pathways closely related to muscle tissue development were screened. Finally, the accuracy of the analysis results was verified by tissue expression profile detection and bovine skeletal muscle satellite cell differentiation model in vitro (BSMSCs).
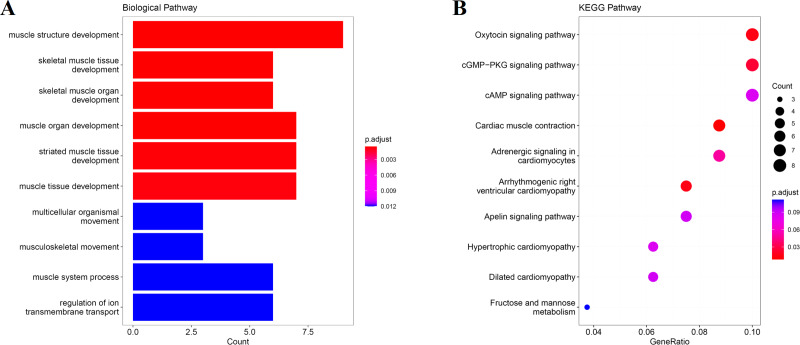
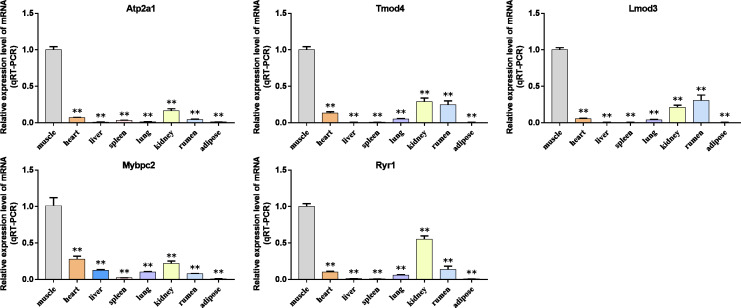
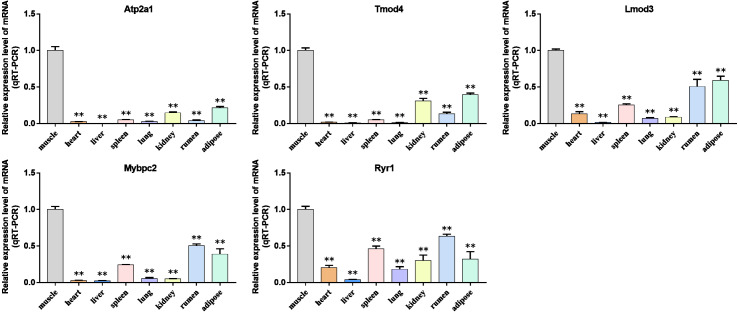
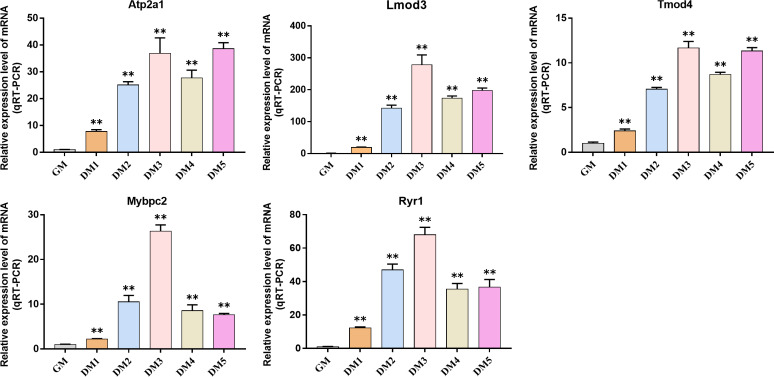
Results: In this study, Atp2a1, Tmod4, Lmod3, Ryr1 and Mybpc2 were identified as marker genes in muscle tissue, which are mainly involved in glycolysis/gluconeogenesis, AMPK pathway and insulin pathway. The assay results showed that these five genes were highly expressed in muscle tissue and positively correlated with the differentiation of bovine BSMSCs.
Conclusions: In this study, several muscle tissue characteristic genes were excavated, which may play an important role in muscle development and provide new insights for bovine molecular genetic breeding.
Keywords: BSMSCs; Breeding; GSEA; Muscle; WGCNA.
©2023 Zhang et al.
Conflict of interest statement
The authors declare there are no competing interests.
Figures
Similar articles
-
Gene co-expression networks associated with carcass traits reveal new pathways for muscle and fat deposition in Nelore cattle.BMC Genomics. 2019 Jan 10;20(1):32. doi: 10.1186/s12864-018-5345-y. BMC Genomics. 2019. PMID: 30630417 Free PMC article.
-
Identification of differentially expressed genes in longissimus dorsi muscle between Wei and Yorkshire pigs using RNA sequencing.Genes Genomics. 2018 Apr;40(4):413-421. doi: 10.1007/s13258-017-0643-3. Epub 2017 Dec 19. Genes Genomics. 2018. PMID: 29892843
-
Machine Learning-Based Analysis of Differentially Expressed Genes in the Muscle Transcriptome Between Beef Cattle and Dairy Cattle.Int J Mol Sci. 2025 May 23;26(11):5046. doi: 10.3390/ijms26115046. Int J Mol Sci. 2025. PMID: 40507856 Free PMC article.
-
Differential expression profile of microRNA in yak skeletal muscle and adipose tissue during development.Genes Genomics. 2020 Nov;42(11):1347-1359. doi: 10.1007/s13258-020-00988-8. Epub 2020 Sep 29. Genes Genomics. 2020. PMID: 32996042
-
Molecular signatures of muscle growth and composition deciphered by the meta-analysis of age-related public transcriptomics data.Physiol Genomics. 2020 Aug 1;52(8):322-332. doi: 10.1152/physiolgenomics.00020.2020. Epub 2020 Jul 13. Physiol Genomics. 2020. PMID: 32657225
Cited by
-
Transcriptome analysis revealed differences in gene expression in sheep muscle tissue at different developmental stages.BMC Genom Data. 2024 Jun 7;25(1):54. doi: 10.1186/s12863-024-01235-9. BMC Genom Data. 2024. PMID: 38849746 Free PMC article.
-
M6A-modified BFSP1 induces aerobic glycolysis to promote liver cancer growth and metastasis through upregulating tropomodulin 4.Mol Biomed. 2025 Mar 18;6(1):17. doi: 10.1186/s43556-025-00256-9. Mol Biomed. 2025. PMID: 40097750 Free PMC article.
-
Current Research, Industrialization Status, and Future Perspective of Cultured Meat.Food Sci Anim Resour. 2024 Mar;44(2):326-355. doi: 10.5851/kosfa.2024.e13. Epub 2024 Mar 1. Food Sci Anim Resour. 2024. PMID: 38764517 Free PMC article. Review.
-
Study of the Association Between SNPs and External Pelvimetry Measurements in Romanian Simmental Cattle.Animals (Basel). 2025 May 29;15(11):1586. doi: 10.3390/ani15111586. Animals (Basel). 2025. PMID: 40509051 Free PMC article.
-
Comprehensive SHAP Values and Single-Cell Sequencing Technology Reveal Key Cell Clusters in Bovine Skeletal Muscle.Int J Mol Sci. 2025 Feb 26;26(5):2054. doi: 10.3390/ijms26052054. Int J Mol Sci. 2025. PMID: 40076676 Free PMC article.
References
-
- Botia JA, Vandrovcova J, Forabosco P, Guelfi S, D’Sa K, The United Kingdom Brain Expression Consortium. Hardy J, Lewis CM, Ryten M, Weale ME. An additional k-means clustering step improves the biological features of WGCNA gene co-expression networks. BMC Systems Biology. 2017;11(1):47. doi: 10.1186/s12918-017-0420-6. - DOI - PMC - PubMed
-
- Chang MW, Yang JH, Tsitsipatis D, Yang X, Martindale JL, Munk R, Pandey PR, Banskota N, Romero B, Batish M, Piao Y, Mazan-Mamczarz K, De S, Abdelmohsen K, Wilson GM, Gorospe M. Enhanced myogenesis through lncFAM-mediated recruitment of HNRNPL to the MYBPC2 promoter. Nucleic Acids Research. 2022;50(22):13026–13044. doi: 10.1093/nar/gkac1174. - DOI - PMC - PubMed
Publication types
MeSH terms
LinkOut - more resources
Full Text Sources
