YTHDC1 positively regulates PTEN expression and plays a critical role in cisplatin resistance of bladder cancer
- PMID: 37070134
- PMCID: PMC10334275
- DOI: 10.1111/cpr.13404
YTHDC1 positively regulates PTEN expression and plays a critical role in cisplatin resistance of bladder cancer
Abstract
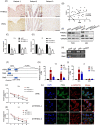
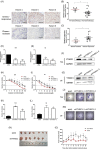
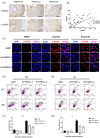
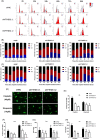
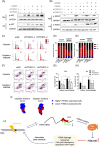
Activation of PI3K/AKT signalling by PTEN loss significantly enhances chemoresistance in bladder cancer. This study aims to evaluate PTEN regulation and identify targets that could be used to relieve chemoresistance. Expression of YTHDC1, γ-H2AX and PTEN were detected by IHC assay. Cell Counting Kit-8 assay, colony formation assay and tumour xenograft experiment evaluated cisplatin response. Flow cytometry and comet assay estimated cell apoptosis, cell cycle distribution and DNA repair capability. Quantitative real-time polymerase chain reaction, Western blot and RIP assay assessed binding properties between PTEN mRNA and YTHDC1. Silencing YTHDC1 in bladder cancer cells reduced PTEN expression and activated PI3K/AKT signalling by destabilizing PTEN mRNA in an m6 A-dependent manner. Low YTHDC1 expression indicated poor cisplatin sensitivity in bladder cancer patients. Reducing YTHDC1 expression promoted drug resistance to cisplatin, while over-expressing YTHDC1 promoted cisplatin sensitivity. Reducing YTHDC1 expression activated DNA damage response, which includes quicker cell cycle recovery, apoptosis evasion and an enhanced DNA repair capability, whereas these effects were attenuated when MK2206, a PI3K/AKT inhibitor was applied. We provide novel evidence that PTEN/PI3K/AKT signalling pathway could be regulated by YTHDC1 in an m6 A-dependent manner and highlight a critical role of YTHDC1 in cisplatin resistance of bladder cancer.
© 2023 The Authors. Cell Proliferation published by Beijing Institute for Stem Cell and Regenerative Medicine and John Wiley & Sons Ltd.
Conflict of interest statement
The authors declare no conflict of interest.
Figures
Similar articles
-
PMEPA1 interference activates PTEN/PI3K/AKT, thereby inhibiting the proliferation, invasion and migration of pancreatic cancer cells and enhancing the sensitivity to gemcitabine and cisplatin.Drug Dev Res. 2022 Feb;83(1):64-74. doi: 10.1002/ddr.21844. Epub 2021 Jun 30. Drug Dev Res. 2022. PMID: 34189738
-
MicroRNA-25-3p promotes cisplatin resistance in Non-small-cell lung carcinoma (NSCLC) through adjusting PTEN/PI3K/AKT route.Bioengineered. 2021 Dec;12(1):3219-3228. doi: 10.1080/21655979.2021.1939577. Bioengineered. 2021. PMID: 34266345 Free PMC article.
-
Effect of tumor suppressor gene PTEN on the resistance to cisplatin in human ovarian cancer cell lines and related mechanisms.Cancer Lett. 2008 Nov 28;271(2):260-71. doi: 10.1016/j.canlet.2008.06.012. Epub 2008 Jul 26. Cancer Lett. 2008. PMID: 18657898
-
BRCA1-IRIS overexpression promotes cisplatin resistance in ovarian cancer cells.Cancer Res. 2010 Nov 1;70(21):8782-91. doi: 10.1158/0008-5472.CAN-10-1352. Epub 2010 Oct 12. Cancer Res. 2010. PMID: 20940403
-
MicroRNA-106b promotes pituitary tumor cell proliferation and invasion through PI3K/AKT signaling pathway by targeting PTEN.Tumour Biol. 2016 Oct;37(10):13469-13477. doi: 10.1007/s13277-016-5155-2. Epub 2016 Jul 27. Tumour Biol. 2016. PMID: 27465551
Cited by
-
Multi-omics comprehensive analysis reveals the predictive value of N6-methyladenosine- related genes in prognosis and immune escape of bladder cancer.Cancer Biomark. 2024;40(1):79-94. doi: 10.3233/CBM-230286. Cancer Biomark. 2024. PMID: 38517777 Free PMC article.
-
Ramifications of m6A Modification on ncRNAs in Cancer.Curr Genomics. 2024 May 31;25(3):158-170. doi: 10.2174/0113892029296712240405053201. Epub 2024 Apr 9. Curr Genomics. 2024. PMID: 39087001 Free PMC article. Review.
-
Suppressing the progression of bladder cancer using cyclovirobuxine D based on network pharmacology and bioinformatics approaches.Naunyn Schmiedebergs Arch Pharmacol. 2025 Jul;398(7):8399-8417. doi: 10.1007/s00210-024-03754-9. Epub 2025 Jan 11. Naunyn Schmiedebergs Arch Pharmacol. 2025. PMID: 39797986
-
Epitranscriptomic RNA m6A Modification in Cancer Therapy Resistance: Challenges and Unrealized Opportunities.Adv Sci (Weinh). 2024 Dec 11;12(4):e2403936. doi: 10.1002/advs.202403936. Online ahead of print. Adv Sci (Weinh). 2024. PMID: 39661414 Free PMC article. Review.
-
Unraveling the role of long non-coding RNAs in therapeutic resistance in acute myeloid leukemia: New prospects & challenges.Noncoding RNA Res. 2024 May 20;9(4):1203-1221. doi: 10.1016/j.ncrna.2024.05.009. eCollection 2024 Dec. Noncoding RNA Res. 2024. PMID: 39036603 Free PMC article. Review.
References
-
- Trenta P, Calabro F, Cerbone L, Sternberg CN. Chemotherapy for muscle‐invasive bladder cancer. Curr Treat Options Oncol. 2016;17:6. - PubMed
-
- Lenis AT, Lec PM, Chamie K, Mshs MD. Bladder cancer: a review. JAMA. 2020;324:1980‐1991. - PubMed
-
- Jiang DM, Gupta S, Kitchlu A, et al. Defining cisplatin eligibility in patients with muscle‐invasive bladder cancer. Nat Rev Urol. 2021;18:104‐114. - PubMed
-
- Ghosh S. Cisplatin: the first metal based anticancer drug. Bioorg Chem. 2019;88:102925. - PubMed
-
- Galluzzi L, Senovilla L, Vitale I, et al. Molecular mechanisms of cisplatin resistance. Oncogene. 2012;31:1869‐1883. - PubMed
MeSH terms
Substances
Grants and funding
LinkOut - more resources
Full Text Sources
Medical
Research Materials
Miscellaneous

