. 2023 Jun 23;51(11):5755-5773.
doi: 10.1093/nar/gkad272.

Interaction of the La-related protein Slf1 with colliding ribosomes maintains translation of oxidative-stress responsive mRNAs

Affiliations

Interaction of the La-related protein Slf1 with colliding ribosomes maintains translation of oxidative-stress responsive mRNAs

Martin D Jennings et al. Nucleic Acids Res. .

Abstract

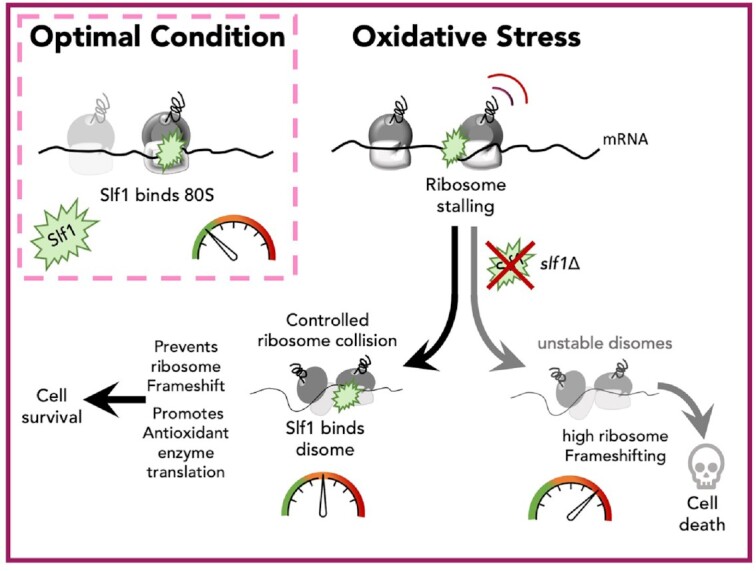
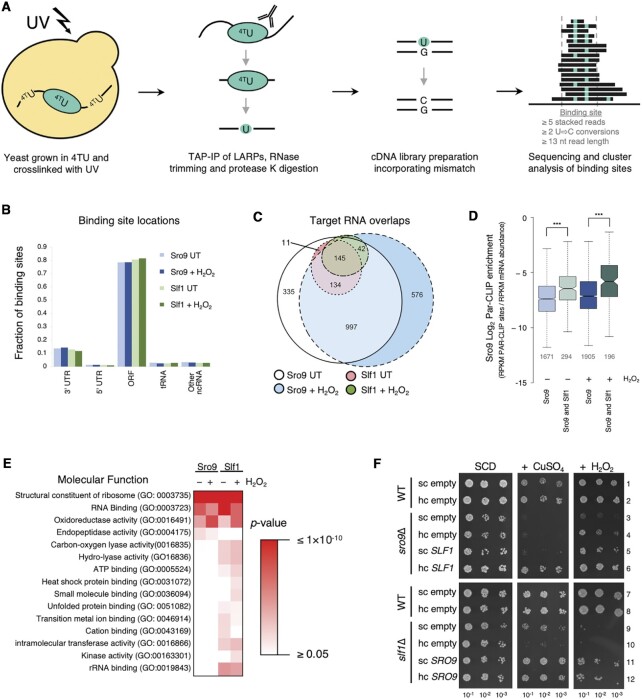
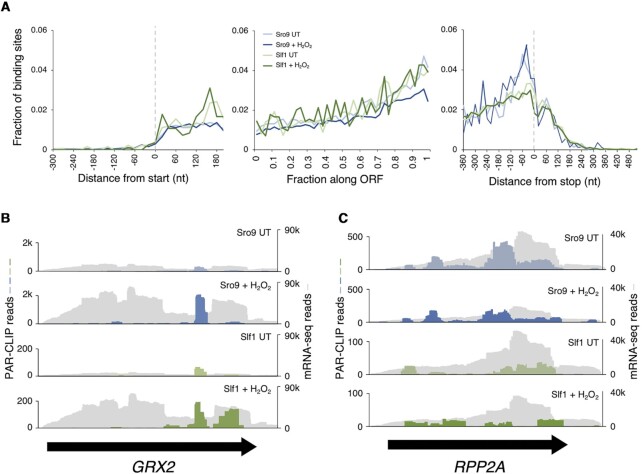
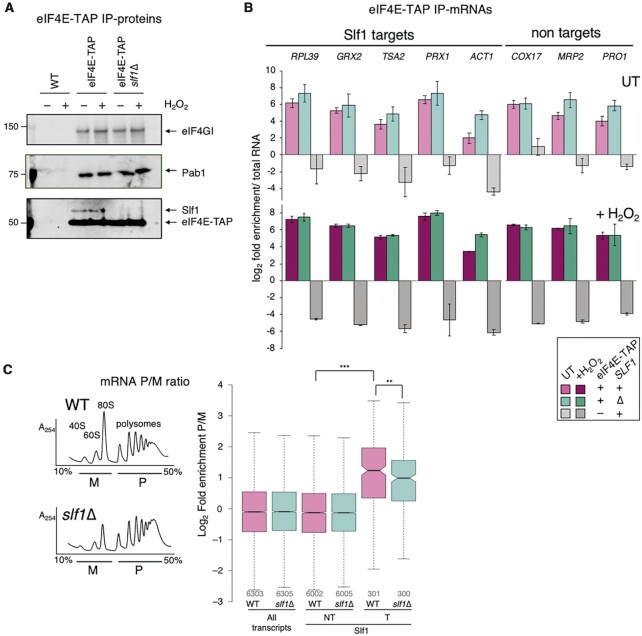
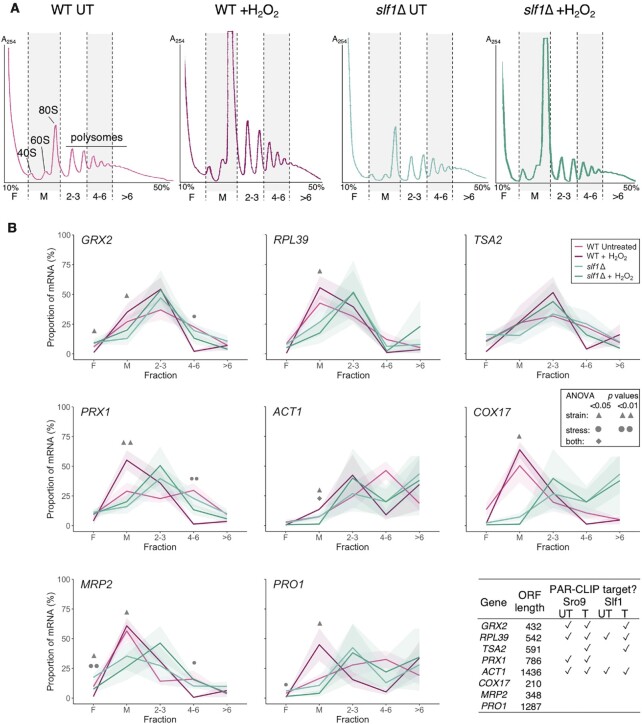
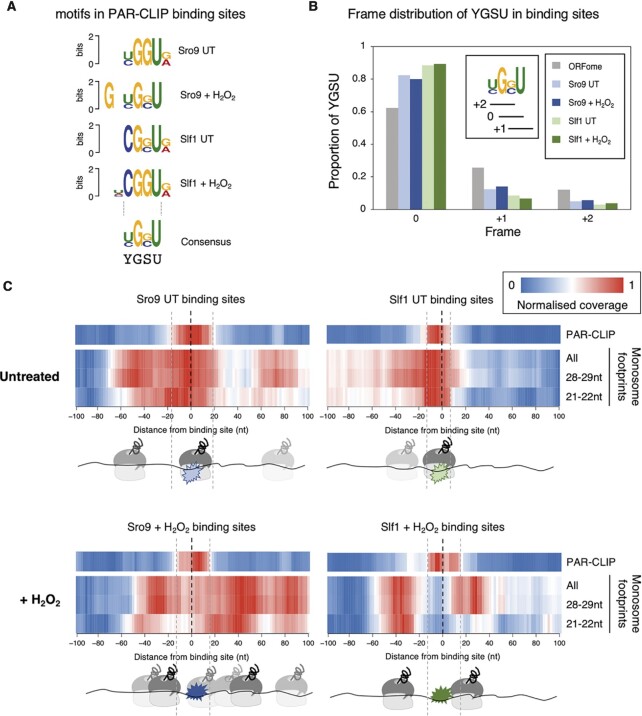
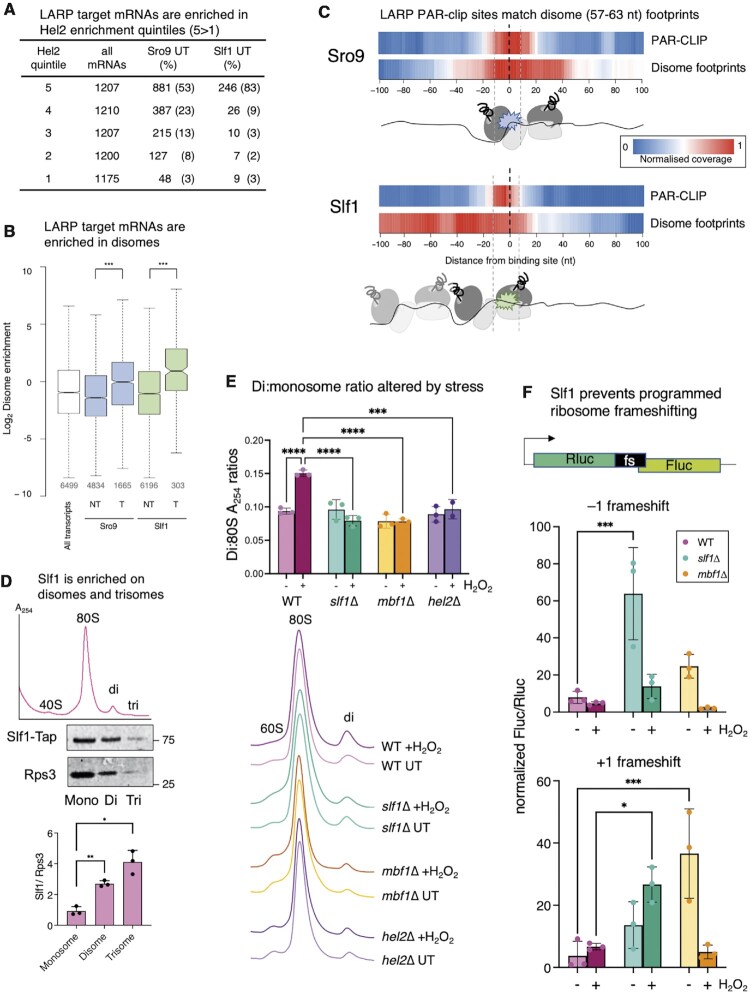
In response to oxidative stress cells reprogram gene expression to enhance levels of antioxidant enzymes and promote survival. In Saccharomyces cerevisiae the polysome-interacting La-related proteins (LARPs) Slf1 and Sro9 aid adaptation of protein synthesis during stress by undetermined means. To gain insight in their mechanisms of action in stress responses, we determined LARP mRNA binding positions in stressed and unstressed cells. Both proteins bind within coding regions of stress-regulated antioxidant enzyme and other highly translated mRNAs in both optimal and stressed conditions. LARP interaction sites are framed and enriched with ribosome footprints suggesting ribosome-LARP-mRNA complexes are identified. Although stress-induced translation of antioxidant enzyme mRNAs is attenuated in slf1Δ, these mRNAs remain on polysomes. Focusing further on Slf1, we find it binds to both monosomes and disomes following RNase treatment. slf1Δ reduces disome enrichment during stress and alters programmed ribosome frameshifting rates. We propose that Slf1 is a ribosome-associated translational modulator that stabilises stalled/collided ribosomes, prevents ribosome frameshifting and so promotes translation of a set of highly-translated mRNAs that together facilitate cell survival and adaptation to stress.


Figures

Graphical Abstract
Graphical Abstract
LaRP Slf1 stabilises ribosomes translating antioxidant enzyme mRNAs to promote cellular adaptation to stress.
Figure 1.
Figure 1.
Sro9 and Slf1 bind in mRNA coding regions. (A) Overview of PAR-CLIP protocol. (B) Distribution of Sro9 and Slf1 PAR-CLIP binding sites from 0.4 mM H2O2 treated or untreated (UT) yeast. Other ncRNA includes CUT, SUT, ncRNA, snRNA, snoRNA and rRNA. Shades of blue and green are used for Sro9 and Slf1, respectively with darker shades for H2O2 treated. (C) Overlap between target mRNAs identified in PAR-CLIP studies, segment numbers >5 are indicated. (D) PAR-CLIP enrichment of Sro9 targets. Enrichment of PAR-CLIP rpkm/RNA-Seq rpkm for each mRNA in a group, comparing all Sro9 targets and the subset also bound by Slf1. Boxes extend from 25–75% of the data range with notches around median. The notches are ±1.58 × interquartile range(IQR)/sqrt(n) and represent the 95% confidence interval for each median. Whiskers extend to data points that are less than 1.5 x IQR away from 1st/3rd quartile. The number of mRNAs in each group is given below each plot (grey). P-values are Mann–Whitney test (*** left to right = 4.273e–15, < 2.2e–16). All Sro9 colouring as in panel B, Slf1 shared genes have lighter shaded boxes. (E) Functional categorization. Sro9 and Slf1 bound transcript Go-slim ‘Molecular Function’ over-enriched terms either in the absence (−) or presence (+) of H2O2. P-values are Fisher's Exact test corrected for false discovery rate. (F) Phenotypic serial dilution growth assay complementation of deletion strain phenotypes with single copy (sc) or high copy (hc) plasmids. ‘empty’ denotes controls plasmids without SLF1 or SRO9. Growth medium is synthetic complete (SCD) with or without 2 mM CuSO4 or 1.8 mM H2O2. Top: wild-type (WT), sro9Δ and its complementation with SLF1. Bottom: WT, slf1Δ and its complementation with SRO9.
Figure 2.
Figure 2.
Sro9 and Slf1 binding increases along ORFs. (A) Aggregate ‘metaplot’ of mRNA binding site distribution from PAR-CLIP relative to start codons (left), stop codon (right) measured in nucleotides (nt) and across the ORF (middle) where each ORF is compressed into 100 centiles for Sro9 and Slf1 from H2O2 treated or untreated (UT) yeast coloured as in Figure 1B. (B and C) PAR-CLIP coverage on example mRNAs: (B) GRX2 and (C) RPP2A. RNA-seq coverage in grey, PAR-CLIP coloured as in Figure 1B. Black arrows indicate the extent of each coding region.
Figure 3.
Figure 3.
No reduction in eIF4E-mRNA interactions in slf1Δ. (A) Western blots showing eIF4F factor association with eIF4E-TAP in the presence or absence of Slf1. (B) qRT-PCR of mRNAs associated with eIF4E-TAP ± Slf1 ± H2O2. ACT1 is in ‘Costello group I’, all other targets are in IIIA. Non-targets: group IVA (COX17, MRP2) or IVC (PRO1) (n = 3). Samples coloured as indicated in boxed key (magenta for WT and cyan for slf1Δ cells, with darker shades for ±H2O2). (C) Polysome profiles (A254 traces from 15–50% sucrose gradients) of extracts from wild-type (WT) and slf1Δ cells. Underlined areas marked monosome (M) and polysome (P) were pooled for mRNA-seq (n = 3). Right, Ratio of polysome:monosome association for indicated grouped mRNAs in wild-type (WT) and slf1Δ strains. Box plot parameters explained in legend to Figure 1, colours as panel B. P-values shown are *** < 2.2 × 10−16 and ** = 0.00350 (Mann–Whitney test).
Figure 4.
Figure 4.
mRNAs remain ribosome associated during stress in slf1Δ cells. (A) Polysome profiles from 15–50% sucrose gradient fractionated cell extracts with stripes indicating five pooled fractions collected for qRT-PCR: F = ribosome free, M = monosome 2–3/4–6/>6 = increasing polysome association. Traces coloured as per key in panel B. (B) Proportion (%) of individual mRNAs found in each polysome fraction by qRT-PCR in WT (magenta) or slf1Δ (cyan) in optimal growth conditions or following 15 min H2O2 treatment (darker shades). The shaded uncertainty envelope around each line represents the s.e.m. (n = 3). A two-way ANOVA with a Tukey post hoc test was used to assess the effect of the strain and the stress and to test the interaction of these two factors for each gradient fraction. Symbols (defined in the inset key) indicate significant results. Table shows which RNAs are PAR-CLIP targets in each dataset (✓).
Figure 5.
Figure 5.
LARP binding sites align with ribosome footprints. (A) The most enriched motif identified within PAR-CLIP mRNA binding sites in each condition, using DREME, aligned around the common GSU triplet. (Motif E-values (top to bottom): 1.1 × 10−98, 6.0 × 10−153,1.2 × 10−30, 4.5 × 10−16). (B) Reading frame distribution of GSU framing within PAR-CLIP binding sites and within ORFome, colouring as figure 1B. Inset shows the 0, + 1 and + 2 framing with respect to YGSU. (C) Ribosome read density around PAR-CLIP binding site mode locations (Supplementary Table S3) (-100 upstream to + 100 nt downstream). Plots show normalised sequence read coverage (enriched red) from either UT (top) or stressed (+ H2O2, bottom) conditions. Aligned PAR-CLIP reads for Sro9 (left) and Slf1 (right) cluster around 0. 80S monosome ribosome reads from a recent published study (4) mapping within each 200 nt binding site window are shown below each plot for standard ribosome footprints (28–29 nts) or small rotated ribosome footprints (21–22 nts) representing rotated ribosomes with free A-sites and both of these sets combined (All). Cartoons below each plot indicate relative positions of each LARP and the apparent preferred ribosome positions.
Figure 6.
Figure 6.
LARPs are enriched on disomes. (A) Distribution of Sro9 and Slf1 targets among Hel2 quintiles grouped according to Hel2-CRAC read counts (1, the lowest; 5, highest Hel2 binding), as described (61). (B) LARP target mRNAs are enriched in disomes. More disomes are found on Slf1 and Sro9 targets than NT mRNAs. All P-values (***) < 2.2 × 10−16 (Mann–Whitney test). Box plot details as shown in Figure 1D. (C) Meta plot of disomes isolated from untreated cells (40) mapped to ± 100 nt of PAR-CLIP site mode locations. Cartooned enriched disome ribosome and Larp positions shown below (see also Supplementary figure S9). (D) Slf1 is enriched on disomes and trisomes. Labelled example sucrose density gradient trace of ribosomes from cell extract not cycloheximide treated (top). Western blots (middle) of collected mono-, di- and trisome fractions, and quantification (n = 3). Quantification assumes a single Slf1-binding site per disome/trisome, while two or three Rps3 subunits, respectively are counted. P-values two-tailed t-test, paired samples ** M:D 0.0015, *M:T 0.017. (E) RNase-treated sucrose grandient traces ±15 min peroxide stress, aligned and stacked. Above, quantification of the disome: monosome ratios for 3 biological replicates. Statistics are two-way ANOVA with Tukey post hoc multiple comparison test adjusted P values. All pairs indicated **** are < 0.0001, except hel2Δ versus WT where P= 0.0004. (F) DLR assays using programmed + 1 and –1 ribosome frameshifting reporter sequences normalised to frame 0 control values. Cells grown to mid-log ± 2 hour oxidative stress treatment (n = 3). Statistics are two-way ANOVA with Tukey multiple comparison correction among strains; –1 frameshift: *** = 0.0001, +1 frameshift: *** = 0.0004, * = 0.0153.

Similar articles

Cited by

References

    1. Shenton D., Smirnova J.B., Selley J.N., Carroll K., Hubbard S.J., Pavitt G.D., Ashe M.P., Grant C.M.. Global translational responses to oxidative stress impact upon multiple levels of protein synthesis. J. Biol. Chem. 2006; 281:29011–29021. - PubMed
    1. Morano K.A., Grant C.M., Moye-Rowley W.S.. The response to heat shock and oxidative stress in saccharomyces cerevisiae. Genetics. 2011; 190:1157–1195. - PMC - PubMed
    1. Gasch A.P., Spellman P.T., Kao C.M., Carmel-Harel O., Eisen M.B., Storz G., Botstein D., Brown P.O.. Genomic expression programs in the response of yeast cells to environmental changes. Mol. Biol. Cell. 2000; 11:4241–4257. - PMC - PubMed
    1. Wu C.C., Zinshteyn B., Wehner K.A., Green R.. High-resolution ribosome profiling defines discrete ribosome elongation states and translational regulation during cellular stress. Mol. Cell. 2019; 73:959–970. - PMC - PubMed
    1. Dougherty S.E., Maduka A.O., Inada T., Silva G.M.. Expanding role of ubiquitin in translational control. Int. J. Mol. Sci. 2020; 21:1151. - PMC - PubMed

Publication types

MeSH terms