

Kinetic models for estimating occupancy from single-scan PET displacement studies
- PMID: 37070382
- PMCID: PMC10414003
- DOI: 10.1177/0271678X231168591
Kinetic models for estimating occupancy from single-scan PET displacement studies
Abstract
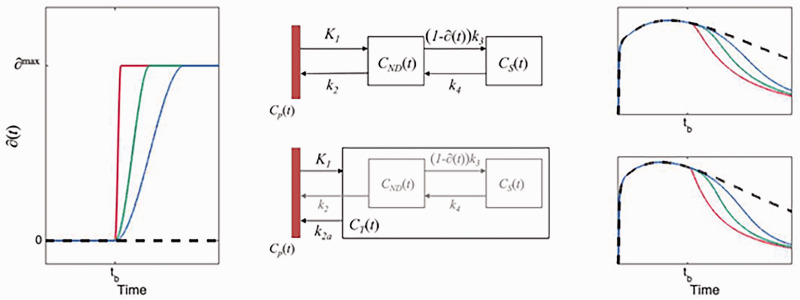
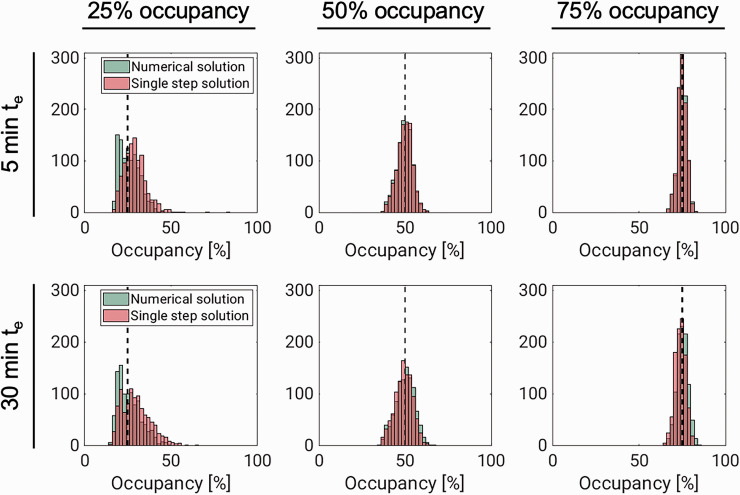
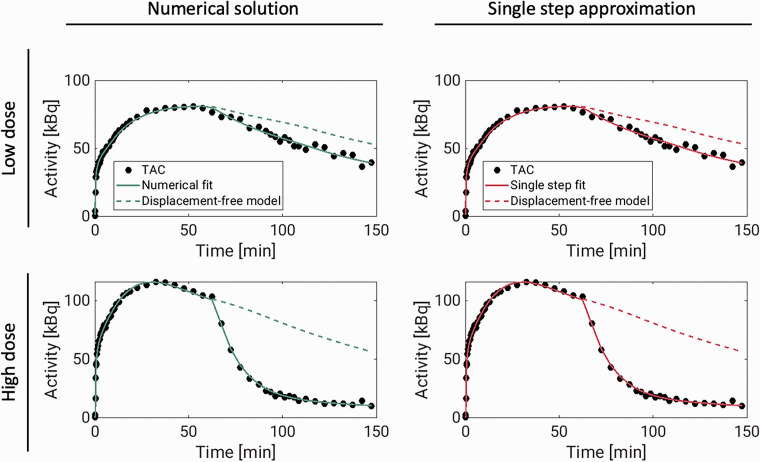
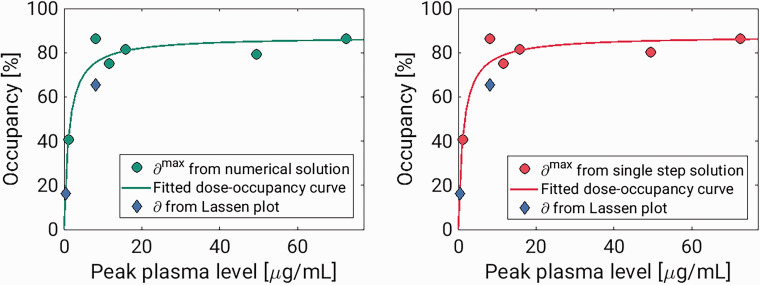
The traditional design of PET target engagement studies is based on a baseline scan and one or more scans after drug administration. We here evaluate an alternative design in which the drug is administered during an on-going scan (i.e., a displacement study). This approach results both in lower radiation exposure and lower costs. Existing kinetic models assume steady state. This condition is not present during a drug displacement and consequently, our aim here was to develop kinetic models for analysing PET displacement data. We modified existing compartment models to accommodate a time-variant increase in occupancy following the pharmacological in-scan intervention. Since this implies the use of differential equations that cannot be solved analytically, we developed instead one approximate and one numerical solution. Through simulations, we show that if the occupancy is relatively high, it can be estimated without bias and with good accuracy. The models were applied to PET data from six pigs where [11C]UCB-J was displaced by intravenous brivaracetam. The dose-occupancy relationship estimated from these scans showed good agreement with occupancies calculated with Lassen plot applied to baseline-block scans of two pigs. In summary, the proposed models provide a framework to determine target occupancy from a single displacement scan.
Keywords: Displacement; PET; drug occupancy; kinetic modelling; synaptic density.
Conflict of interest statement
The author(s) declared the following potential conflicts of interest with respect to the research, authorship, and/or publication of this article: GMK has received honoraria as a speaker for Sage Biogen and H. Lundbeck, and as a consultant for Sanos. MS has received compensation from Roche as a key opinion leader, and is an employee and owns stock options in Antaros Medical AB.
Figures
Similar articles
-
Assessment of cerebral drug occupancy in humans using a single PET-scan: A [11C]UCB-J PET study.Eur J Nucl Med Mol Imaging. 2024 Sep;51(11):3292-3304. doi: 10.1007/s00259-024-06759-x. Epub 2024 May 17. Eur J Nucl Med Mol Imaging. 2024. PMID: 38758370 Free PMC article.
-
Drug characteristics derived from kinetic modeling: combined 11C-UCB-J human PET imaging with levetiracetam and brivaracetam occupancy of SV2A.EJNMMI Res. 2022 Nov 8;12(1):71. doi: 10.1186/s13550-022-00944-5. EJNMMI Res. 2022. PMID: 36346513 Free PMC article.
-
18F-JNJ-64413739, a Novel PET Ligand for the P2X7 Ion Channel: Radiation Dosimetry, Kinetic Modeling, Test-Retest Variability, and Occupancy of the P2X7 Antagonist JNJ-54175446.J Nucl Med. 2019 May;60(5):683-690. doi: 10.2967/jnumed.118.216747. Epub 2018 Sep 27. J Nucl Med. 2019. PMID: 30262518
-
Quantifying SV2A density and drug occupancy in the human brain using [11C]UCB-J PET imaging and subcortical white matter as reference tissue.Eur J Nucl Med Mol Imaging. 2019 Feb;46(2):396-406. doi: 10.1007/s00259-018-4119-8. Epub 2018 Aug 18. Eur J Nucl Med Mol Imaging. 2019. PMID: 30121895
-
Evaluation of [11C]UCB-A positron emission tomography in human brains.EJNMMI Res. 2024 Jun 17;14(1):56. doi: 10.1186/s13550-024-01117-2. EJNMMI Res. 2024. PMID: 38884834 Free PMC article.
Cited by
-
[11C]PS13 Demonstrates Pharmacologically Selective and Substantial Binding to Cyclooxygenase-1 in the Human Brain.J Nucl Med. 2025 Jan 3;66(1):117-122. doi: 10.2967/jnumed.124.267928. J Nucl Med. 2025. PMID: 39542698 Free PMC article.
-
Assessment of cerebral drug occupancy in humans using a single PET-scan: A [11C]UCB-J PET study.Eur J Nucl Med Mol Imaging. 2024 Sep;51(11):3292-3304. doi: 10.1007/s00259-024-06759-x. Epub 2024 May 17. Eur J Nucl Med Mol Imaging. 2024. PMID: 38758370 Free PMC article.
-
A novel approach for modeling in vivo enzyme turnover in the presence of a suicide inhibitor drug: A proof-of-concept brain PET study on MAG lipase.J Cereb Blood Flow Metab. 2025 May 15:271678X251329254. doi: 10.1177/0271678X251329254. Online ahead of print. J Cereb Blood Flow Metab. 2025. PMID: 40370302 Free PMC article.
References
-
- Gunn RN, Rabiner EA. Imaging in central nervous system drug discovery. Semin Nucl Med 2017; 47: 89–98. - PubMed
-
- Innis RB, Cunningham VJ, Delforge J, et al.. Consensus nomenclature for in vivo imaging of reversibly binding radioligands. J Cereb Blood Flow Metab 2007; 27: 1533–1539. - PubMed
-
- Slifstein M, Laruelle M. Models and methods for derivation of in vivo neuroreceptor parameters with PET and SPECT reversible radiotracers. Nucl Med Biol 2001; 28: 595–608. - PubMed
Publication types
MeSH terms
LinkOut - more resources
Full Text Sources
