

Optimal combination of immune checkpoint and senescence molecule predicts adverse outcomes in patients with acute myeloid leukemia
- PMID: 37070487
- PMCID: PMC10120552
- DOI: 10.1080/07853890.2023.2201507
Optimal combination of immune checkpoint and senescence molecule predicts adverse outcomes in patients with acute myeloid leukemia
Abstract
Background: High expression of immune checkpoints (ICs) and senescence molecules (SMs) contributes to T cell dysfunction, tumor escape, and progression, but systematic evaluation of them in co-expression patterns and prognosis in acute myeloid leukemia (AML) was lacking.
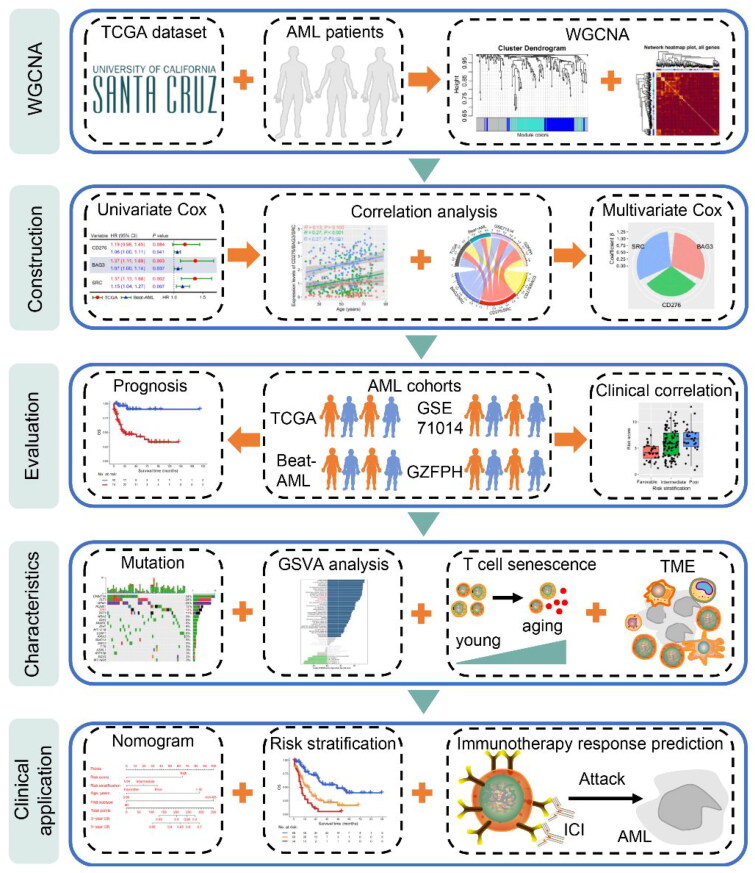
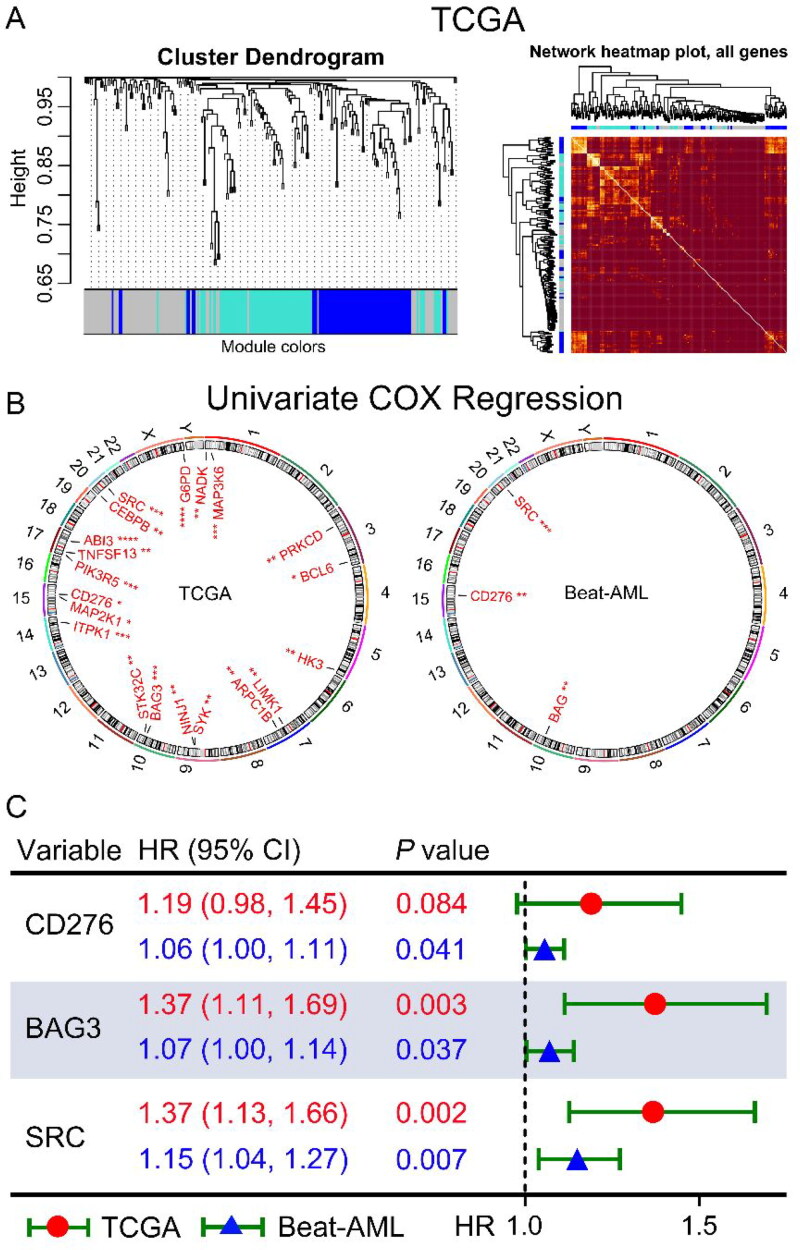
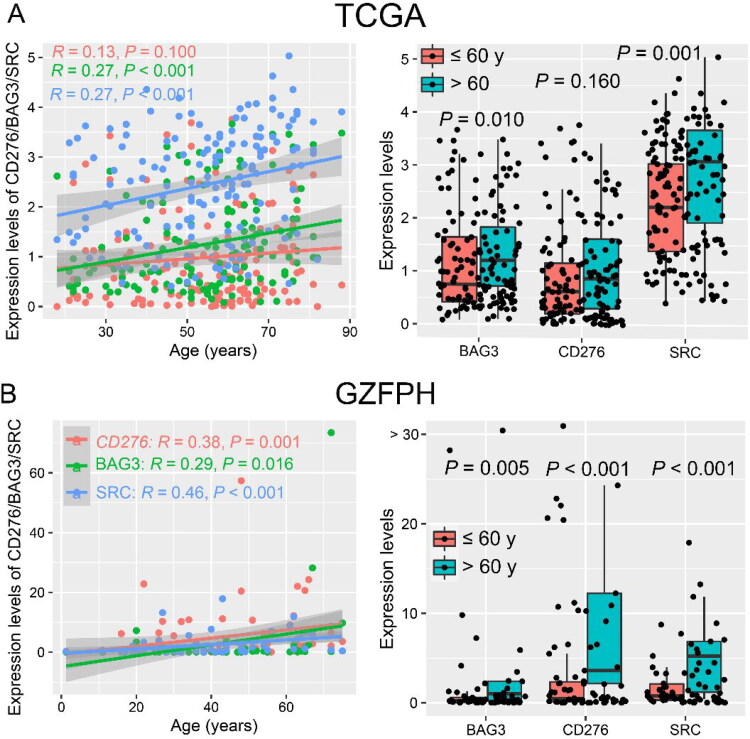
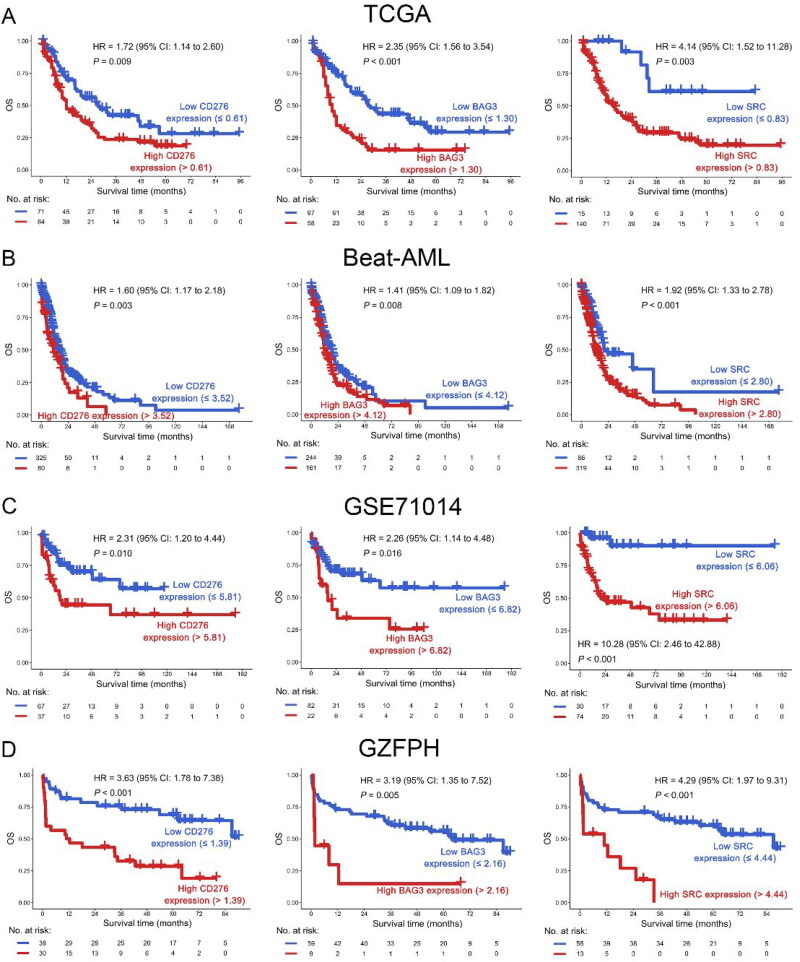
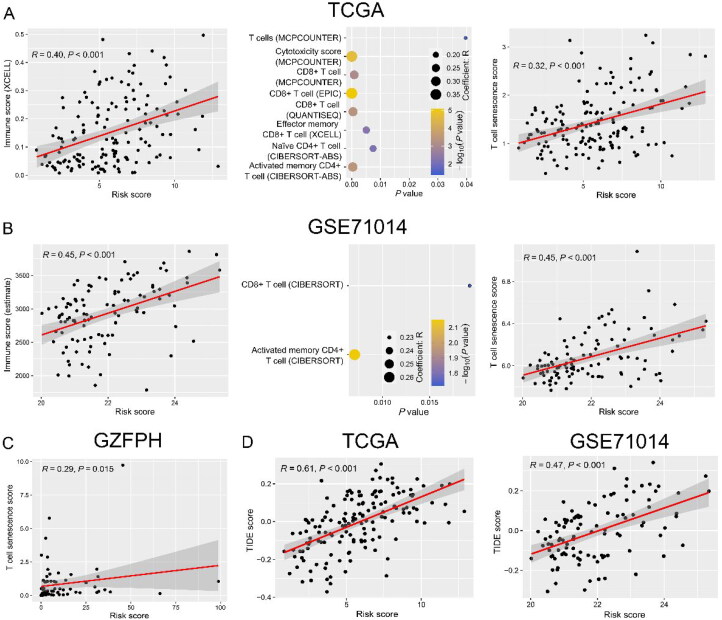
Methods: Three publicly available datasets (TCGA, Beat-AML, and GSE71014) were first used to explore the effect of IC and SM combinations on prognosis and the immune microenvironment in AML, and bone marrow samples from 68 AML patients from our clinical center (GZFPH) was further used to validate the findings.
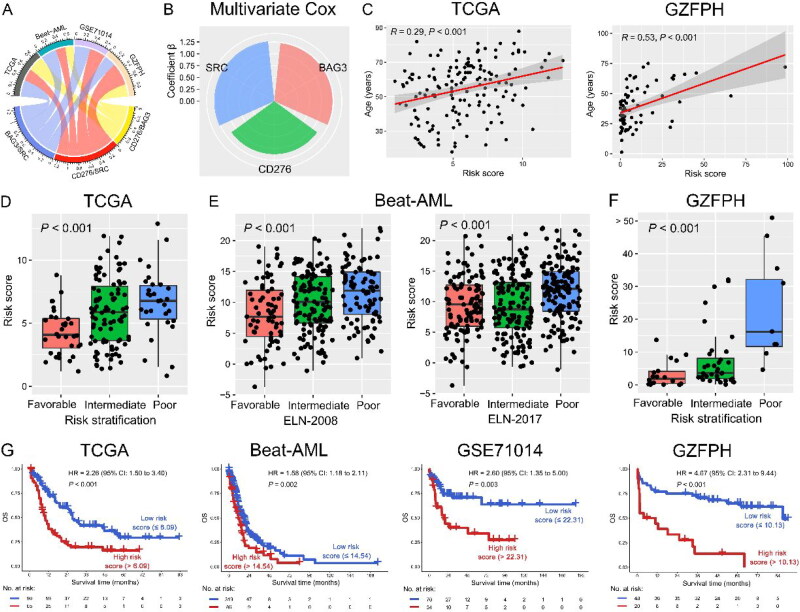
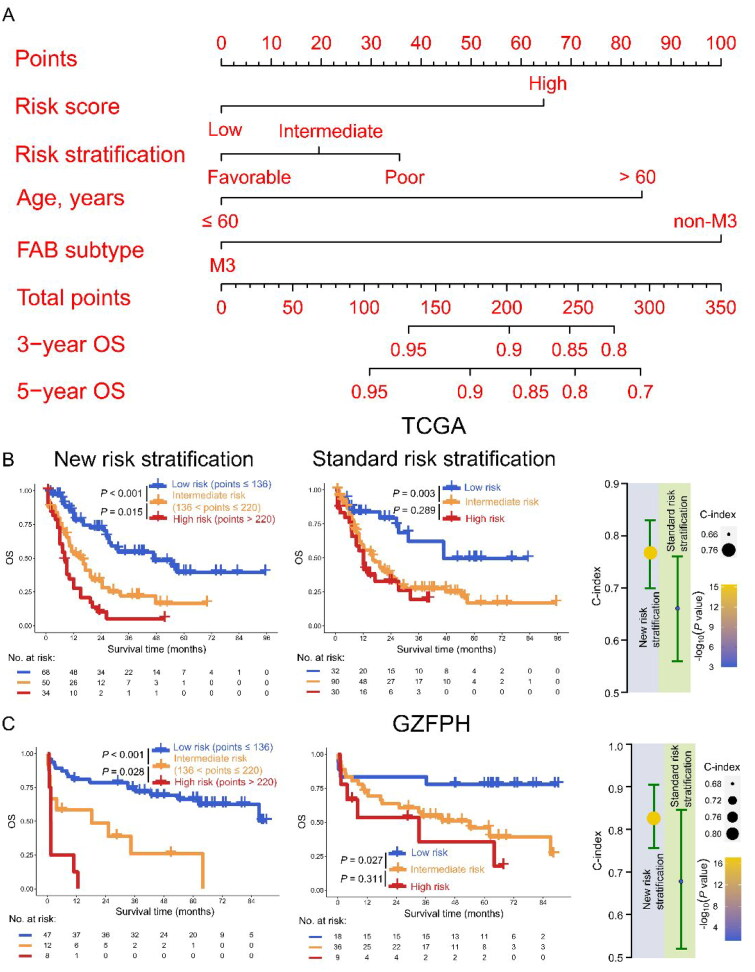
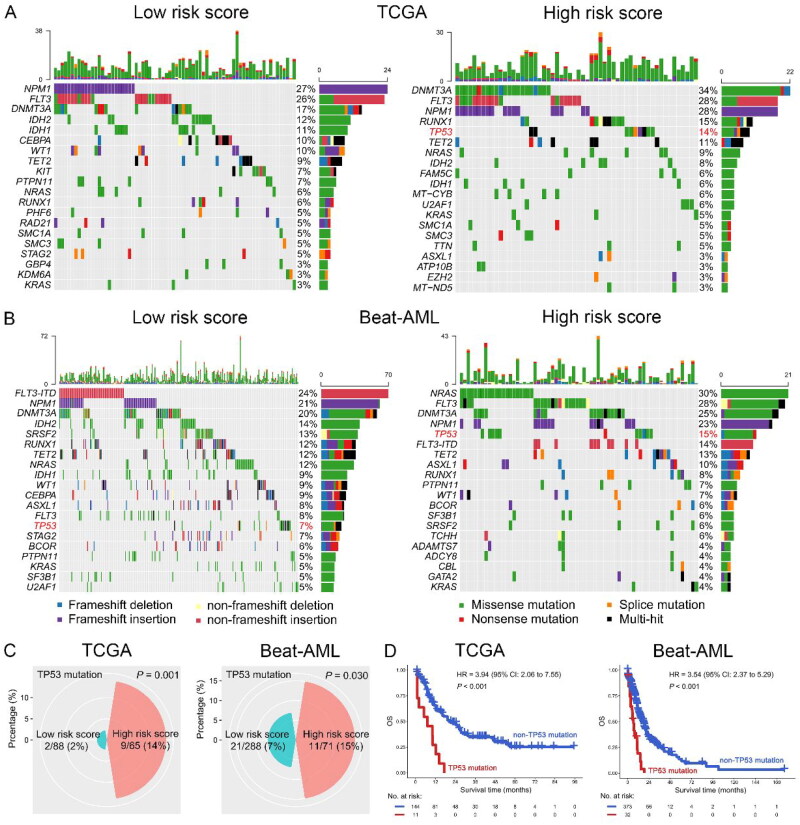
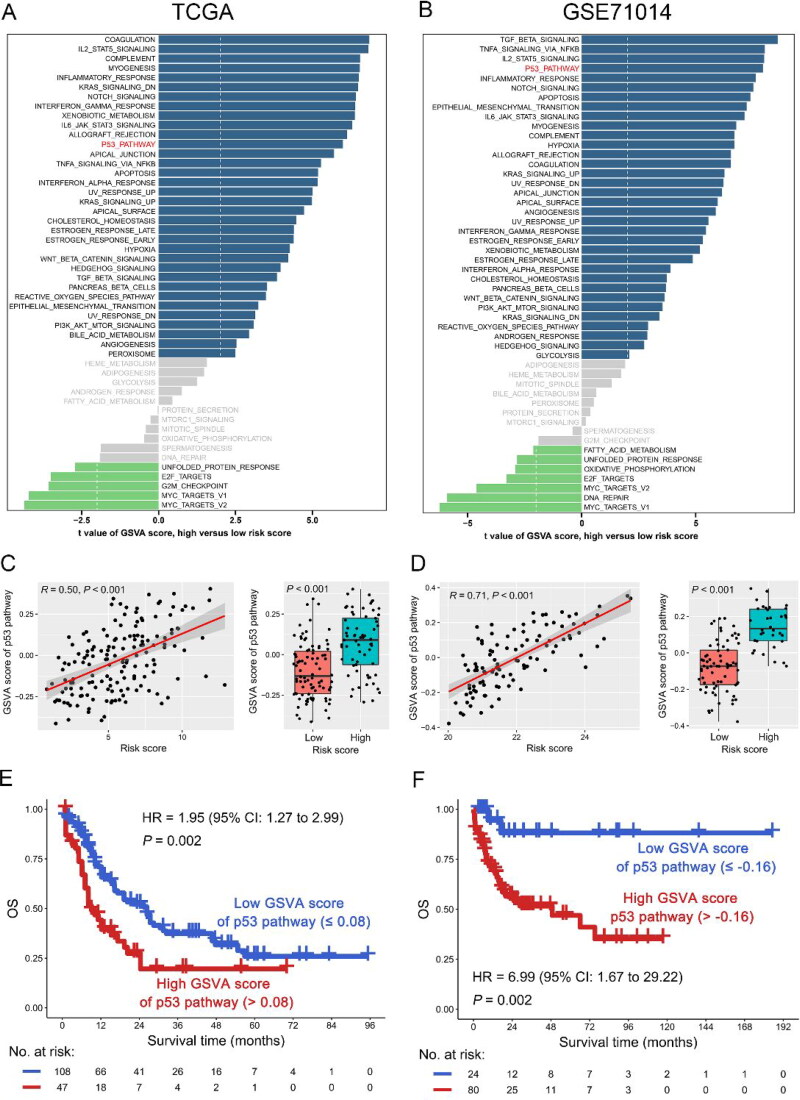
Results: High expression of CD276, Bcl2-associated athanogene 3 (BAG3), and SRC was associated with poor overall survival (OS) of AML patients. CD276/BAG3/SRC combination, standard European Leukemia Net (ELN) risk stratification, age, and French-American-British (FAB) subtype were used to construct a nomogram model. Interestingly, the new risk stratification derived from the nomogram was better than the standard ELN risk stratification in predicting the prognosis for AML. A weighted combination of CD276 and BAG3/SRC positively corrected with TP53 mutation, p53 pathway, CD8+ T cells, activated memory CD4+ T cells, T-cell senescence score, and Tumor Immune Dysfunction and Exclusion (TIDE) score estimated by T-cell dysfunction.
Conclusion: High expression of ICs and SMs was associated with poor OS of AML patients. The co-expression patterns of CD276 and BAG3/SRC might be potential biomarkers for risk stratification and designing combinational immuno-targeted therapy in AML.Key MessagesHigh expression of CD276, BAG3, and SRC was associated with poor overall survival of AML patients.The co-expression patterns of CD276 and BAG3/SRC might be potential biomarkers for risk stratification and designing combinational immuno-targeted therapy in AML.
Keywords: Prognosis; acute myeloid leukemia; immune checkpoint; risk stratification; senescence.
Conflict of interest statement
The authors declare that they have no competing interests.
Figures
Similar articles
-
Increased co-expression of ICOS and PD-1 predicts poor overall survival in patients with acute myeloid leukemia.Immunobiology. 2024 May;229(3):152804. doi: 10.1016/j.imbio.2024.152804. Epub 2024 Apr 11. Immunobiology. 2024. PMID: 38615511
-
High expression of LOC541471, GDAP1, SOD1, and STK25 is associated with poor overall survival of patients with acute myeloid leukemia.Cancer Med. 2023 Apr;12(7):9055-9067. doi: 10.1002/cam4.5644. Epub 2023 Jan 27. Cancer Med. 2023. PMID: 36708053 Free PMC article.
-
GPX1-associated prognostic signature predicts poor survival in patients with acute myeloid leukemia and involves in immunosuppression.Biochim Biophys Acta Mol Basis Dis. 2022 Jan 1;1868(1):166268. doi: 10.1016/j.bbadis.2021.166268. Epub 2021 Sep 16. Biochim Biophys Acta Mol Basis Dis. 2022. PMID: 34536536
-
The role of bone marrow microenvironment (BMM) cells in acute myeloid leukemia (AML) progression: immune checkpoints, metabolic checkpoints, and signaling pathways.Cell Commun Signal. 2023 Sep 21;21(1):252. doi: 10.1186/s12964-023-01282-2. Cell Commun Signal. 2023. PMID: 37735675 Free PMC article. Review.
-
B7-H3 in acute myeloid leukemia: From prognostic biomarker to immunotherapeutic target.Chin Med J (Engl). 2024 Nov 5;137(21):2540-2551. doi: 10.1097/CM9.0000000000003099. Epub 2024 Apr 9. Chin Med J (Engl). 2024. PMID: 38595093 Free PMC article. Review.
Cited by
-
NAP1L5 in acute myeloid leukemia: a prognostic biomarker and potential therapeutic target.Front Oncol. 2025 Jul 25;15:1617564. doi: 10.3389/fonc.2025.1617564. eCollection 2025. Front Oncol. 2025. PMID: 40786510 Free PMC article.
-
Increased Co-Expression of PD-L1 and CTLA-4 Predicts Poor Overall Survival in Patients with Acute Myeloid Leukemia Following Allogeneic Hematopoietic Stem Cell Transplantation.Immunotargets Ther. 2025 Jan 20;14:25-33. doi: 10.2147/ITT.S500723. eCollection 2025. Immunotargets Ther. 2025. PMID: 39866547 Free PMC article.
-
High percentage of bone marrow CD8+ tissue-resident-like memory T cells predicts inferior survival in patients with acute myeloid leukemia.Blood Sci. 2024 Jun 7;6(3):e00194. doi: 10.1097/BS9.0000000000000194. eCollection 2024 Jul. Blood Sci. 2024. PMID: 38854481 Free PMC article.
-
The Association between Immune Checkpoint Proteins and Therapy Outcomes in Acute Myeloid Leukaemia Patients.Cancers (Basel). 2023 Sep 9;15(18):4487. doi: 10.3390/cancers15184487. Cancers (Basel). 2023. PMID: 37760457 Free PMC article.
-
Identification and validation of a prognostic risk-scoring model based on the level of TIM-3 expression in acute myeloid leukemia.Sci Rep. 2023 Sep 20;13(1):15658. doi: 10.1038/s41598-023-42700-2. Sci Rep. 2023. PMID: 37730831 Free PMC article.
References
-
- Deschler B, Lübbert M.. Acute myeloid leukemia: epidemiology and etiology. Cancer. 2006;107(9):1–15. - PubMed
-
- Shimony S, Stahl M, Stone RM.. Acute myeloid leukemia: 2023 update on diagnosis, risk-stratification, and management. Am J Hematol. 2023;98(3):502–526. - PubMed
-
- Estey EH. Acute myeloid leukemia: 2019 update on risk-stratification and management. Am J Hematol. 2018;93(10):1267–1291. - PubMed
Publication types
MeSH terms
Substances
LinkOut - more resources
Full Text Sources
Other Literature Sources
Medical
Research Materials
Miscellaneous