

Ultra-processed food consumption and BMI-Z among children at risk for obesity from low-income households
- PMID: 37070567
- PMCID: PMC10434975
- DOI: 10.1111/ijpo.13037
Ultra-processed food consumption and BMI-Z among children at risk for obesity from low-income households
Abstract
Objective: To evaluate the association between baseline ultra-processed food consumption in early childhood and child BMI Z-score over 36 months.
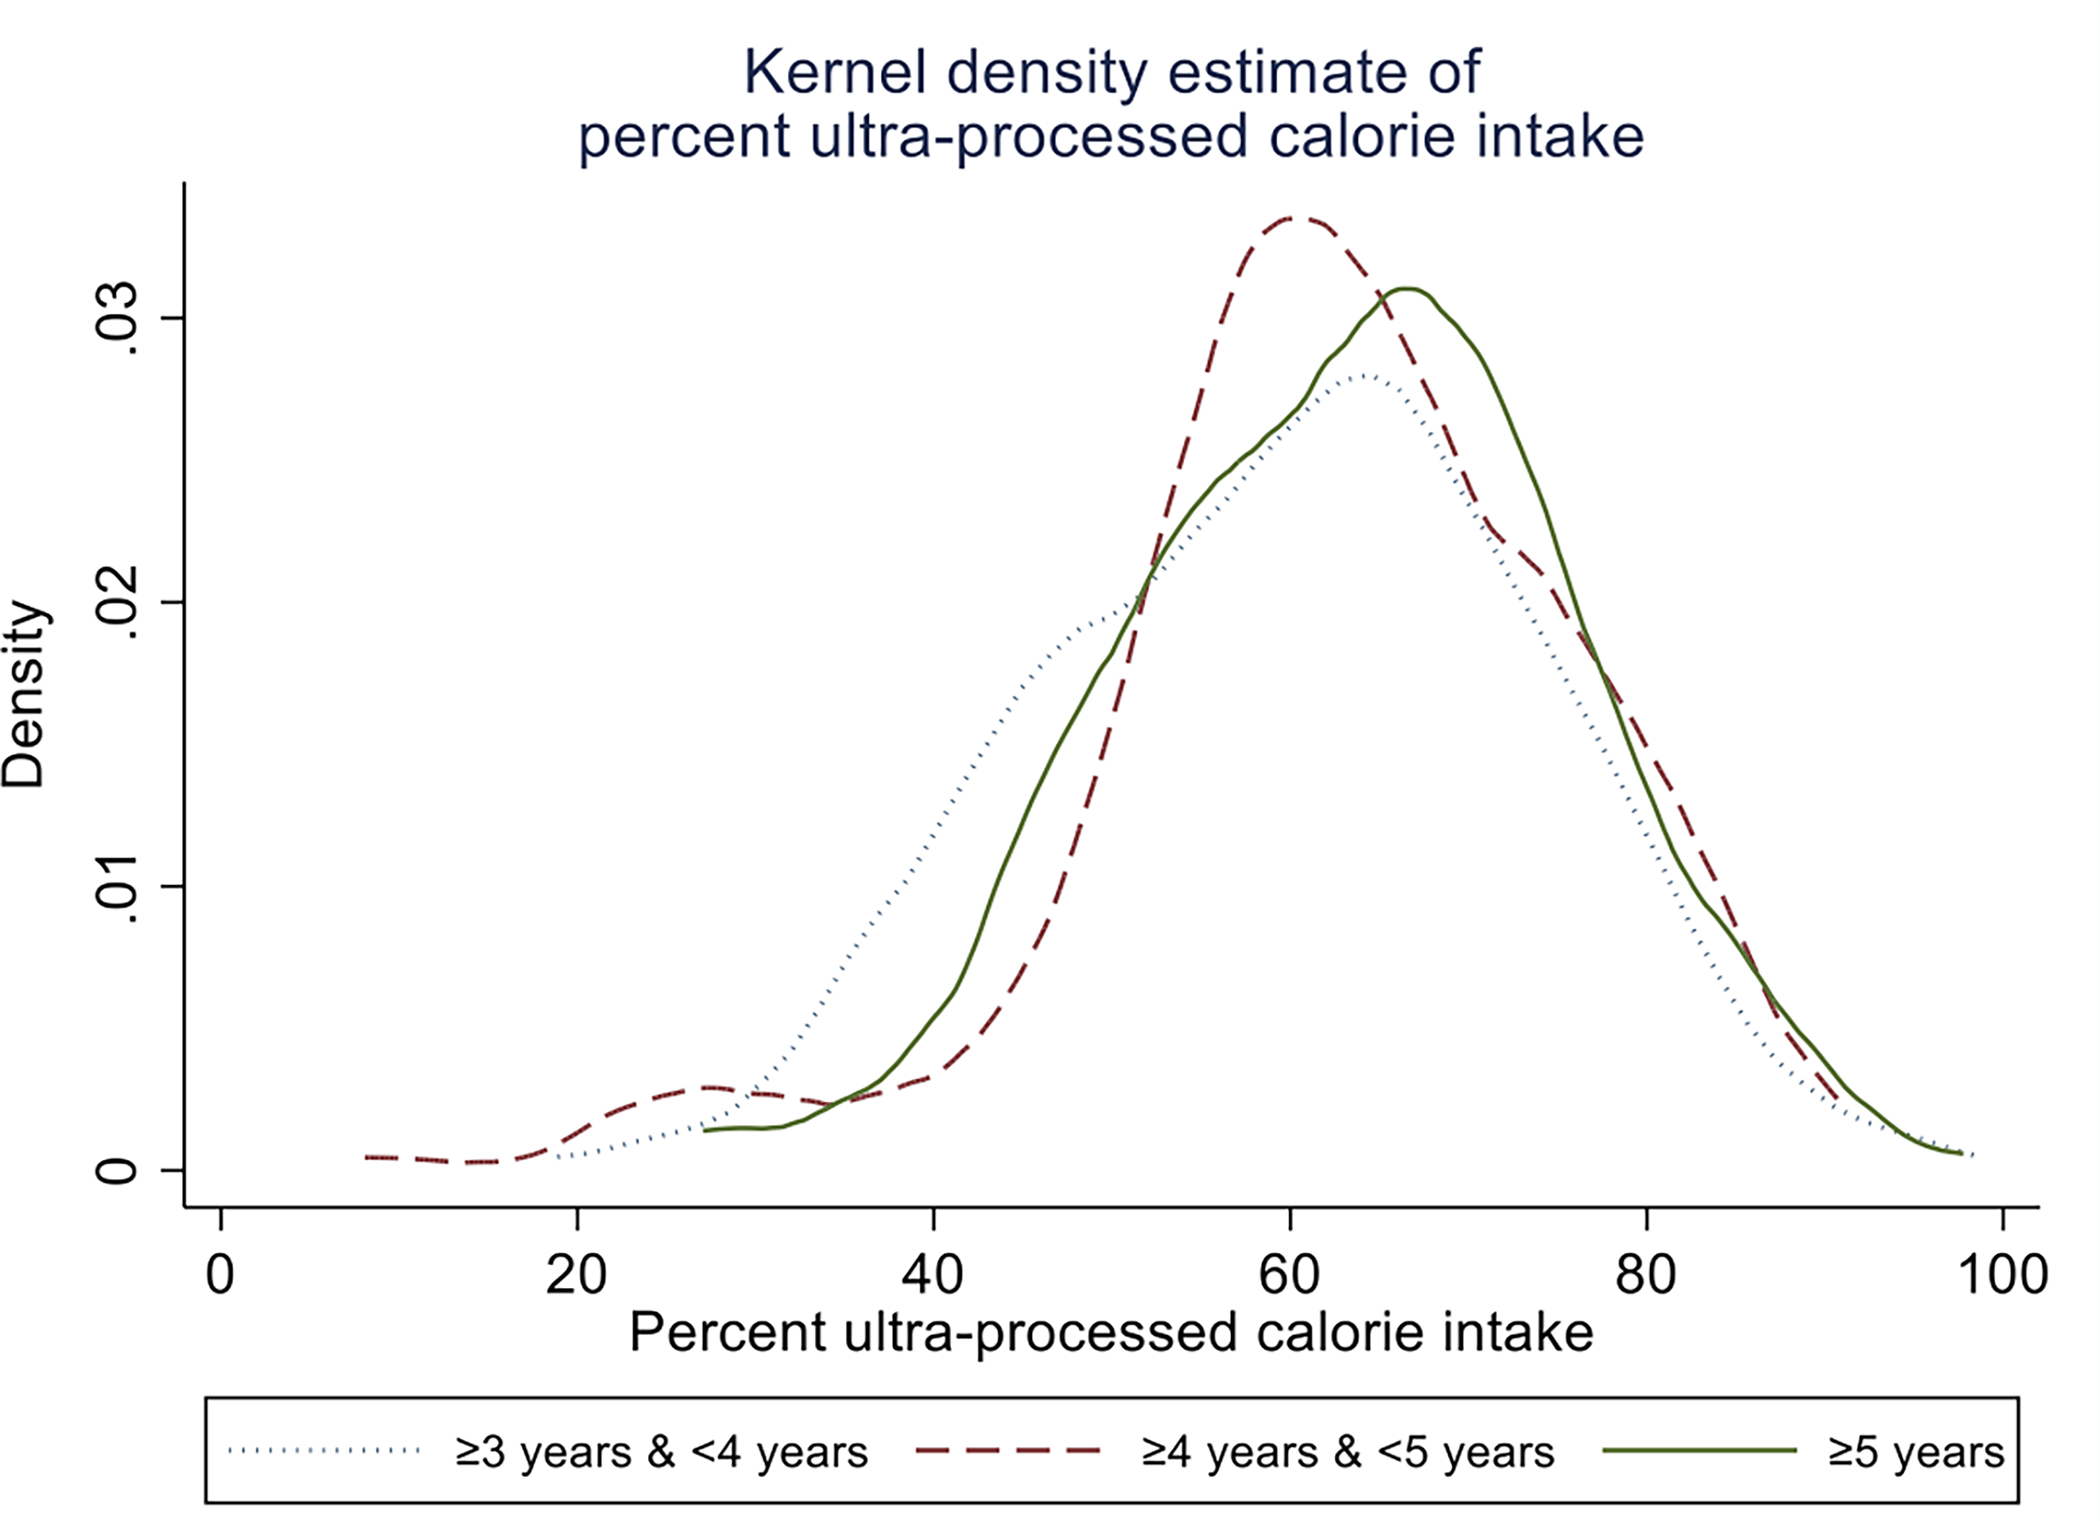
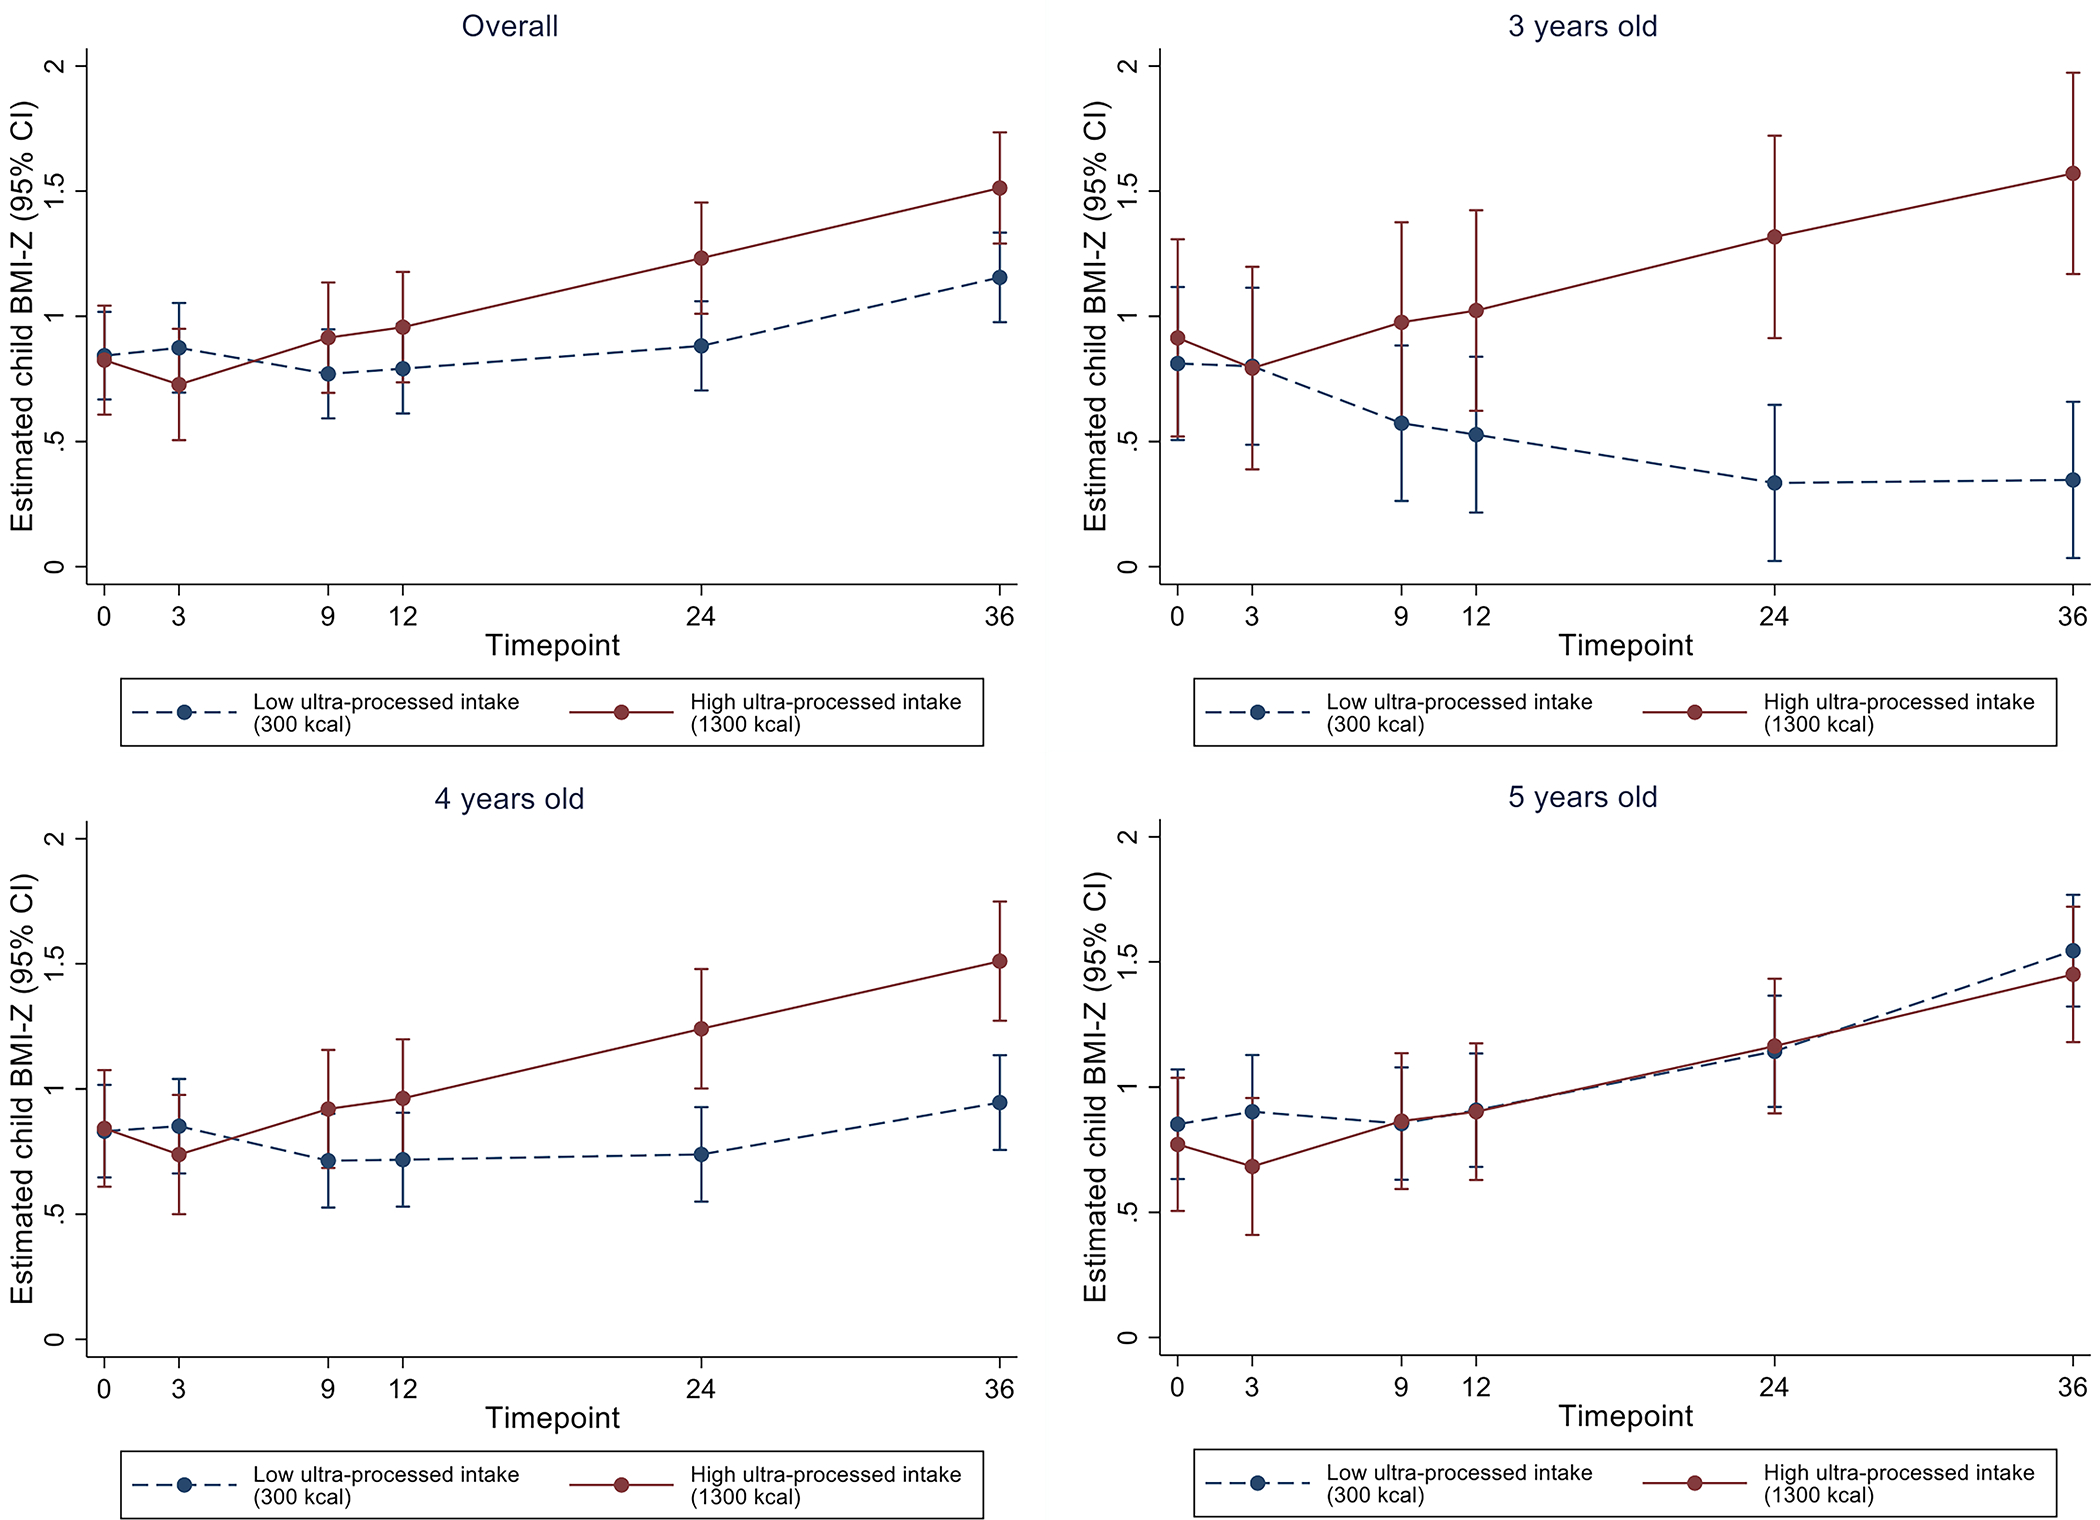
Methods: We conducted a prospective cohort analysis as a secondary data analysis of the Growing Right Onto Wellness randomised trial. Dietary intake was measured via 24-h diet recalls. The primary outcome was child BMI-Z, measured at baseline and at 3-, 9-, 12-, 24- and 36-month timepoints. Child BMI-Z was modelled using a longitudinal mixed-effects model, adjusting for covariates and stratifying by age.
Results: Among 595 children, median (Q1-Q3) baseline age was 4.3 (3.6-5.0) years, 52.3% of the children were female, 65.4% had normal weight, 33.8% were overweight, 0.8% were obese and 91.3% of parents identified as Hispanic. Model-based estimates suggest that, compared with low ultra-processed consumption (300 kcals/day), high ultra-processed intake (1300 kcals/day) was associated with a 1.2 higher BMI-Z at 36 months for 3-year-olds (95% CI = 0.5, 1.9; p < 0.001) and a 0.6 higher BMI-Z for 4-year-olds (95% CI = 0.2, 1.0; p = 0.007). The difference was not statistically significant for 5-year-olds or overall.
Conclusions: In 3- and 4-year-old children, but not in 5-year-old children, high ultra-processed food intake at baseline was significantly associated with higher BMI-Z at 36-month follow-up, adjusting for total daily kcals. This suggests that it might not be only the total number of calories in a child's daily intake that influences child weight status, but also the number of calories from ultra-processed foods.
Keywords: childhood obesity; cohort study; nutrition; racial and ethnic minority groups; ultra-processed foods.
© 2023 World Obesity Federation.
Conflict of interest statement
Figures
References
-
- Min J, Wen X, Xue H, Wang Y. Ethnic disparities in childhood BMI trajectories and obesity and potential causes among 29,250 US children: Findings from the Early Childhood Longitudinal Study-Birth and Kindergarten Cohorts. International journal of obesity (2005). Sep 2018;42(9):1661–1670. doi: 10.1038/s41366-018-0091-4 - DOI - PubMed
Publication types
MeSH terms
Grants and funding
LinkOut - more resources
Full Text Sources
Medical
