. 2023 May 22;51(9):4178-4190.
doi: 10.1093/nar/gkad249.

Reconstructing the landscape of gut microbial species across 29,000 diverse individuals

Affiliations

Reconstructing the landscape of gut microbial species across 29,000 diverse individuals

Igor Segota et al. Nucleic Acids Res. .

Abstract

The human gut microbiome has been linked to health and disease. Investigation of the human microbiome has largely employed 16S amplicon sequencing, with limited ability to distinguish microbes at the species level. Herein, we describe the development of Reference-based Exact Mapping (RExMap) of microbial amplicon variants that enables mapping of microbial species from standard 16S sequencing data. RExMap analysis of 16S data captures ∼75% of microbial species identified by whole-genome shotgun sequencing, despite hundreds-fold less sequencing depth. RExMap re-analysis of existing 16S data from 29,349 individuals across 16 regions from around the world reveals a detailed landscape of gut microbial species across populations and geography. Moreover, RExMap identifies a core set of fifteen gut microbes shared by humans. Core microbes are established soon after birth and closely associate with BMI across multiple independent studies. RExMap and the human microbiome dataset are presented as resources with which to explore the role of the human microbiome.


Figures

Figure 1.
Figure 1.
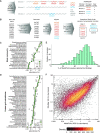
Schematics and benchmarking of RExMap. (A) RExMap reference database (RExMapDB) is a database of hyper-variable regions of 16S rRNA genes (shown in color) and their copy numbers, from microbial strain isolates in the NCBI Genome and RefSeq databases. DNA sequences listed here are not real 16S sequences and only serve the purpose to demonstrate the approaches used in pipeline. (B) RExMap maps exact denoised sequence variants from the sequencing data to the RExMapDB, and reports estimated abundance of the Operational Strain Units (OSUs), which contains one or multiple microbial strains that cannot be further distinguished with the sequenced hypervariable region. (C, D) Identification and abundance estimates of mock 20-microbe community and a human fecal sample with paired 16S sequencing of V3-V4 and WGS data. (E) Distribution of the fraction of MetaPhlAn2 species that are captured by RExMap. (F) Comparison of relative microbial abundances estimated by WGS MetaPhlAn2 and 16S RExMap for a 780-sample human gut microbiome dataset (DIABIMMUNE).
Figure 2.
Figure 2.
RExMap analysis of 29,349 human gut microbiomes. (A) Color map of the number of samples obtained from each region. List of regions with number of samples and reference studies. (B) Relation between regional mean abundance and regional prevalence of 17 786 OSUs. (C) Number of unique OSUs at a given regional prevalence. (D) Number of OSUs contributing to the compositional abundance of each individual. (E) Number of OSUs contributing to the compositional abundance of each region. The regional color legend (right) is used for (C) and (E).
Figure 3.
Figure 3.
Regional-specific gut microbes. (A) Principal Coordinate Analysis of all samples colored by region, showing all samples colored by region along the first two principal axes. (B) Top OSUs contributing to the first three principal coordinates. (C) Total abundance of two Prevotella copri OSUs versus all Bacteroides OSUs across all regions.
Figure 4.
Figure 4.
Core gut microbes across human populations. (A) Distribution of abundances for each of the core OSUs across all human samples. OSUs are colored by their family rank, with different shades distinguishing OSUs within the same family. (B) Prevalence of core OSUs in the Twins UK dataset based on Kraken2 WGS (black) and RExMap 16S (green) data. (C) Abundance distribution of core OSUs in the Twins UK dataset. (D) Distribution of the total number of core OSUs. (E) Distribution of the average total abundance of the core OSUs across each region. (F) Composition of the core OSUs across regions. (G) Colonization of core OSUs through early life. (H) Number of core OSUs present in 128 vertebrate host species, plotted on a phylogenetic tree, where the color of tree leaves (host species) indicates the number of core OSUs found and internal edge colors average number of core OSUs in each clade. Inset shows the core OSU presence in non-human primates.
Figure 5.
Figure 5.
Association between core OSUs and body mass index. Core OSUs were evaluated in three large adult populations with available BMI, age and gender phenotypes: American Gut Project (AGP, N = 9621), Guangdong Gut Microbiome Project (GGMP, N = 6748) and Twins UK (N = 1013). (A) Boxplot of total core OSU abundance in four standard BMI categories. Three asterisks indicate two-sided Wilcox rank-sum tests with P-values less than 0.001 between BMI categories that validate across all three datasets. (B) Effect size of individual core OSUs on BMI adjusted for age and gender. Lines indicate 95% confidence intervals. Meta-analysis (black lines) p-value is presented.

Similar articles

References

    1. Turnbaugh P.J., Hamady M., Yatsunenko T., Cantarel B.L., Duncan A., Ley R.E., Sogin M.L., Jones W.J., Roe B.A., Affourtit J.P.et al. .. A core gut microbiome in obese and lean twins. Nature. 2009; 457:480–484. - PMC - PubMed
    1. Matson V., Fessler J., Bao R., Chongsuwat T., Zha Y., Alegre M.-L., Luke J.J., Gajewski T.F.. The commensal microbiome is associated with anti–PD-1 efficacy in metastatic melanoma patients. Science. 2018; 359:104–108. - PMC - PubMed
    1. Vatanen T., Kostic A.D., d’Hennezel E., Siljander H., Franzosa E.A., Yassour M., Kolde R., Vlamakis H., Arthur T.D., Hämäläinen A.-M.et al. .. Variation in microbiome LPS immunogenicity contributes to autoimmunity in humans. Cell. 2016; 165:842–853. - PMC - PubMed
    1. Bolyen E., Rideout J.R., Dillon M.R., Bokulich N.A., Abnet C.C., Al-Ghalith G.A., Alexander H., Alm E.J., Arumugam M., Asnicar F.et al. .. Reproducible, interactive, scalable and extensible microbiome data science using QIIME 2. Nat. Biotechnol. 2019; 37:852–857. - PMC - PubMed
    1. Callahan B.J., McMurdie P.J., Rosen M.J., Han A.W., Johnson A.J.A., Holmes S.P.. DADA2: high-resolution sample inference from Illumina amplicon data. Nat. Methods. 2016; 13:581–583. - PMC - PubMed

Publication types

Substances