. 2023 Apr 18:12:e86030.
doi: 10.7554/eLife.86030.

The autophagy receptor NBR1 directs the clearance of photodamaged chloroplasts

Affiliations

The autophagy receptor NBR1 directs the clearance of photodamaged chloroplasts

Han Nim Lee et al. Elife. .

Abstract

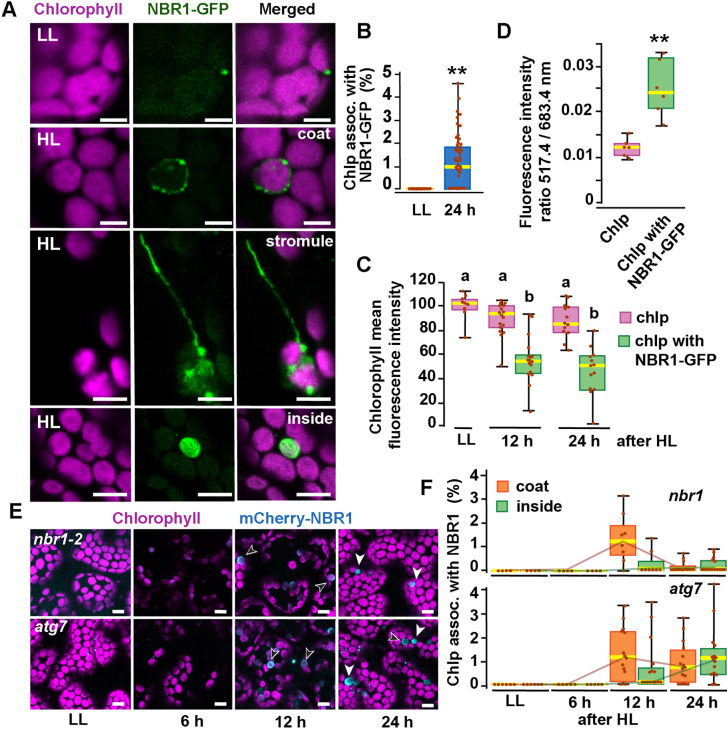
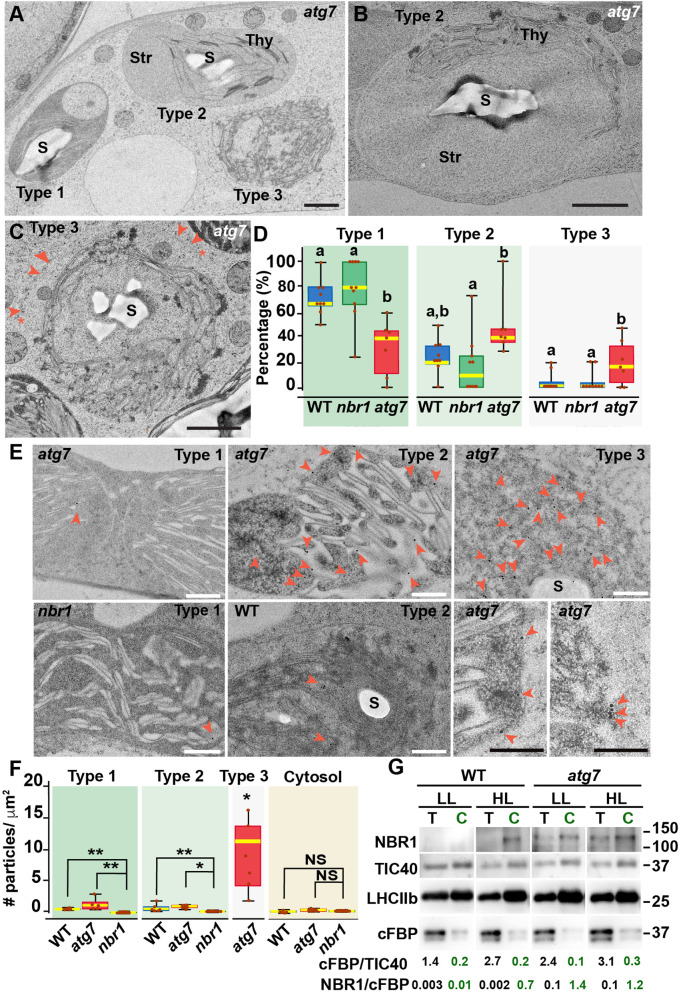
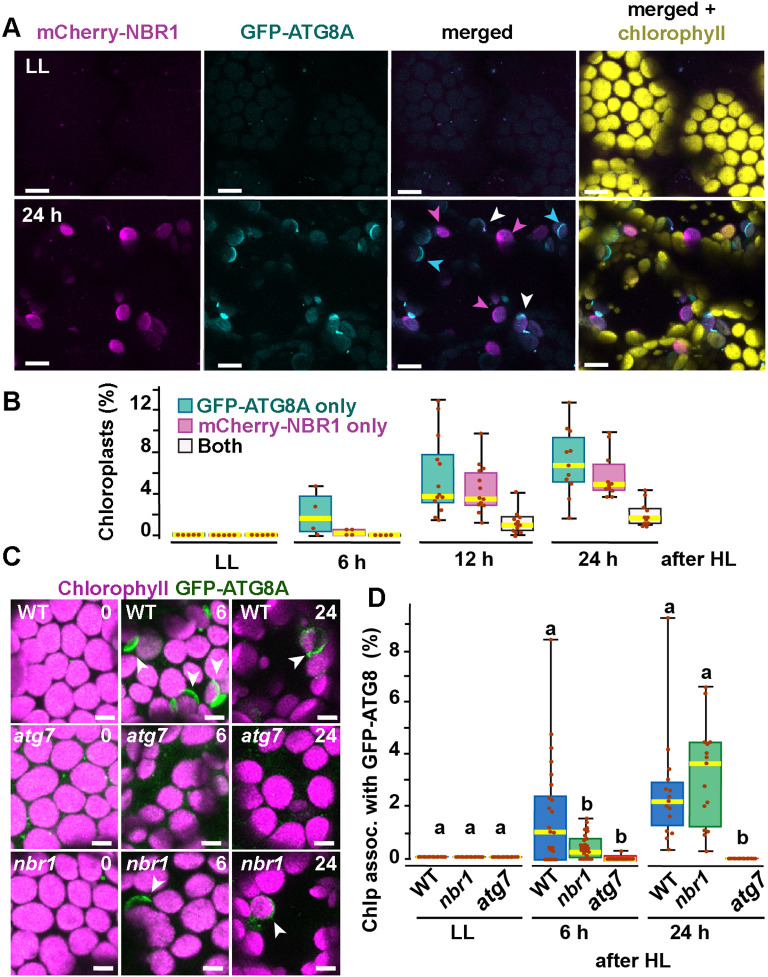
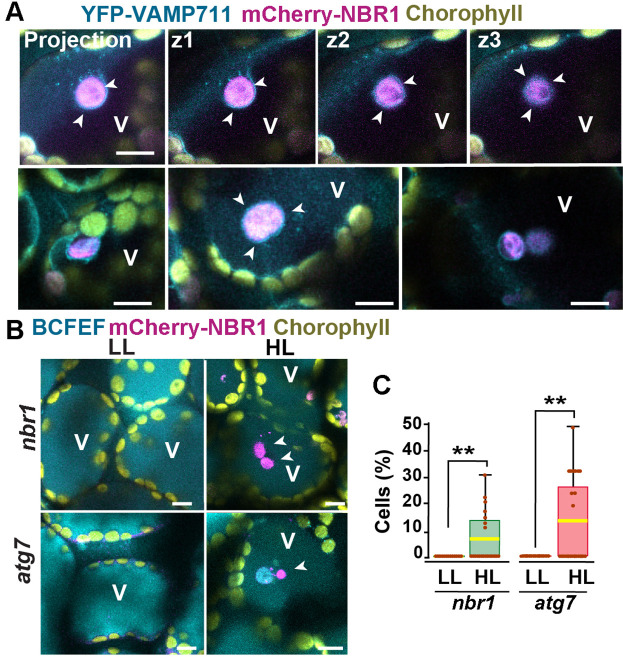
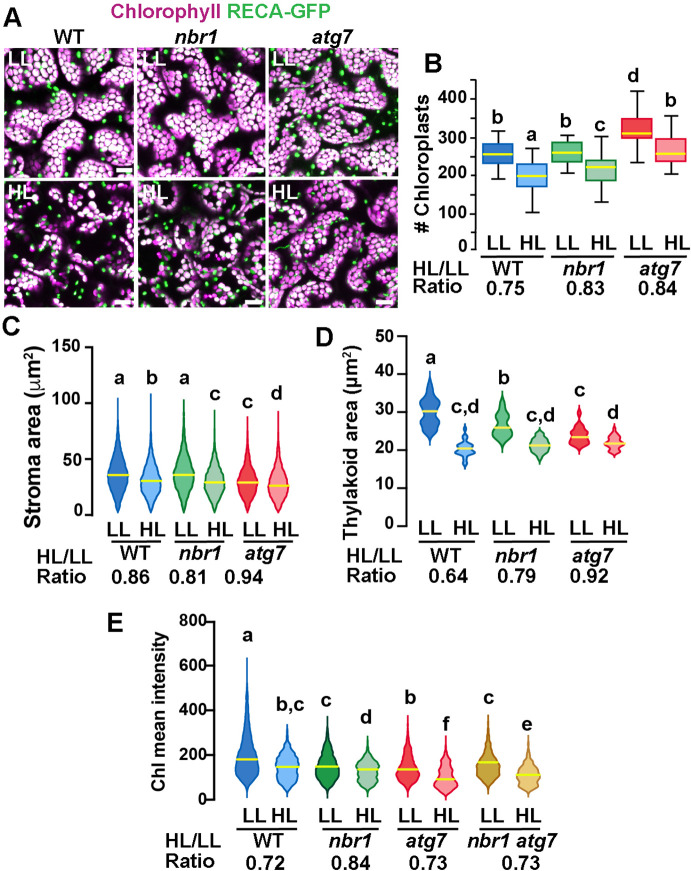
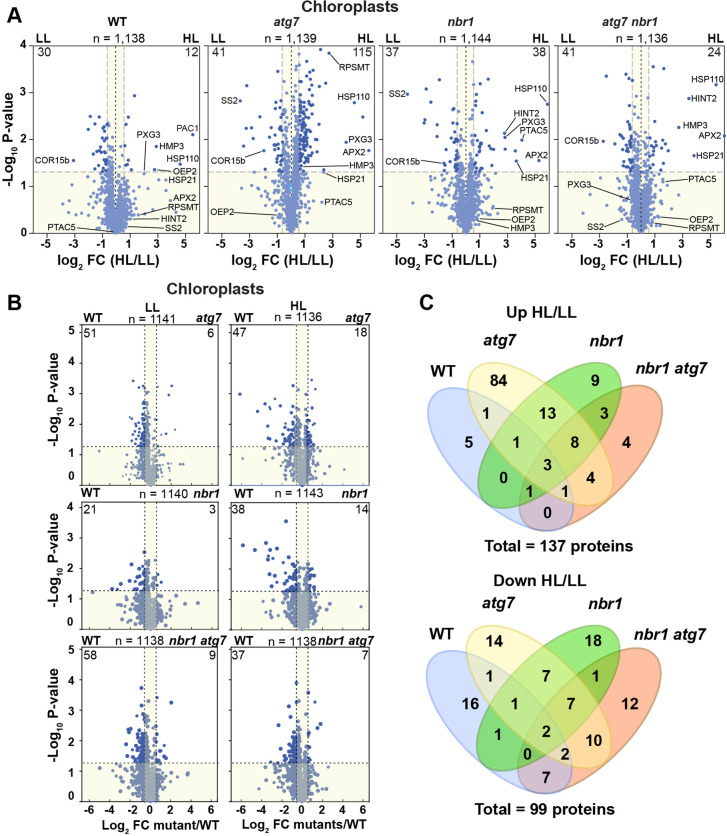
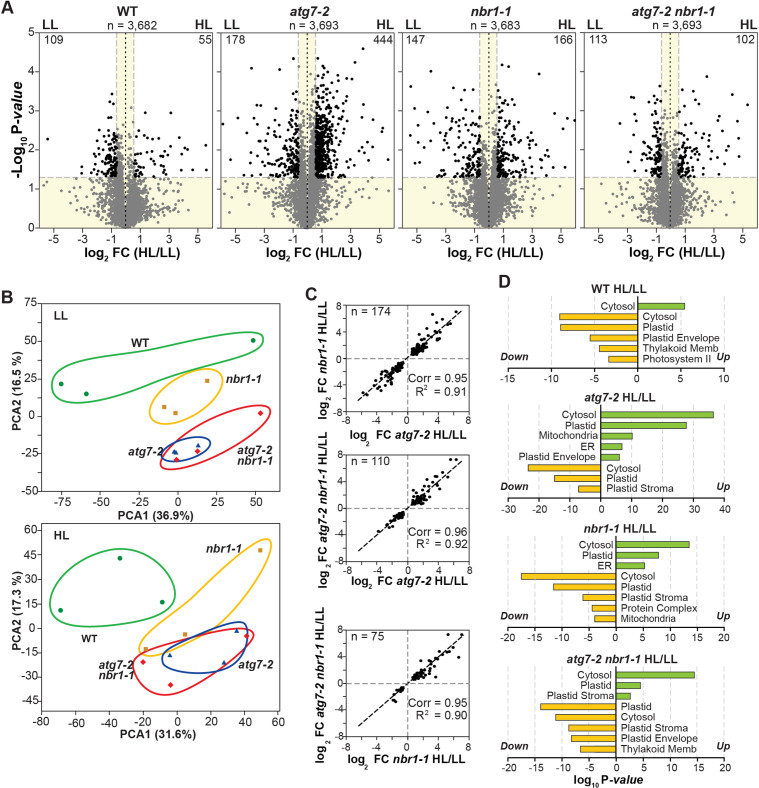
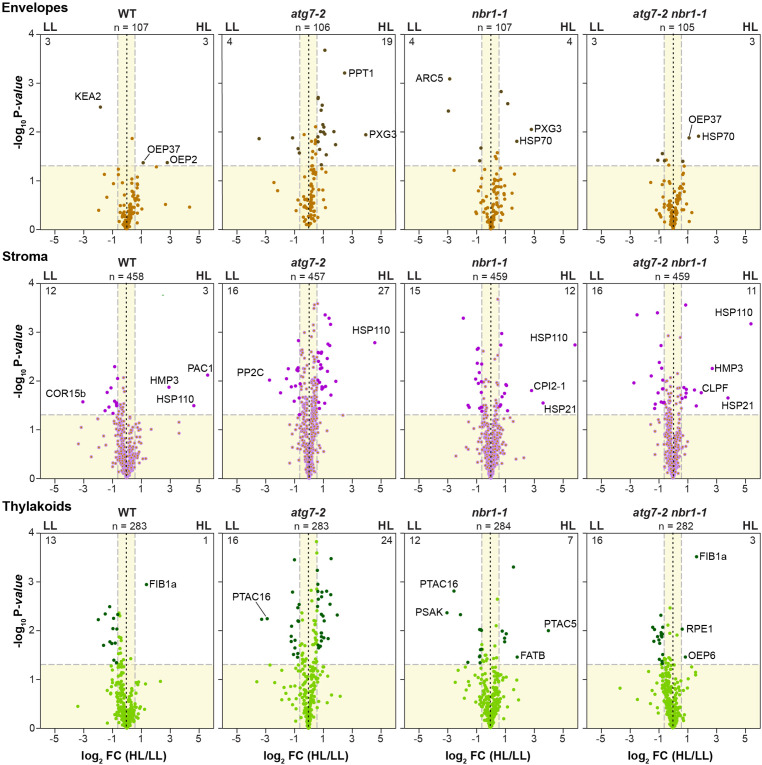
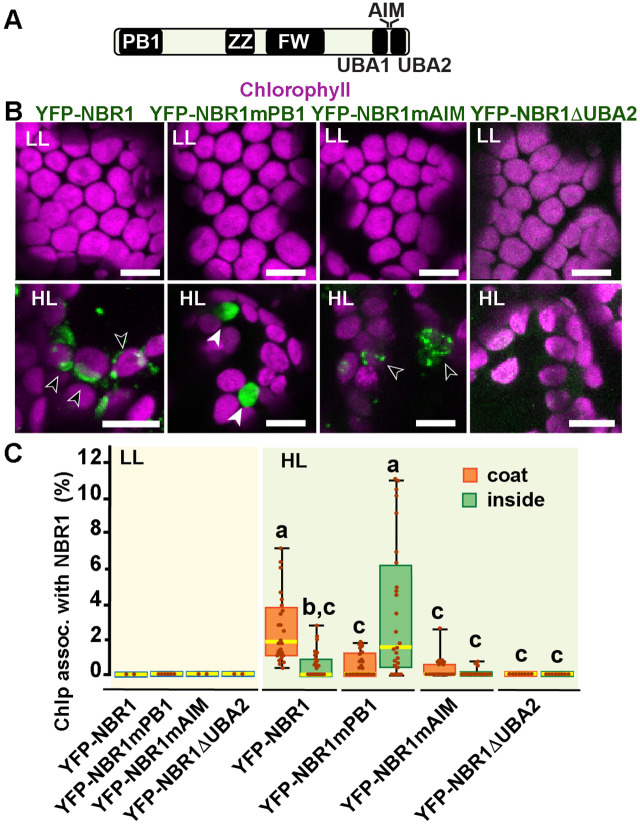
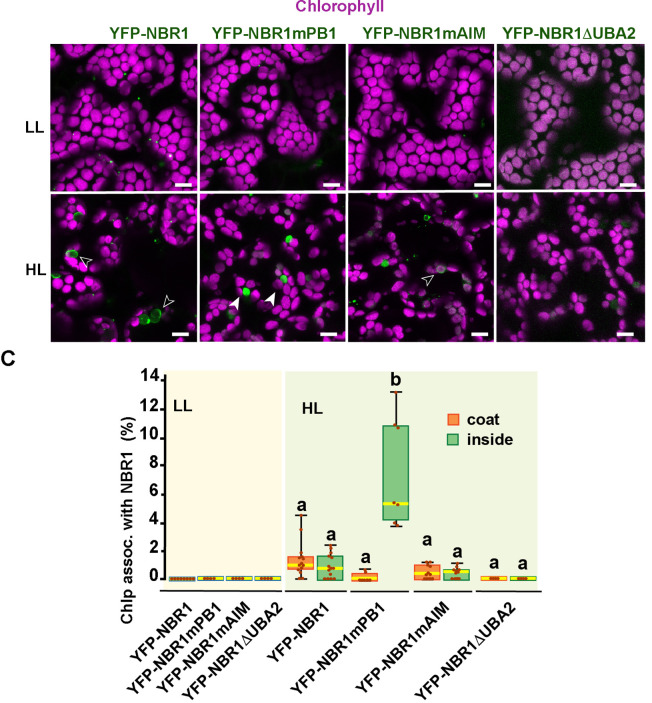
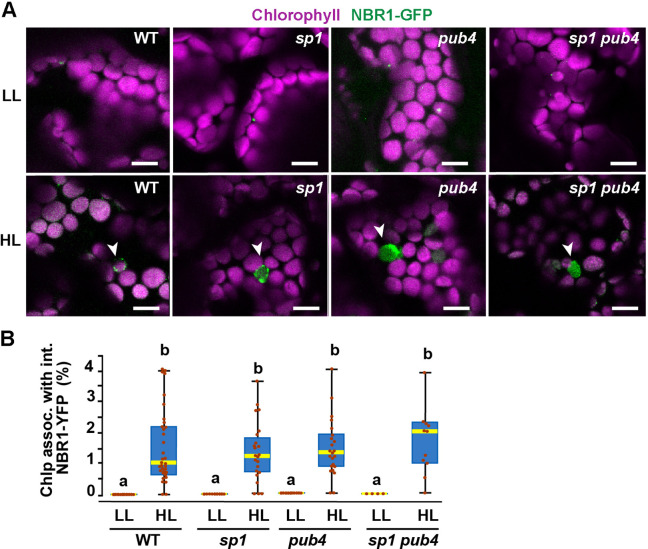
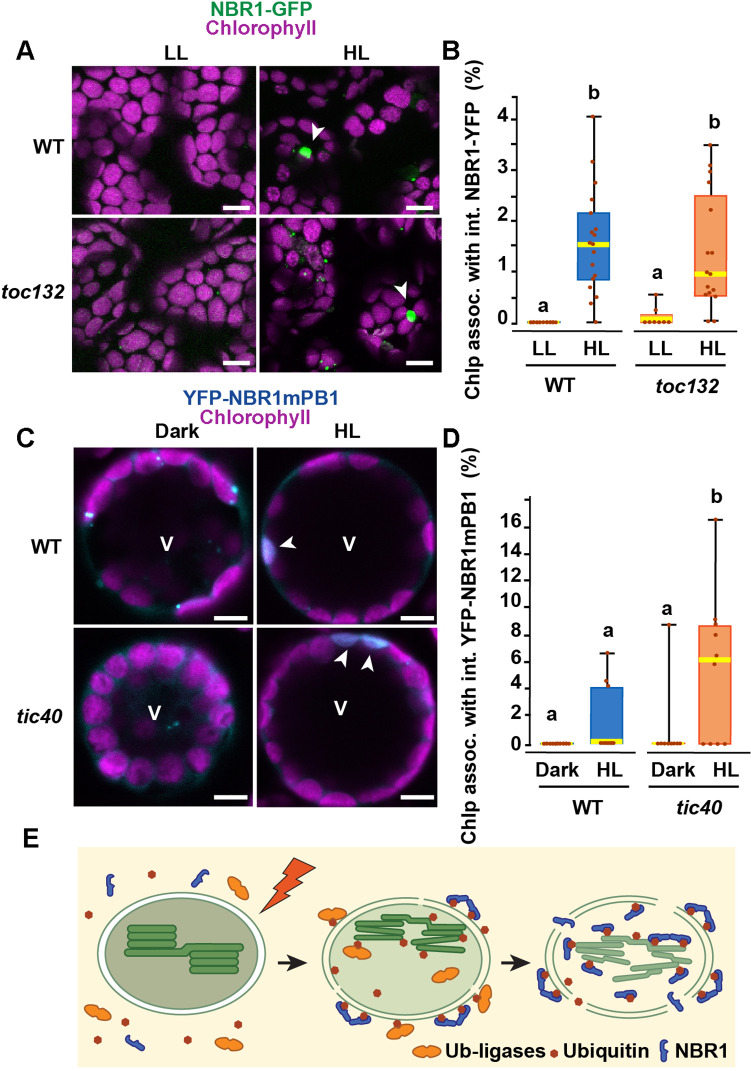
The ubiquitin-binding NBR1 autophagy receptor plays a prominent role in recognizing ubiquitylated protein aggregates for vacuolar degradation by macroautophagy. Here, we show that upon exposing Arabidopsis plants to intense light, NBR1 associates with photodamaged chloroplasts independently of ATG7, a core component of the canonical autophagy machinery. NBR1 coats both the surface and interior of chloroplasts, which is then followed by direct engulfment of the organelles into the central vacuole via a microautophagy-type process. The relocalization of NBR1 into chloroplasts does not require the chloroplast translocon complexes embedded in the envelope but is instead greatly enhanced by removing the self-oligomerization mPB1 domain of NBR1. The delivery of NBR1-decorated chloroplasts into vacuoles depends on the ubiquitin-binding UBA2 domain of NBR1 but is independent of the ubiquitin E3 ligases SP1 and PUB4, known to direct the ubiquitylation of chloroplast surface proteins. Compared to wild-type plants, nbr1 mutants have altered levels of a subset of chloroplast proteins and display abnormal chloroplast density and sizes upon high light exposure. We postulate that, as photodamaged chloroplasts lose envelope integrity, cytosolic ligases reach the chloroplast interior to ubiquitylate thylakoid and stroma proteins which are then recognized by NBR1 for autophagic clearance. This study uncovers a new function of NBR1 in the degradation of damaged chloroplasts by microautophagy.

Keywords: A. thaliana; autophagy receptor; cell biology; chlorophagy; microautophagy; plant biology; ubiquitin.


Conflict of interest statement

HL, JC, AG, KC, JB, SS, AM, RV, KE, MO No competing interests declared

Figures

Figure 1.
Figure 1.. NBR1 associates with chloroplasts after HL exposure.
(A) Confocal imaging of NBR1-GFP and chlorophyll autofluorescence in cotyledons and hypocotyl cells of 8-day-old wild-type seedlings grown under low light (LL, 40 μmol m–2 s–1) or left to recover for 24 hr after exposure to 2 hr HL conditions (HL, 1,500 μmol m–2 s–1) at 12 °C. After HL exposure, NBR1 either coated the surface of chloroplasts and stromules or localized inside chloroplasts. (B) Box and whisker plots represent the percentage of chloroplast associated with NBR1-GFP in 8-day-old seedlings grown under LL or 24 hr after HL exposure. At least 35 confocal images from 7 to 12 cotyledons were analyzed for each condition. (C) Box and whisker plots showing chlorophyll mean intensity from chloroplast with and without NBR1-GFP in cotyledons from 8-day-old seedling grown under LL or exposed to HL and left to recover for 12 hr or 24 hr. Representative experiment showing data from at least 5 randomly selected chloroplasts for each condition. (D) Ratio of chlorophyll fluorescence intensities at 517.4 m and 683.4 nm. Representative experiment showing data from 6 chloroplasts with or without NBR1-GFP from 8 day old cotyledons 24 hr after HL exposure. Different letters on the graph indicate significant difference (P<0.05) calculated by one-way ANOVA followed by Tukey’s test. (E) Confocal imaging of cotyledons from 8-day-old seedling expressing mCherry-NBR1 in nbr1 and atg7 plants grown under LL or exposed to HL and left to recover for 6, 12, and 24 hr. Hollow arrowheads and filled arrowheads indicate the mCherry-NBR1 coats and inside chloroplasts, respectively. (F) Box and whisker plots showing the percentage of chloroplasts associated with mCherry-NBR1 as coats (orange) or inside chloroplasts (green) under LL, and at the indicated recovery times after HL exposure. The top and bottom plots show measurements from nbr1 and atg7, respectively. Representative experiment analyzing between 4 and 15 fields from 3 to 6 cotyledons for each condition and genotype. Box and whisker plots in B, C, D, and F display the variation in data through quartiles; the middle line indicates the median and whiskers show the upper and lower fences. Asterisks in B and D denote significant differences based on t-tests (**, p<0.01). Scale bars = 5 μm in A and E.
Figure 2.
Figure 2.. Ultrastructure of chloroplasts in wild-type, atg7, and nbr1 cotyledons 24 hr after HL exposure.
(A) Transmission electron micrograph of a high-pressure frozen/freeze-substituted atg7 cotyledon mesophyll cell from 8-day-old seedlings exposed to HL and left to recover for 24 hr. Three different types of chloroplasts based on their structural integrity are seen. Type-1 chloroplasts with electron dense stroma and tightly appressed thylakoids, Type-2 chloroplasts with lighter stroma and partially disorganized thylakoids, and Type-3 chloroplasts with ruptured envelopes, disorganized thylakoid membranes and a stroma region with similar electron density and appearance to the cytoplasm. (B, C) Representative Type-2 (B) and Type-3 (C) chloroplasts in an atg7 mesophyll cells. Note in (C) that the outer and inner envelopes (arrowheads) are disrupted in several sites (asterisks) exposing the interior of the chloroplast, including thylakoid membranes to the cytosol. (D) Box and whisker plots showing the percentage of Type-1,–2, and –3 chloroplasts per mesophyll cell section in wild-type Col-0 (WT), nbr1, and atg7 cotyledons. Different letters on the graph indicate significant difference (p<0.05) calculated by one-way ANOVA followed by Tukey’s test. Between 7 and 10 cells from two cotyledons of each genotype were used for this analysis. (E) Immunogold labeling with anti NBR1 antibodies on chloroplasts of WT, nbr1, and atg7 mutant mesophyll cells exposed to HL followed by 24 hr recovery. Red arrowheads indicate gold particles on chloroplasts. (F) Quantification of anti-NBR1 gold labeling on Type-1, –2, and –3 chloroplasts and cytoplasm from WT, atg7, and nbr1 mutant mesophyll cells exposed to HL. A t-test was used to compare values between mutant and WT samples; * and ** indicate p<0.05 and p<0.01, respectively. Between 5 and 11 chloroplasts or cytoplasmic regions from 2 cotyledons of each genotype were used for quantification. (G) Immunoblot detection of NBR1, TIC40 (chloroplast inner envelope protein), LHCIIb (thylakoid protein), and cFBP (cytosolic protein) in total protein extracts (T) and chloroplast protein fraction (C) from 4-week-old WT and atg7 plants grown under LL or exposed to HL and let recover for 24 hr. The numbers below indicate the ratios cFBP/TIC40 and NBR1/cFBPase based on the quantification of the western blots. The figure shows a representative set of western blots. The experiment was repeated twice. Box and whisker plots in D and F show the variation in data through quartiles; the middle line indicates the median and whiskers show the upper and lower fences. S, starch; St, stroma; Thy, thylakoids. Scale bars: 1 μm in A, B, C; 500 nm in E.
Figure 2—figure supplement 1.
Figure 2—figure supplement 1.. Uncropped immunoblot of total proteins from wild type plants expressing NBR1-GFP, and atg7-1 and nbr1 mutants using anti-NBR1 antibodies (Jung et al., 2020).
Figure 3.
Figure 3.. Recruitment of NBR1 and ATG8A to photodamaged chloroplasts.
(A) Confocal imaging of cotyledon mesophyll cells from 8-day-old seedlings expressing mCherry-NBR1 and GFP-ATG8A under LL (top) and at 24 hr after HL exposure (bottom). Magenta, cyan, and white arrowheads indicate chloroplasts associated with mCherry-NBR1, GFP-ATG8, or both, respectively. (B) Box and whisker plots showing the percentage of chloroplasts associated with GFP-ATG8A only (cyan), mCherry-NBR1 only (magenta), or both (white) under LL and during recovery after HL exposure. Between 4 and 13 regions containing 20–30 chloroplasts from two seedlings for each time point/treatment were used for this analysis. (C) Confocal imaging of GFP-ATG8A in cotyledons of 8-day-old wild-type Col-0 (WT), atg7, and nbr1 seedlings grown under LL, and 6 and 24 hr after HL treatment. Arrowheads indicate chloroplasts associated with GFP-ATG8A. (D) Box and whisker plot displaying the percentage of chloroplast associated with GFP-ATG8A in different genotypes, under LL and recovery after HL. Different letters on the graph indicate significant difference (p<0.05) calculated by one-way ANOVA followed by Tukey’s test. Box and whisker plots in B and D show the variation in data through quartiles; the middle line indicates the median and whiskers show the upper and lower fences. Between 4 and 13 regions containing 20–30 chloroplasts from two seedlings at each time point/treatment were used for this analysis. Scale bars: 10 μm in A and C.
Figure 4.
Figure 4.. Vacuolar delivery of NBR1-positive chloroplast into the vacuole.
(A) Projection of three confocal images (z1–z3) and several other confocal images of cotyledon mesophyll cells from 1-week-old, wild-type seedlings expressing the tonoplast marker YFP-VAMP711 and mCherry-NBR1, 24 hr after HL exposure. Chloroplast labeled by mCherry-NBR1 were surrounded by the tonoplast (arrowheads) and internalized into the vacuole (V) through microautophagy. (B) Confocal images of nbr1 and atg7 cotyledon mesophyll cells at 24 hr after HL exposure and stained with the vacuolar dye BCECF. Note the mCherry-NBR1-labeled chloroplasts inside the vacuoles. (C) Box and whisker plot displaying the percentage of cells containing mCherry-NBR1-labeled chloroplasts inside their vacuoles. Boxes show the variation in data through quartiles; the middle line indicates the median and whiskers show the upper and lower fences. A t-test was used to compare values between LL and recovery after HL ** indicate p<0.01. Between 13 and 27 regions containing 7-10 cells from at least two seedlings of each treatment and genotype were used for this analysis. Scale bars: 10 μm in A and B.
Figure 5.
Figure 5.. Chloroplast remodeling after HL exposure.
(A) Projections of 20 confocal images along a z-stack taken from the adaxial side of cotyledon mesophyll cells from 8-day-old wild-type (WT), atg7, and nbr1 seedlings expressing RECA-GFP. Seedlings were grown under LL, exposed to HL for 2 hr and let recover for 24 hr. (B) Chloroplast density in adaxial-facing mesophyll cells (number of chloroplasts per 2.16 μm2) based on confocal images. At least 20 randomly selected areas from 6 to 9 cotyledons were considered in this analysis. Boxes show the variation in data through quartiles; the middle line indicates the median and whiskers show the upper and lower fences. (C) Stroma area (μm2) as measured by the RECA-GFP fluorescence signal per individual chloroplast imaged by confocal microscopy. Lines in violin plots indicate median values. At least 25 individual chloroplasts were measured for each genotype and condition. (D) Thylakoid area (μm2) as measured by chlorophyll fluorescence signal area per individual chloroplast. Line in violin plots indicate median values. At least 5000 individual chloroplasts were measured for each genotype and condition. (E) Chlorophyll mean intensities measured in individual chloroplasts by multiphoton imaging. Between 1300 and 2600 individual chloroplasts were measured for each genotype and condition. Lines in violin plot indicate median values. In B to E, the HL/LL ratio was calculated by dividing the average value from HL-treated plants by the average value of the plants grown under LL. Different letters denote significant differences from each other based on two-way ANOVA followed by Tukey’s test (p<0.05). Scale bars: 10 μm in A.
Figure 6.
Figure 6.. Chloroplast proteome analysis by liquid chromatography-tandem mass spectrometry (LC-MS/MS).
(A) Volcano plots showing the changes in the relative abundance of chloroplast proteins under LL or HL, in wild type (WT) and mutants. The number on the top of each plot indicates the total number of detected proteins assigned by GO to chloroplasts. Several representative proteins are labeled in each plot. The lighter blue points identify proteins with insignificant changes, while the darker blue points identify those that meet a significance threshold of FC > 1.5 or –1.5 and p-value < 0.05. The numbers at the left and right corners of each plot indicate the less or more abundant proteins, respectively. (B) Volcano plots as in (A) showing the changes in the relative abundance of chloroplast proteins in mutants relative to WT, either under LL or HL. (C) Venn diagrams depicting the overlap among chloroplast proteins changing abundance between HL and LL conditions in mutants and WT plants.
Figure 6—figure supplement 1.
Figure 6—figure supplement 1.. Proteome analysis by liquid chromatography-tandem mass spectrometry (LC-MS/MS).
(A) Volcano plots showing the relative abundance changes of total proteins detected in wild type (Col-0), nbr1, atg7, and nbr1 atg7 seedlings grown either under LL or exposed to HL and let recover for 24 hr. Proteins were identified by LC-MS/MS and their average abundances were quantified from the MS1 precursor ion intensities. Only proteins with at least two peptide spectral matches were considered in the analysis. Each protein is plotted based on its Log2 FC in abundance (HL/LL) and its -log10 p-value in significance based on the three biological replicates each analyzed twice. The gray points identify proteins with insignificant changes, while the black points identify those that also meet a significance threshold of FC >1.5 or –1.5 and p-value < 0.05. (B) Principal component analysis (PCA) of proteomic analysis samples. The plot depicts each biological replicate used for the proteomic analysis from WT Col-0, atg7, nbr1, and nbr1 atg7 plants either under LL or after HL exposure. (C) Correlation analysis. Scatter plots comparing log2 fold changes (FCs) in protein levels in several genotypes from HL versus LL conditions. The total number of proteins analyzed in each panel is indicated, along with Pearson’s correlation coefficients (Corr) and fit (R2) values. The dashed lines show a Corr = 1. Proteins were selected based on FC >1.5 or<1.5 and p-values <0.05 in the two compared genotypes. (D) GO terms analysis of proteins with significant abundance changes under HL conditions in the WT, nbr1, atg7, and nbr1 atg7 mutant plants.
Figure 6—figure supplement 2.
Figure 6—figure supplement 2.. Proteome analysis by liquid chromatography-tandem mass spectrometry (LC-MS/MS) of chloroplast proteins localized to envelopes, stroma, and thylakoid membranes.
Volcano plots showing the relative abundance changes of chloroplast proteins grouped by subcompartments (envelopes, stroma, and thylakoids) in wild-type (Col-0), nbr1, atg7, and nbr1 atg7 seedlings grown either under LL or exposed to HL and let recover for 24 hr. Proteins were identified by LC-MS/MS, and their average abundances were quantified from the MS1 precursor ion intensities. Only proteins with at least two peptide spectral matches were considered in the analysis. Each protein is plotted based on its Log2 FC in abundance (HL/LL) and its -log10 p-value in significance based on the from three biological replicates each analyzed twice. Proteins were assigned to the various chloroplast compartments by GO; n, total number assigned. The lighter colored points identify detected proteins assigned to that compartment with insignificant changes, while the darker colored points identify those that also meet a significance threshold of FC > 1.5 or –1.5 and p-value < 0.05. Specific proteins with significant changes are labelled.
Figure 7.
Figure 7.. NBR1 domains have distinct roles in recruiting NBR1 to chloroplasts after HL treatment.
(A) Diagram of the Arabidopsis NBR1 protein and its domains. FW, Four-Tryptophan domain; PB1, Phox and Bem1p domain; ZZ, ZZ-type zinc finger domain; UBA1 and UBA2, ubiquitin-associated domains; AIM, ATG8-interacting motif. (B) Confocal imaging of NBR1 mutated proteins fused to YFP expressed in 8-day-old nbr1 seedlings grown under LL (top) or at 24 hr after HL exposure (bottom). Hollow arrowheads and filled arrowheads indicate YFP-NBR1 coating chloroplasts and inside chloroplasts, respectively. (C) Box and whisker plots show the percentages of chloroplast associated with the YFP-labeled mutated NBR1 proteins, localized to either coats (orange) or inside chloroplasts (green). Boxes show the variation in data through quartiles; the middle line indicates the median and whiskers show the upper and lower fences. Different letters denote significant differences from each other based on two-way ANOVA followed by Tukey’s test (p<0.05). Between 2 and 26 regions containing 20–30 chloroplasts from at least two seedlings for each treatment and NBR1 construct were used for this analysis. Scale bars: 10 μm in B.
Figure 7—figure supplement 1.
Figure 7—figure supplement 1.. NBR1 domains in NBR1 recruitment to chloroplasts in nbr1 atg7 double mutant cotyledons after HL treatment.
(A) Confocal imaging of NBR1 mutated proteins fused to YFP expressed in 8-day-old nbr1 atg7 seedlings grown under LL (top) or 24 hr after HL exposure (bottom). Hollow arrowheads and filled arrowheads indicate YFP-NBR1 coating chloroplasts and inside chloroplasts, respectively. (C) Box and whisker plots show the percentage of chloroplast associated with the YFP-labeled mutated NBR1 proteins, localized to either coats (orange) or inside chloroplasts (green). Boxes show the variation in data through quartiles; the middle line indicates the median and whiskers show the upper and lower fences. Between 4 and 14 regions containing 20–30 chloroplasts from at least two seedlings of each treatment and genotype were used for this analysis. Scale bars: 10 μm in A.
Figure 8.
Figure 8.. NBR1 association with chloroplasts in mutants lacking SP1 and PUB4 E3 ligases.
(A) Confocal imaging of NBR1-GFP in 8-day-old wild type (Col-0), sp1, pub4, and sp1 pub4 seedlings under LL and 24 hr after HL exposure. Arrowheads indicate chloroplasts decorated with NBR1-GFP. (B) Box and whisker plots show the percentage of chloroplast associated with NBR1-GFP under LL and 24 hr after HL treatment. Boxes show the variation in data through quartiles; the middle line indicates the median and whiskers show the upper and lower fences. Different letters denote significant differences from each other based on two-way ANOVA followed by Tukey’s test (p<0.05). Between 4 and 34 regions containing 20–30 chloroplasts from at least two seedlings of each treatment and genotype were used for this analysis. Scale bar: 10 μm in A.
Figure 9.
Figure 9.. The TIC-TOC translocon is not required for the internalization of NBR1 into photodamaged chloroplasts.
(A) Confocal imaging of NBR1-GFP in wild-type Col-0 (WT) and toc132 cotyledon mesophyll cells from 1-week-old seedlings grown under LL or at 24 hr after HL exposure. Arrowheads indicate chloroplasts with internal NBR1-GFP signal. (B) Box and whisker plot displaying the percentages of chloroplasts associated with NBR1-GFP signal in WT and toc132 mutant mesophyll cells under LL or at 24 hr after HL exposure. Between 8 and 18 regions containing 20–30 chloroplasts from at least 3 cotyledons were used for quantification. (C) Protoplasts from 3-week-old wild-type Col-0 (WT) and tic40-4 expressing YFP-NBR1mPB1. Protoplasts were left in the dark or exposed to HL for 2 hr and imaged 12 hr later. Arrowheads indicate chloroplasts with internal YFP-mPB1-NBR1 signal. V, vacuole. (D) Box and whisker plot displaying the percentages of wild type and tic40-4 chloroplasts associated with YFP-mPB1-NBR1 signal in WT and tic40-4 mutant protoplasts kept in dark conditions or exposed to HL and left to recover for 12 hr. Between 9 and 10 protoplasts of each genotype and condition were used for quantification. In B and D, boxes show the variation in data through quartiles; the middle line indicates the median and whiskers show the upper and lower fences. Different letters denote significant differences from each other based on two-way ANOVA followed by Tukey’s test (p < 0.05). (E) Diagram summarizing a proposed mechanism for NBR1 association with photodamaged chloroplasts. HL exposure induces the breakdown of the chloroplast envelopes allowing the cytosolic ubiquitylation machinery to reach the stroma and thylakoids of photodamaged chloroplasts. As stromal and thylakoidal proteins become ubiquitylated, NBR1 diffuses into damaged chloroplasts and bind ubiquitylated proteins through its UBA2 domain. NBR1-decorated photodamaged chloroplasts are then delivered to the vacuole by microautophagy independently of ATG7. Scale bars: 5 μm in A and C.

Update of

  • doi: 10.1101/2023.01.27.525901

Similar articles

Cited by

References

    1. Bjørkøy G, Lamark T, Brech A, Outzen H, Perander M, Overvatn A, Stenmark H, Johansen T. P62/Sqstm1 forms protein aggregates degraded by autophagy and has a protective effect on huntingtin-induced cell death. The Journal of Cell Biology. 2005;171:603–614. doi: 10.1083/jcb.200507002. - DOI - PMC - PubMed
    1. Cha-Molstad H, Sung KS, Hwang J, Kim KA, Yu JE, Yoo YD, Jang JM, Han DH, Molstad M, Kim JG, Lee YJ, Zakrzewska A, Kim SH, Kim ST, Kim SY, Lee HG, Soung NK, Ahn JS, Ciechanover A, Kim BY, Kwon YT. Amino-Terminal arginylation targets endoplasmic reticulum chaperone BiP for autophagy through p62 binding. Nature Cell Biology. 2015;17:917–929. doi: 10.1038/ncb3177. - DOI - PMC - PubMed
    1. Chiba A, Ishida H, Nishizawa NK, Makino A, Mae T. Exclusion of ribulose-1,5-bisphosphate carboxylase/oxygenase from chloroplasts by specific bodies in naturally senescing leaves of wheat. Plant & Cell Physiology. 2003;44:914–921. doi: 10.1093/pcp/pcg118. - DOI - PubMed
    1. Chung T, Phillips AR, Vierstra RD. Atg8 lipidation and ATG8-mediated autophagy in Arabidopsis require Atg12 expressed from the differentially controlled ATG12A and ATG12B loci. The Plant Journal. 2010;62:483–493. doi: 10.1111/j.1365-313X.2010.04166.x. - DOI - PubMed
    1. Ciuffa R, Lamark T, Tarafder AK, Guesdon A, Rybina S, Hagen WJH, Johansen T, Sachse C. The selective autophagy receptor p62 forms a flexible filamentous helical scaffold. Cell Reports. 2015;11:748–758. doi: 10.1016/j.celrep.2015.03.062. - DOI - PubMed

Publication types

MeSH terms