. 2023 Jun 26;35(7):2484-2503.
doi: 10.1093/plcell/koad112.

Binding by the Polycomb complex component BMI1 and H2A monoubiquitination shape local and long-range interactions in the Arabidopsis genome

Affiliations

Binding by the Polycomb complex component BMI1 and H2A monoubiquitination shape local and long-range interactions in the Arabidopsis genome

Xiaochang Yin et al. Plant Cell. .

Abstract

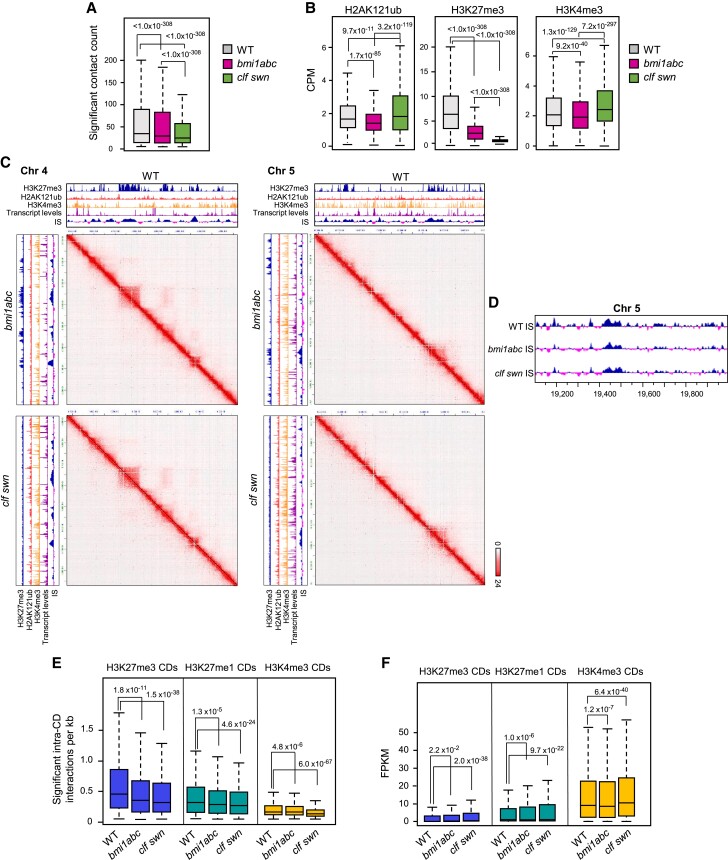
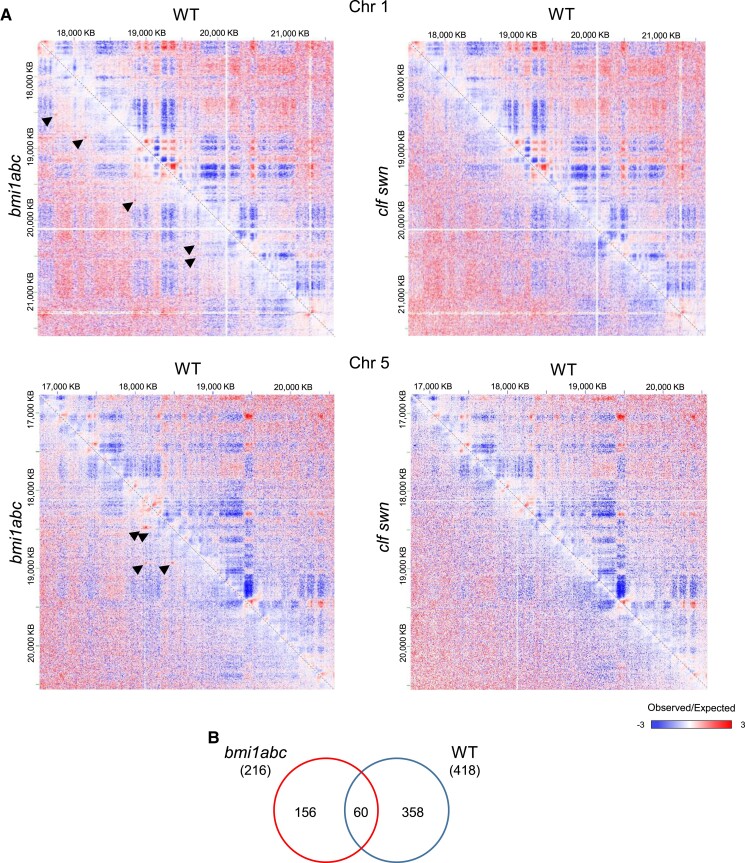
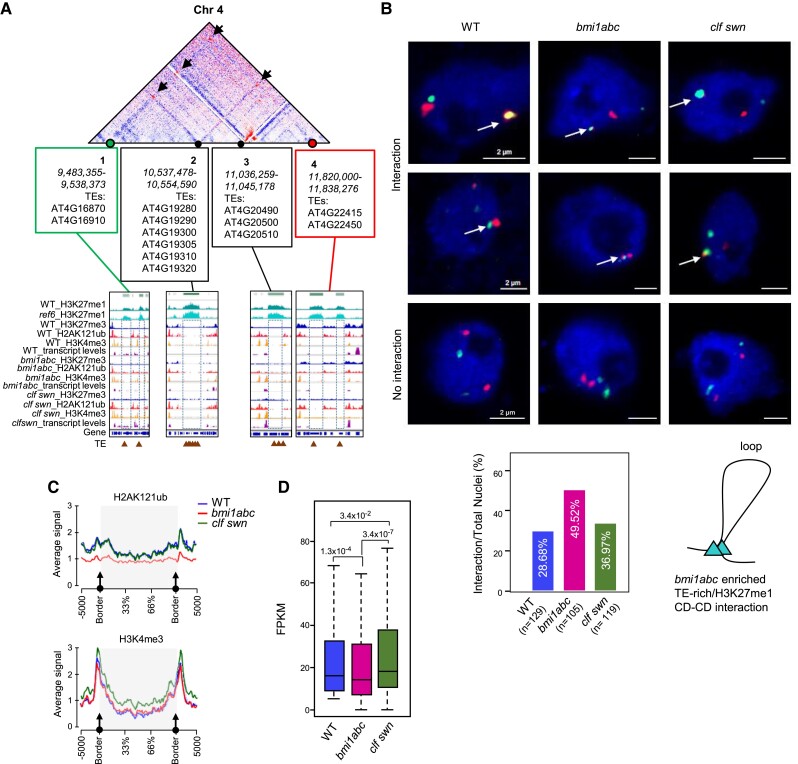
Three-dimensional (3D) chromatin organization is highly dynamic during development and seems to play a crucial role in regulating gene expression. Self-interacting domains, commonly called topologically associating domains (TADs) or compartment domains (CDs), have been proposed as the basic structural units of chromatin organization. Surprisingly, although these units have been found in several plant species, they escaped detection in Arabidopsis (Arabidopsis thaliana). Here, we show that the Arabidopsis genome is partitioned into contiguous CDs with different epigenetic features, which are required to maintain appropriate intra-CD and long-range interactions. Consistent with this notion, the histone-modifying Polycomb group machinery is involved in 3D chromatin organization. Yet, while it is clear that Polycomb repressive complex 2 (PRC2)-mediated trimethylation of histone H3 on lysine 27 (H3K27me3) helps establish local and long-range chromatin interactions in plants, the implications of PRC1-mediated histone H2A monoubiquitination on lysine 121 (H2AK121ub) are unclear. We found that PRC1, together with PRC2, maintains intra-CD interactions, but it also hinders the formation of H3K4me3-enriched local chromatin loops when acting independently of PRC2. Moreover, the loss of PRC1 or PRC2 activity differentially affects long-range chromatin interactions, and these 3D changes differentially affect gene expression. Our results suggest that H2AK121ub helps prevent the formation of transposable element/H3K27me1-rich long loops and serves as a docking point for H3K27me3 incorporation.


Conflict of interest statement

Conflict of interest statement. The authors declare no competing interests.

Figures

Figure 1.
Figure 1.
Arabidopsis interacting domains are enriched in different histone modifications. A) Hi-C contact matrices showing a pericentromeric (left) and an arm (right) region of chromosome 1 aligned to the levels of H3K27me1, H3K27me3, H2AK121ub, and H3K4me3 in WT, and H3K27me3 in ref6. The IS profile is also included. The upper heatmaps show the positions of CDs. The color intensity represents the frequency of contact. The lower heatmaps show observed over expected signal ratio matrices, where the depletion of interactions is shown in blue and enrichment in red. B) A detailed view of a chromosome 5 arm showing the positions of different types of CDs and the significance of observed contacts within these CDs. The levels of the different modifications in WT, H3K27me3 levels in ref6, gene regions, and IS profile (positive values are indicated in blue and negative values in pink) are included. Pink arrowheads indicate CD borders. Black rectangles highlight the absence of H3K27me3, H2AK121ub, and H3K4me3 at TE and IRs marked with REF6-independent H3K27me1, similar to what happens at pericentromeric H3K27me1 CDs (A). C) Length in kilobase of the different CDs. D) Boxplot showing expression levels in fragments per kilobase of transcript per million mapped reads (FPKM) of genes included in different types of CDs. In the boxplots, the median (middle line), upper and lower quartiles (boxes), and minimum and maximum values (whiskers) are indicated. P-values of differences according to one-sided Mann–Whitney–Wilcoxon test are indicated.
Figure 2.
Figure 2.
Arabidopsis CD borders co-localize with accessible regions depleted of histone modifications. A) Metaplots showing average IS along the different CDs. The upstream (downstream) 5 kb region of the left (right) border is included. B) Boxplot showing significant intra-CD interactions per kilobase in H3K27me3, H3K27me1, and H3K4me3 CDs. The median (middle line), upper and lower quartiles (boxes), and minimum and maximum values (whiskers) are indicated. P-values of differences according to one-sided Mann–Whitney–Wilcoxon test are indicated. C) Metaplots showing the average levels of H3K27me1, H3K27me3 H2AK121ub, H3K4me3, and accessibility in all WT CDs at chromosome arms. The upstream (downstream) 5 kb region of the left (right) border is included. D) Scatter plot showing the relationship between IS and accessibility. The correlation coefficient (r) and P-value according to F-test are indicated. E) Distribution of CD borders relative to gene features (upper panel). Motifs enriched at the region spanning from 250 bp up- and downstream of CD borders. Transcription factors recognizing the two first ranked motifs and the P-values are indicated (bottom panel). F) Hi-C contact matrix (upper panel, where color intensity represents the frequency of contact) and observed over expected signal ratio matrix (bottom panel, where depletion of interaction is shown in blue and enrichment in red) of a chromosome 5 region zoomed in to 1 kb resolution. The IS profile (positive values are indicated in blue and negative values in pink), as well as the levels of H3K27me3 in ref6, the levels of H3K27me1, H3K27me3, H2AK121ub, and H3K4me3 in WT, transcript levels, and gene regions are included. Dashed triangles indicate representative H3K27me3 and H3K4me3 CDs. Rectangles indicate representative H3K27me1 marked regions depleted of H3K27me3, H2AK121ub and H3K4me3. Right panel shows a detailed view of self-interacting genes within H3K4me3 enriched CD.
Figure 3.
Figure 3.
BMI1 binding and H2AK121ub deposition reduce the strength of chromatin loops enriched in H3K4me3 activation marks. A) Expression levels in FPKM of genes marked with different combinations of histone modifications. The median (middle line), upper and lower quartiles (boxes), and minimum and maximum values (whiskers) are indicated. P-values of differences according to one-sided Mann–Whitney–Wilcoxon test are indicated. B) Metagene plots of BMI1B-FLAG and H2AK121ub coverage at BMI1B target genes. C) Integrated genomics viewer (IGV) screenshot showing H3K27me3, H2AK121ub, and BMI1B-FLAG peaks. The localizations of VAL1-GFP-binding regions and genes are indicated (upper panel). First ranked motif enriched at BMI1 binding sites (bottom panel). D) Pie chart showing the proportions of BMI1/H2AK121ub_loops, only H3K4me3_loops, and other loops. Table indicating the number of ≥6 kb and ≤6 kb chromatin loops and gene loops in the different types of loops (bottom panel). E) Heatmap showing the enrichment of BMI1, H3K4me3, H2AK121ub, and H3K27me3, at H2AK121ub/H3K27me3 marked genes, BMI1/H2AK121ub_loops, only H3K4me3_loops and other loops. F) Boxplot showing the strength of the different types of chromatin loops in WT. The median (middle line), upper and lower quartiles (boxes), and minimum and maximum values (whiskers) are indicated. P-values of differences according to one-sided Mann–Whitney–Wilcoxon test are indicated.
Figure 4.
Figure 4.
PRC1 and PRC2 activities are required to maintain intra-CD interactions. A) Boxplots showing significant contact counts in WT, bmi1abc, and clf swn. B) Boxplots showing levels of H3K27me3, H2AK121ub, and H3K4me3 in WT, bmi1abc, and clf swn. C) Hi-C contact matrices of single regions of chromosomes 4 and 5 in WT, bmi1abc, and clf swn zoomed in to 1 kb resolution. Color intensity represents the frequency of contact. In the IS profiles (positive values are indicated in blue and negative values in pink), H3K27me3, H2AK121ub, H3K4me3, and transcript levels are indicated in each case. D) IS profile of a region of chromosome 5 in WT, bmi1abc, clf swn. Positive values are indicated in blue and negative values in pink. E) Boxplot showing significant intra-CD interactions in WT, bmi1abc, and clf swn. F) Boxplot showing the expression levels of genes included in the different CDs in WT, bmi1abc, and clf swn. In all boxplots, the median (middle line), upper and lower quartiles (boxes) and minimum and maximum values (whiskers) are indicated. P-values of differences according to one-sided Wilcoxon signed rank test are indicated.
Figure 5.
Figure 5.
Long-range interactions are altered in mutants compared to WT. A) Observed over expected signal ratio matrices showing a region of chromosome 1 (upper panel) and 5 (bottom panel) in WT, bmi1abc, and clf swn zoomed in to 5 kb resolution. Red (blue) indicate regions exhibiting much greater (lower) interaction strength than expected by chance. Arrowheads indicate enriched long-range interactions detected in bmi1abc. B) Venn diagram showing overlap between the numbers of long-range interactions (loops) identified in bmi1abc and WT. Total numbers are shown in parentheses.
Figure 6.
Figure 6.
bmi1abc Displays enrichment in long-range interactions among TE-rich/H3K27me1 marked regions. A) Observed over expected signal ratio matrices showing a region of chromosome 5 in WT, bmi1abc, and clf swn aligned with the positions of H3K27me1 peaks in WT; H3K27me3, H2AK121ub, and H3K4me3 levels, transcript levels, and gene regions in each genotype are indicated. Green triangles indicate interacting regions in bmi1abc and black arrowheads indicate long-range interactions between these regions. A detailed view of interacting regions in bmi1abc, with the levels of different histone marks in WT and ref6 shown below. Brown triangles indicate TE genes. B) Percentage of significant interactions among the different types of CDs in WT, bmi1abc, and clf swn. Color code also refers to the percentage of interactions. The percentage of H3K27me1 CD–CD interactions in bmi1abc is highlighted in red. C) Boxplot showing H3K27me1 levels in WT and ref6-5 at bmi1abc TE-rich/H3K27me1 interacting domains. The median (middle line), upper and lower quartiles (boxes), and minimum and maximum values (whiskers) are indicated. “ns” indicates not significant difference according to one-sided Mann–Whitney–Wilcoxon test.
Figure 7.
Figure 7.
BMI1-mediated H2AK121ub incorporation hampers the formation of long-range interactions among TE-rich/H3K27me1-enriched regions. A) A region of chromosome 4 showing the positions of H3K27me1 CDs (1 to 4) involved in bmi1abc-enriched long-range interactions (red dots indicated by black arrows). TEs included in these CDs are indicated. The levels of H3K27me1 in WT and ref6-5 as well as the levels of H3K27me3, H2AK121ub, H3K4me3 and transcription in the different genotypes are shown. Dotted rectangles highlight the absence of H3K27me3, H2AK121ub, H3K4me3 modifications at these regions. Brown triangles indicate TE genes. B) Representative examples of 3D FISH visualization of long-range interactions enriched in bmi1abc predicted by HI-C. BAC probes are located at position 1 (A, green) and position 4 (A, red) of chromosome 4. Scale bars are 2 µm. Bar plot (below) shows the percentage of nuclei showing interactions between these regions in WT, bmi1abc, and clf swn. Data were collected from three independent biological replicates. The schematic drawing depicts the loop created by the interaction of two TE-rich/H3K27me1 CDs. C) Metaplots showing average levels of H2AK121ub (top panel) and H3K4me3 (bottom panel) at H3K27me1 CDs and surrounding regions in WT clf swn and bmi1abc. D) Boxplot showing the expression levels of genes included in bmi1abc loops in WT, bmi1abc and clf swn. For comparison, we used genes that in WT showed transcript levels > 5 FPKM. The median (middle line), upper and lower quartiles (boxes), and minimum and maximum values (whiskers) are indicated. P-values of differences according to one-sided Mann–Whitney–Wilcoxon test are indicated.
Figure 8.
Figure 8.
Model for the different roles of PRC1-mediated H2AK121ub in shaping local and long-range interactions. A) The combined activity of PRC1 and PRC2 is required to maintain the appropriate intra-CD interactions. B) The binding of BMI1 and the incorporation of H2AK121ub at H3K4me3-marked genes dampen gene loop formation to modulate gene transcription. C) The incorporation of H2AK121ub helps change the 3D organization by preventing TE rich/H3K27me1 loop interactions and serving as a docking point for H3K27me3 incorporation. Subsequently, interactions among H3K27me3 CDs shape the 3D chromatin organization required to regulate gene expression.

Similar articles

Cited by

References

    1. Antunez-Sanchez J, Naish M, Ramirez-Prado JS, Ohno S, Huang Y, Dawson A, Opassathian K, Manza-Mianza D, Ariel F, Raynaud C, et al. . A new role for histone demethylases in the maintenance of plant genome integrity. Elife. 2020:9:e58533. 10.7554/eLife.58533 - DOI - PMC - PubMed
    1. Ay F, Bailey TL, Noble WS. Statistical confidence estimation for Hi-C data reveals regulatory chromatin contacts. Genome Res. 2014:24(6):999–1011. 10.1101/gr.160374.113 - DOI - PMC - PubMed
    1. Baile F, Gómez-Zambrano Á, Calonje M. Roles of polycomb complexes in regulating gene expression and chromatin structure in plants. Plant Commun. 2022:3(1):100267. 10.1016/j.xplc.2021.100267 - DOI - PMC - PubMed
    1. Baile F, Merini W, Hidalgo I, Calonje M. EAR domain-containing transcription factors trigger PRC2-mediated chromatin marking in Arabidopsis. Plant Cell. 2021:33(8):2701–2715. 10.1093/plcell/koab139 - DOI - PMC - PubMed
    1. Bi X, Cheng Y-J, Hu B, Ma X, Wu R, Wang J-W, Liu C. Nonrandom domain organization of the Arabidopsis genome at the nuclear periphery. Genome Res. 2017:27(7):1162–1173. 10.1101/gr.215186.116 - DOI - PMC - PubMed

Publication types

MeSH terms

LinkOut - more resources