. 2023 May 31;97(5):e0165822.
doi: 10.1128/jvi.01658-22. Epub 2023 Apr 18.

Peripheral Nerve Injury Induced by Japanese Encephalitis Virus in C57BL/6 Mouse

Affiliations

Peripheral Nerve Injury Induced by Japanese Encephalitis Virus in C57BL/6 Mouse

Huan Yang et al. J Virol. .

Abstract

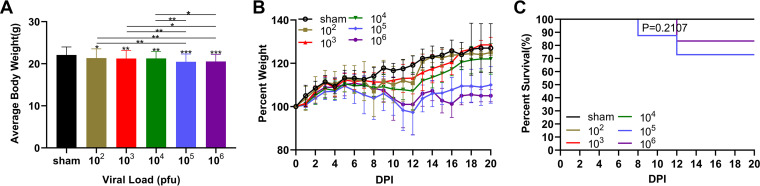
Japanese encephalitis virus (JEV), with neurotoxic and neuroinvasive properties, is the major cause of human viral encephalitis in Asia. Although Guillain-Barré syndrome caused by JEV infections is not frequent, a few cases have been reported in recent years. To date, no existing animal model for JEV-induced peripheral nerve injury (PNI) has been established, and thus the pathogenic mechanism is not clarified. Therefore, an animal model is urgently required to clarify the correlation between JEV infection and PNI. In the present study, we used JEV GIb strain of NX1889 to establish a mouse model of JEV infection. The general neurological signs emerged on day 3 of modeling. The motor function continued to deteriorate, reaching a maximum at 8 to 13 days postinfection (dpi) and gradually recovered after 16 dpi. The injuries of 105 PFU and 106 PFU groups were the most severe. Transmission electron microscopy and immunofluorescence staining showed varying degrees of demyelination and axonal degeneration in the sciatic nerves. The electrophysiological recordings demonstrated the presence of demyelinating peripheral neuropathy with reduced nerve conduction velocity. The decreased amplitudes and the prolonged end latency revealed axonal-type motor neuropathy. Demyelination is predominant in the early stage, followed by axonal injury. The expression level of JEV-E protein and viral RNA was elevated in the injured sciatic nerves, suggesting that it may cause PNI at the early stage. Inflammatory cell infiltration and increased inflammatory cytokines indicated that neuroinflammation is involved in JEV-induced PNI. IMPORTANCE JEV is a neurotropic flavivirus belonging to the Flaviviridae family and causes high mortality and disability rates. It invades the central nervous system and induces acute inflammatory injury and neuronal death. Thus, JEV infection is a major global public health concern. Previously, motor dysfunction was mainly attributed to central nervous system damage. Our knowledge regarding JEV-induced PNI is vague and neglected. Therefore, a laboratory animal model is essential. Herein, we showed that C57BL/6 mice can be used to study JEV-induced PNI through multiple approaches. We also demonstrated that viral loads might be positively correlated with lesion severity. Therefore, inflammation and direct virus infection may be the putative mechanisms underlying JEV-induced PNI. The results of this study laid the foundation for further elucidation of the pathogenesis mechanisms of PNI caused by JEV.

Keywords: C57BL/6 mouse; JEV; PNI; axon; myelin sheath; sciatic nerves.


Conflict of interest statement

The authors declare no conflict of interest.

Figures

FIG 1
FIG 1
Weight loss and survival curves of C57BL/6 mice. (A) Absolute body weight of the different groups (n = 10/group). One-way ANOVA with Bonferroni’s multiple comparison test was used to compare differences among multiple groups. (B) Changes in body weight expressed as a percentage of starting weight for 20 days after the virus challenge. (C) Percentage of survival of each group surviving each day after JEV infection (n = 10/group). In the 105 PFU group, one mouse died at 8 dpi and another died at 12 dpi. In the 106 PFU group, only one mouse died on 12 dpi. Survival curves were compared using log-rank Mantel-Cox curve comparison. Data are expressed as means ± SD. *, P < 0.05; **, P < 0.01; ***, P < 0.001.
FIG 2
FIG 2
Motor deficits in JEV-inoculated mice. (A) The incidence rate of motor deficits of different groups (n = 10). (B) Mean VPS scores of different groups (n = 10). Differences among multiple groups were determined with one-way ANOVA followed with Bonferroni’s multiple comparison test. (C) Mean VPS scores were monitored 20 days after the virus challenge. (D) Mean hanging wire test scores of the different groups (n = 10). Kruskal-Wallis H test was applied for comparing multiple groups. (E) Mean hanging wire test scores were monitored for 20 days after the virus challenge. Data are expressed as means ± SD. *, P < 0.05; **, P < 0.01; ***, P < 0.001.
FIG 3
FIG 3
Viral RNAs in various tissues in the different groups of C57BL/6 mice after JEV infection during disease progression. (A) Serum; (B) brain; (C) sciatic nerve. The viral RNA titers of tissue samples obtained at five time points during infection were measured by RT-qPCR. Each bar represented the mean of three mice in the sham- and virus-infected groups. Two-way ANOVA with Tukey’s multiple comparison test was used (each viral group compared to sham). Asterisks indicated that values are statistically significant (*, P < 0.05; **, P < 0.01; ***, P < 0.001) compared to the results of sham mice.
FIG 4
FIG 4
Sciatic nerve injury of JEV-inoculated mouse measured by electromyography. (A and D) Nerve conduction velocity in different groups. (B and E) Amplitudes in different groups. (C and F) End latency in different groups. (G and J) Nerve conduction velocity on 5, 8, 12, 16, and 20 dpi. (H and K) Amplitudes on 5, 8, 12, 16, and 20 dpi. (I and L) End latency on 5, 8, 12, 16, and 20 dpi. Data are presented as means ± SD. Comparisons among multiple groups were performed using one-way ANOVA followed by Tukey’s multiple comparison test. *, P < 0.05; **, P < 0.01; ***, P < 0.001.
FIG 5
FIG 5
Ultrastructural abnormalities of mouse sciatic nerve after JEV infection detected by TEM. (A) Ultrathin cross sections of different groups (scale bar = 2 μm). (a) Sham group. (b) 102 PFU group. (c) 103 PFU group. (d) 104 PFU group. (e) 105 PFU group. (f) 106 PFU group. (B) Ultrathin cross sections of the sciatic nerves at different time points (scale bar = 500 nm). (g) Sham group. (h) 5 dpi. (i) 8 dpi. (j) 12 dpi. (k) 16 dpi. (l) 20 dpi. MF, myelinated nerve; NMN, unmyelinated nerve; MS, myelin; A, axon; SC, Schwann cell; M, mitochondrial; RER, endoplasmic reticulum; ▴, demyelination.
FIG 6
FIG 6
JEV attached to the mouse sciatic nerve. (A) Immunofluorescence staining of JEV-E protein (red) in different groups. DAPI was used to stain the cell nucleus (blue) (longitudinal section; scale bar = 20 μm). (B) Quantification of mean immunofluorescence intensity of JEV-E protein in different groups (n = 5). Data are presented as means ± SD. One-way ANOVA with Bonferroni’s multiple comparison test was performed to compare differences among multiple groups. *, P < 0.05; **, P < 0.01; ***, P < 0.001.
FIG 7
FIG 7
Axonal degeneration and demyelination appeared after JEV infection. (A) Immunofluorescence staining of MBP (red) and NF-H (green) in different groups. DAPI was used to stain the cell nucleus (blue) (longitudinal section; scale bar = 20 μm). (B) Quantification of mean immunofluorescence intensity of MBP in different groups (n = 3). (C) Quantification of mean immunofluorescence intensity of NF-H in different groups (n = 3). Data are presented as means ± SD. One-way ANOVA with Bonferroni’s multiple comparison test was performed to compare differences among multiple groups. *, P < 0.05; **, P < 0.01; ***, P < 0.001.
FIG 8
FIG 8
JEV-E protein expression in the sciatic nerve. (A) Immunofluorescence staining of JEV-E protein (red) at different time points. DAPI was used to stain the cell nucleus (blue) (longitudinal section; scale bar = 20 μm). (B) Quantification of mean immunofluorescence intensity of JEV-E protein at different time points (n = 3). Data are presented as means ± SD. One-way ANOVA with Bonferroni’s multiple comparison test was performed to compare differences among multiple groups. *, P < 0.05; **, P < 0.01; ***, P < 0.001.
FIG 9
FIG 9
Axonal degeneration and demyelination appeared after JEV infection. (A) Immunofluorescence staining of MBP (red) and NF-H (green) at different time points. DAPI was used to stain the cell nucleus (blue) (longitudinal section; scale bar = 20 μm). (B) Quantification of mean immunofluorescence intensity of MBP at different time points (n = 3). (C) Quantification of mean immunofluorescence intensity of NF-H at different time points (n = 3). Data are presented as means ± SD. One-way ANOVA with Bonferroni’s multiple comparison test was used to compare differences among multiple groups. *, P < 0.05; **, P < 0.01; ***, P < 0.001.
FIG 10
FIG 10
Histopathological changes and expression of inflammatory cytokines in mouse sciatic nerve. (A) Longitudinal section of the sciatic nerve in different groups (HE, 40×). (a) Sham group. (b) 102 PFU group. (c) 103 PFU group. (d) 104 PFU group. (e) 105 PFU group. (f) 106 PFU group. (B) Longitudinal sections of the sciatic nerve at different time points (HE, 40×). (g) Sham group. (h) 5 dpi. (i) 8 dpi. (j) 12 dpi. (k) 16 dpi. (l) 20 dpi. (C) Relative mRNA expression levels of TNF-α. (D) Relative mRNA expression levels of IFN-γ. (E) Relative mRNA expression levels of IL-6. Data are presented as means ± SD. Two-way ANOVA with Bonferroni’s post hoc test was conducted (each viral group compared to sham). *, P < 0.05; **, P < 0.01; ***, P < 0.001.
FIG 11
FIG 11
JEV attached to the mouse brain tissue. (A) Immunofluorescence staining of JEV-E protein (red) in different groups (coronal sections, scale bar = 50 μm). DAPI was used to stain the cell nucleus (blue). (B) Quantification of mean immunofluorescence intensity of JEV-E protein in different groups (n = 3). Data are presented as means ± SD. One-way ANOVA with Bonferroni’s multiple comparison test was performed to compare differences among multiple groups. *, P < 0.05; **, P < 0.01; ***, P < 0.001.
FIG 12
FIG 12
JEV-E protein expression in mouse brain tissue. (A) Immunofluorescent staining of JEV-E protein (red) at different times (coronal sections, scale bar = 50 μm). DAPI was used to stain the cell nucleus (blue). (B) Quantification of mean immunofluorescence intensity of JEV-E protein at different time points (n = 3). Data are presented as means ± SD. One-way ANOVA with Bonferroni’s multiple comparison test was used to compare differences among multiple groups. *, P < 0.05; **, P < 0.01; ***, P < 0.001.
FIG 13
FIG 13
JEV infection caused neuronal cell death by activating the inflammatory response. (A) Histopathological changes in different groups (HE, scale bar = 50 μm). (a) Sham group. (b) 102 PFU group. (c) 103 PFU group. (d) 104 PFU group. (e) 105 PFU group. (f) 106 PFU group. (B) Histopathological changes at different time points (HE, scale bar = 20 μm). (g) Sham group. (h) 5 dpi. (i) 8 dpi. (j) 12 dpi. (k) 16 dpi. (l) 20 dpi. Perivascular lymphocytic cuffing, neuronal necrosis, a glial nodule, and inflammatory cell infiltration were detected in the brain tissue. (C) Relative mRNA expression levels of TNF-α. (D) Relative mRNA expression levels of IFN-γ. (E) Relative mRNA expression levels of IL-6. Data were presented as means ± SD. Statistical difference was determined by two-way ANOVA with Tukey’s test (each viral group compared to sham). *, P < 0.05; **, P < 0.01; ***, P < 0.001.

References

    1. Liu C, Zhang Y, Li Z, Hou J, Zhou J, Kan L, Zhou B, Chen P. 2017. Rab5 and Rab11 are required for clathrin-dependent endocytosis of Japanese encephalitis virus in BHK-21 cells. J Virol 91:e01113-17. doi:10.1128/JVI.01113-17. - DOI - PMC - PubMed
    1. Li F, Wang Y, Yu L, Cao S, Wang K, Yuan J, Wang C, Wang K, Cui M, Fu ZF. 2015. Viral infection of the central nervous system and neuroinflammation precede blood-brain barrier disruption during Japanese encephalitis virus infection. J Virol 89:5602–5614. doi:10.1128/JVI.00143-15. - DOI - PMC - PubMed
    1. Liu W, Fu S, Ma X, Chen X, Wu D, Zhou L, Yin Q, Li F, He Y, Lei W, Li Y, Xu S, Wang H, Wang Z, Wang H, Yu H, Liang G. 2020. An outbreak of Japanese encephalitis caused by genotype Ib Japanese encephalitis virus in China, 2018: a laboratory and field investigation. PLoS Negl Trop Dis 14:e0008312. doi:10.1371/journal.pntd.0008312. - DOI - PMC - PubMed
    1. Turtle L, Solomon T. 2018. Japanese encephalitis - the prospects for new treatments. Nat Rev Neurol 14:298–313. doi:10.1038/nrneurol.2018.30. - DOI - PubMed
    1. Wang H, Liang G. 2015. Epidemiology of Japanese encephalitis: past, present, and future prospects. Ther Clin Risk Manag 11:435–448. doi:10.2147/TCRM.S51168. - DOI - PMC - PubMed

Publication types