

Machine learning for optical chemical multi-analyte imaging : Why we should dare and why it's not without risks
- PMID: 37071140
- PMCID: PMC10185573
- DOI: 10.1007/s00216-023-04678-8
Machine learning for optical chemical multi-analyte imaging : Why we should dare and why it's not without risks
Abstract
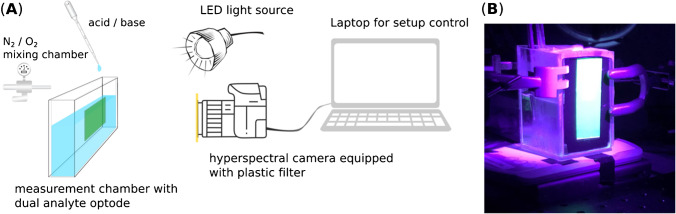
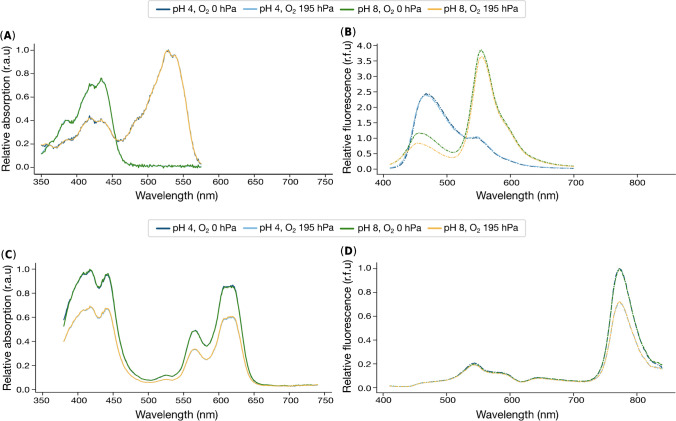
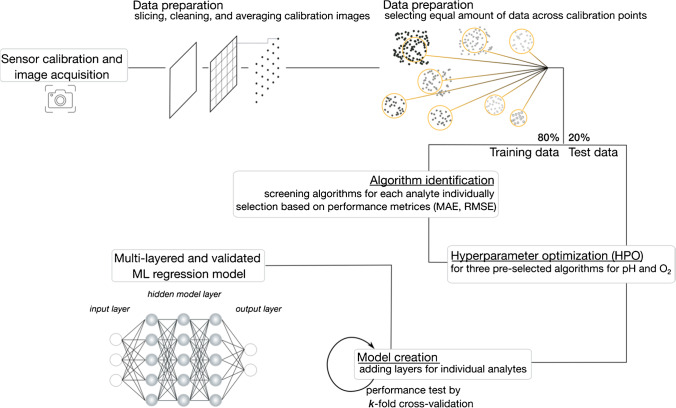
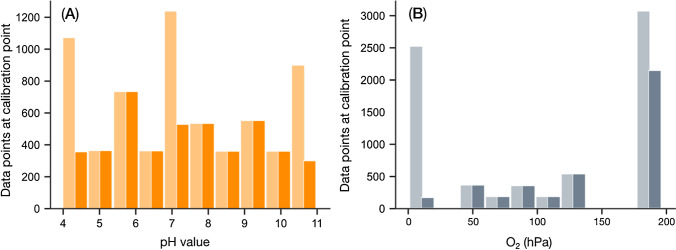
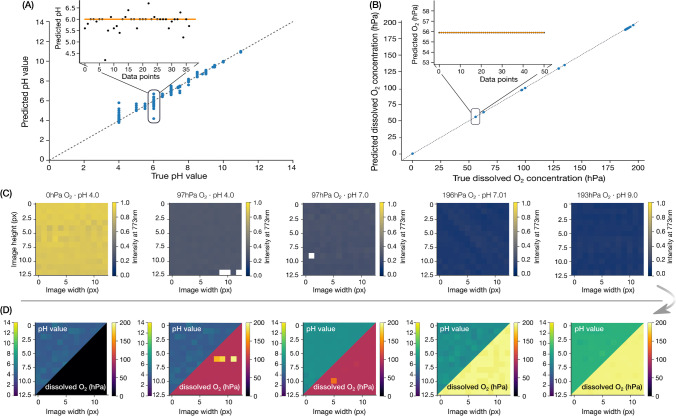
Simultaneous sensing of metabolic analytes such as pH and O2 is critical in complex and heterogeneous biological environments where analytes often are interrelated. However, measuring all target analytes at the same time and position is often challenging. A major challenge preventing further progress occurs when sensor signals cannot be directly correlated to analyte concentrations due to additional effects, overshadowing and complicating the actual correlations. In fields related to optical sensing, machine learning has already shown its potential to overcome these challenges by solving nested and multidimensional correlations. Hence, we want to apply machine learning models to fluorescence-based optical chemical sensors to facilitate simultaneous imaging of multiple analytes in 2D. We present a proof-of-concept approach for simultaneous imaging of pH and dissolved O2 using an optical chemical sensor, a hyperspectral camera for image acquisition, and a multi-layered machine learning model based on a decision tree algorithm (XGBoost) for data analysis. Our model predicts dissolved O2 and pH with a mean absolute error of < 4.50·10-2 and < 1.96·10-1, respectively, and a root mean square error of < 2.12·10-1 and < 4.42·10-1, respectively. Besides the model-building process, we discuss the potentials of machine learning for optical chemical sensing, especially regarding multi-analyte imaging, and highlight risks of bias that can arise in machine learning-based data analysis.
Keywords: Decision tree algorithm; Dissolved oxygen; Intensity-based sensing; Supervised pattern recognition; XGBoost; pH.
© 2023. The Author(s).
Conflict of interest statement
The authors declare no competing interests.
Figures

Similar articles
-
Hyperspectral Luminescence Imaging in Combination with Signal Deconvolution Enables Reliable Multi-Indicator-Based Chemical Sensing.ACS Sens. 2021 Jan 22;6(1):183-191. doi: 10.1021/acssensors.0c02084. Epub 2020 Dec 18. ACS Sens. 2021. PMID: 33337140
-
Optode Based Chemical Imaging-Possibilities, Challenges, and New Avenues in Multidimensional Optical Sensing.ACS Sens. 2021 May 28;6(5):1671-1680. doi: 10.1021/acssensors.1c00480. Epub 2021 Apr 27. ACS Sens. 2021. PMID: 33905234
-
Machine Learning-Assisted Array-Based Biomolecular Sensing Using Surface-Functionalized Carbon Dots.ACS Sens. 2019 Oct 25;4(10):2730-2737. doi: 10.1021/acssensors.9b01227. Epub 2019 Oct 11. ACS Sens. 2019. PMID: 31529960
-
Multi-analyte sensing strategies towards wearable and intelligent devices.Chem Sci. 2022 Sep 24;13(42):12309-12325. doi: 10.1039/d2sc03750e. eCollection 2022 Nov 2. Chem Sci. 2022. PMID: 36382296 Free PMC article. Review.
-
Luminescent sensing and imaging of oxygen: fierce competition to the Clark electrode.Bioessays. 2015 Aug;37(8):921-8. doi: 10.1002/bies.201500002. Epub 2015 Jun 25. Bioessays. 2015. PMID: 26113255 Free PMC article. Review.
Cited by
-
Optimization and Multimachine Learning Algorithms to Predict Nanometal Surface Area Transfer Parameters for Gold and Silver Nanoparticles.Nanomaterials (Basel). 2024 Oct 30;14(21):1741. doi: 10.3390/nano14211741. Nanomaterials (Basel). 2024. PMID: 39513822 Free PMC article.
-
Simultaneous Imaging of Temperature and Oxygen by Utilizing Thermally Activated Delayed Fluorescence and Phosphorescence of a Single Indicator.ACS Meas Sci Au. 2024 Sep 5;4(5):568-576. doi: 10.1021/acsmeasuresciau.4c00040. eCollection 2024 Oct 16. ACS Meas Sci Au. 2024. PMID: 39430963 Free PMC article.
-
Analytical and bioanalytical chemistry for digital diagnostics in digital healthcare.Anal Bioanal Chem. 2024 Nov;416(28):6161-6163. doi: 10.1007/s00216-024-05512-5. Epub 2024 Aug 31. Anal Bioanal Chem. 2024. PMID: 39214898 No abstract available.
-
Multiparameter Sensing of Oxygen and pH at Biological Interfaces via Hyperspectral Imaging of Luminescent Sensor Nanoparticles.ACS Sens. 2024 Apr 26;9(4):1763-1774. doi: 10.1021/acssensors.3c01941. Epub 2024 Apr 12. ACS Sens. 2024. PMID: 38607997 Free PMC article.
References
-
- Rodriguez-Mozaz S, Reder S, de Alda ML, Gauglitz G, Barcelo D. Simultaneous multi-analyte determination of estrone, isoproturon and atrazine in natural waters by the RIver ANAlyser (RIANA), an optical immunosensor. Biosens Bioelectron. 2004;19(7):633–640. doi: 10.1016/S0956-5663(03)00255-0. - DOI - PubMed
-
- Mendoza EA, Robinson D, Lieberman RA. Miniaturized integrated optic chemical sensors for environmental monitoring and remediation. Chem Biochem Environ Fiber Sens VIII. 2836: SPIE; 1996. p. 76–86.
-
- Kortzinger A, Schimanski J, Send U. High quality oxygen measurements from profiling floats: a promising new technique. JTECH. 2005;22(3):302–308.
Grants and funding
LinkOut - more resources
Full Text Sources
