. 2023 Jun;69(2-3):175-188.
doi: 10.1007/s00294-023-01267-1. Epub 2023 Apr 18.

The N-terminal disordered region of ChsB regulates its efficient transport to the hyphal apical surface in Aspergillus nidulans

Affiliations

The N-terminal disordered region of ChsB regulates its efficient transport to the hyphal apical surface in Aspergillus nidulans

Jingyun Jin et al. Curr Genet. 2023 Jun.

Abstract

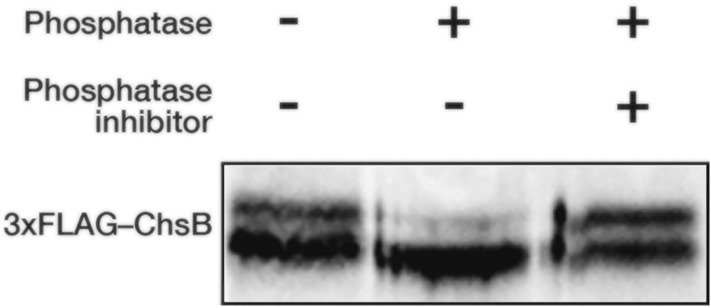
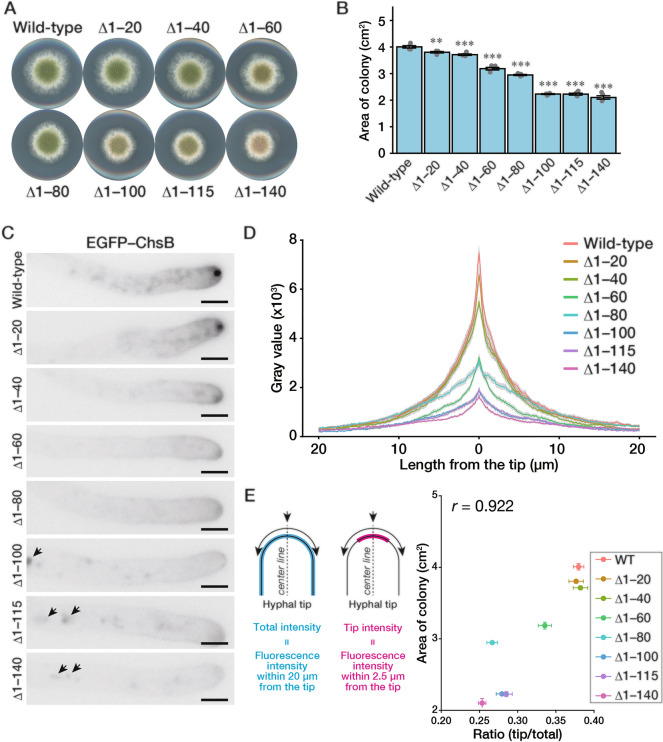
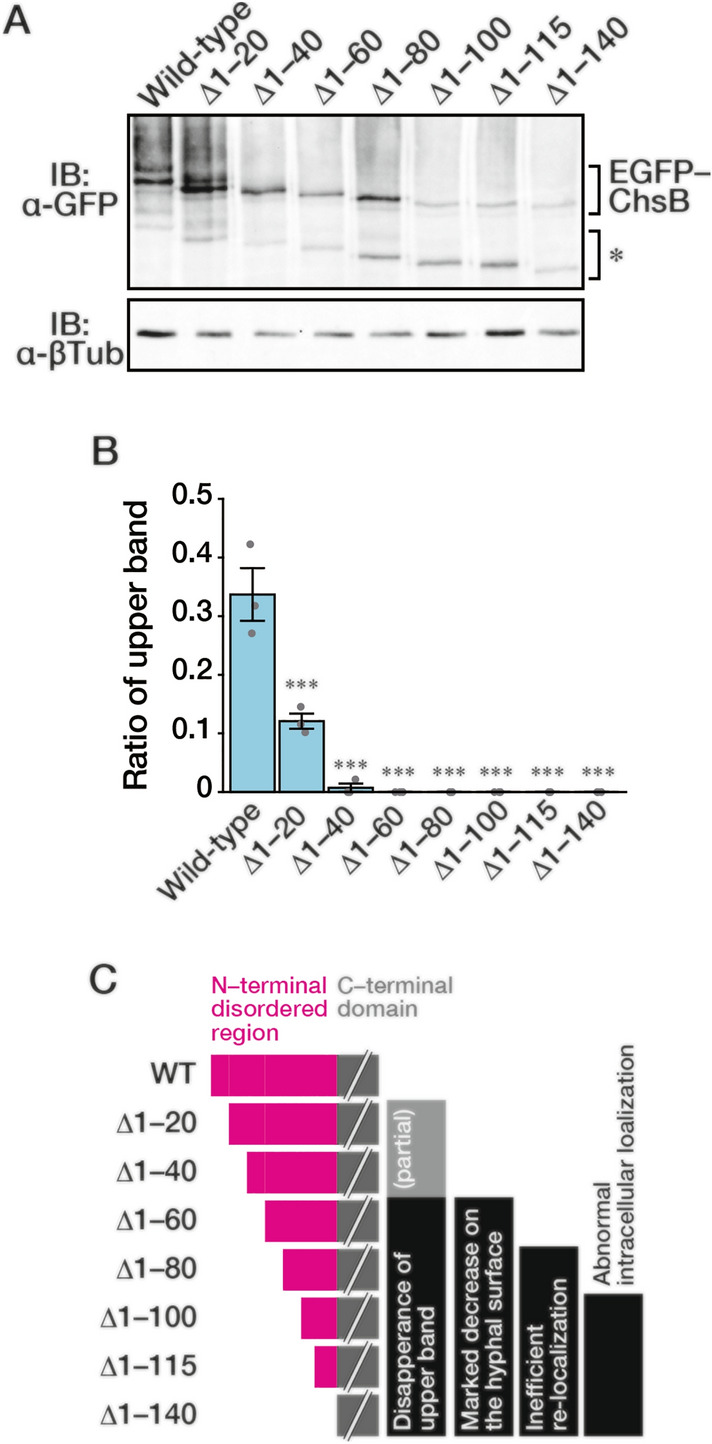
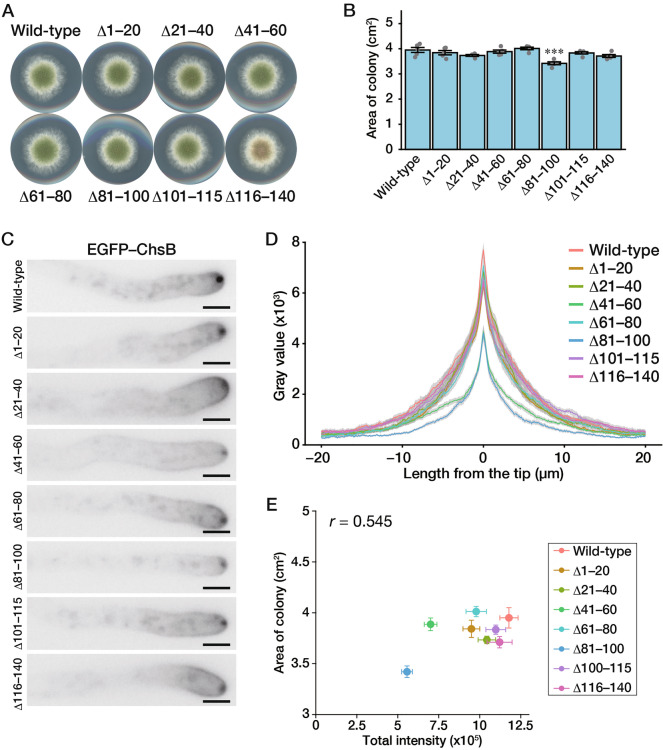
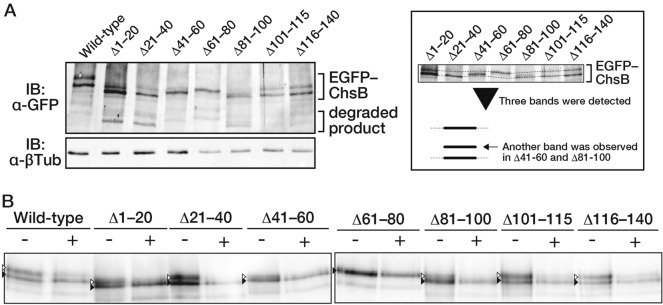
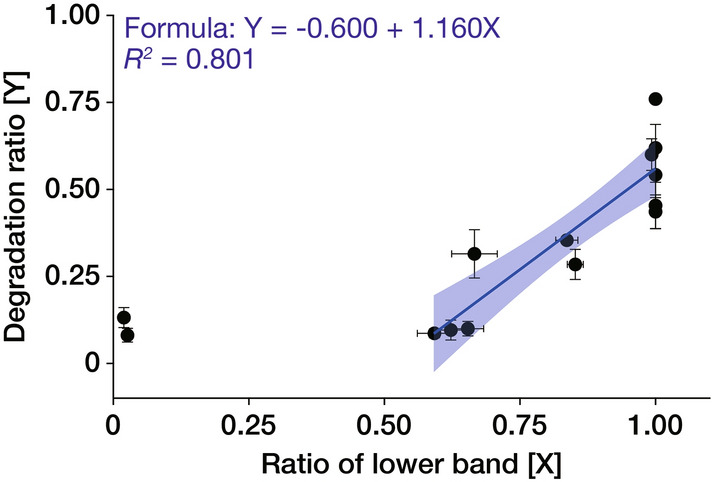
In fungi, the cell wall plays a crucial role in morphogenesis and response to stress from the external environment. Chitin is one of the main cell wall components in many filamentous fungi. In Aspergillus nidulans, a class III chitin synthase ChsB plays a pivotal role in hyphal extension and morphogenesis. However, little is known about post-translational modifications of ChsB and their functional impacts. In this study, we showed that ChsB is phosphorylated in vivo. We characterized strains that produce ChsB using stepwise truncations of its N-terminal disordered region or deletions of some residues in that region and demonstrated its involvement in ChsB abundance on the hyphal apical surface and in hyphal tip localization. Furthermore, we showed that some deletions in this region affected the phosphorylation states of ChsB, raising the possibility that these states are important for the localization of ChsB to the hyphal surface and the growth of A. nidulans. Our findings indicate that ChsB transport is regulated by its N-terminal disordered region.

Keywords: Aspergillus nidulans; Chitin synthase; ChsB; Intrinsically disordered region; Phosphorylation.


Conflict of interest statement

The authors declare that they have no conflicts of interest with the contents of this article.

Figures

Fig. 1
Fig. 1
ChsB extracted from mycelia was phosphorylated. 2.0 × 107 conidia of the 3xFLAG–ChsB producing strain were spread onto MMGpuu plate and incubated for 22 h at 30 °C, after which the mycelia were collected from approximately 1 cm margins of colonies. Total cell lysates were prepared from the mycelia and 3xFLAG–ChsB proteins were purified using magnetic beads conjugated with anti-FLAG antibodies. Purified proteins treated with or without a phosphatase and/or phosphatase inhibitors were subjected to immunoblot analysis using anti-FLAG antibodies
Fig. 2
Fig. 2
Truncation of the N-terminal disordered region perturbs ChsB localization to the hyphal apical surface. A 1.0 × 103 conidia of the GPChBP (Wild-type), GPChBΔ1–20 (Δ1–20), GPChBΔ1–40 (Δ1–40), GPChBΔ1–60 (Δ1–60), GPChBΔ1–80 (Δ1–80), GPChBΔ1–100 (Δ1–100), GPChBΔ1–115 (Δ1–115), and GPChBΔ1–140 (Δ1–140) strains were inoculated onto MMGpuu plates and incubated for 72 h at 30 °C. B Colony areas of the strains described in (A) were measured. Bars indicate the mean of five independent experiments, and dots indicate raw data. Error bars represent S.E. Significant differences compared to the wild-type are indicated as asterisks (**P < 0.01; ***P < 0.001; Dunnett’s test). C 5.0 × 104 conidia of the strains described in (A) were inoculated onto MMGpuu plates and incubated for 22 h at 30 °C, after which hyphae were observed using a fluorescence microscope. Arrows, abnormal intracellular foci. Bars: 5 μm. D The fluorescence intensities in (C) along their hyphal surfaces were measured. Lines indicate the average of the intensities, and gray regions indicate S.E. The number of measured hyphae is 24 (Wild-type), 24 (Δ1–20), 23 (Δ1–40), 21 (Δ1–60), 21 (Δ1–80), 24 (Δ1–100), 25 (Δ1–115), and 23 (Δ1–140). E The fluorescence intensities in (D) within 20 µm (total intensity) or 2.5 µm (tip intensity) from the hyphal tips (0 μm) were calculated. Then the ratio of tip intensity to total intensity was calculated. The calculated ratio and colony area in (B) were plotted; dots indicate the mean and error bars represent S.E.
Fig. 3
Fig. 3
Truncation of the N-terminal disordered region diminishes the phosphorylated ChsB. A 2.0 × 107 conidia of the GPChBP (Wild-type), GPChBΔ1–20 (Δ1–20), GPChBΔ1–40 (Δ1–40), GPChBΔ1–60 (Δ1–60), GPChBΔ1–80 (Δ1–80), GPChBΔ1–100 (Δ1–100), GPChBΔ1–115 (Δ1–115), and GPChBΔ1–140 (Δ1–140) strains were spread onto MMGpuu plates and incubated for 22 h at 30 °C, after which the mycelia were collected from approximately 1 cm margins of colonies. Total cell lysates were prepared from the mycelia and subjected to immunoblot analysis using anti-GFP (α-GFP) and anti-β-tubulin (α-βTub) antibodies. An asterisk indicates the bands derived from degraded products. B Signal intensities of the upper and lower bands of EGFP–ChsB were measured, and the ratio of the upper band intensity to total intensity was calculated. Bars indicate the mean of three independent experiments, and dots indicate raw data. Error bars represent S.E. Significant differences compared to the wild-type are indicated as asterisks (***P < 0.001; Dunnett’s test). C Summary of the results of the truncation mutants (see main text)
Fig. 4
Fig. 4
Deletion of amino acids 41–60 or 81–100 reduces ChsB localization at the hyphal apical surface. A 1.0 × 103 conidia of the GPChBP (Wild-type), GPChBΔ1–20 (Δ1–20), GPChBΔ21–40 (Δ21–40), GPChBΔ41–60 (Δ41–60), GPChBΔ61–80 (Δ61–80), GPChBΔ81–100 (Δ81–100), GPChBΔ100–115 (Δ100–115), and GPChBΔ115–140 (Δ115–140) strains were inoculated onto MMGpuu plates and incubated for 72 h at 30 °C. B Colony areas of the strains described in (A) were measured. Bars indicate the mean of five independent experiments, and dots indicate raw data. Error bars represent S.E. Significant differences compared to the wild-type are indicated asterisks (***P < 0.001; Dunnett’s test). C 5.0 × 104 conidia of the strains described in (A) were inoculated onto MMGpuu plates and incubated for 22 h at 30 °C, after which hyphae were observed using a fluorescence microscope. Bars: 5 μm. D The fluorescence intensities in (C) along their hyphal surfaces were measured. Lines indicate the average of the intensities, and gray regions indicate S.E. The number of measured hyphae is 23 (Wild-type), 26 (Δ1–20), 19 (Δ21–40), 23 (Δ41–60), 23 (Δ61–80), 25 (Δ81–100), 23 (Δ101–115), and 23 (Δ116–140). E The fluorescence intensities in (D) within 20 µm from the hyphal tips (0 μm) were calculated, and then the intensity and colony area in (B) were plotted; dots indicate the mean and error bars represent S.E.
Fig. 5
Fig. 5
Amino acid deletions of the N-terminal region alter the phosphorylation state of ChsB. A (Left) 2.0 × 107 conidia of the GPChBP (Wild-type), GPChBΔ1–20 (Δ1–20), GPChBΔ21–40 (Δ21–40), GPChBΔ41–60 (Δ41–60), GPChBΔ61–80 (Δ61–80), GPChBΔ81–100 (Δ81–100), GPChBΔ100–115 (Δ100–115), and GPChBΔ115–140 (Δ115–140) strains were spread onto MMGpuu plates and incubated for 22 h at 30 °C, after which the mycelia were collected from approximately 1 cm margins of colonies. Total cell lysates were prepared from the mycelia and subjected to immunoblot analysis using anti-GFP (α-GFP) and anti-β-tubulin (α-βTub) antibodies. (Right) The trimmed view around EGFP–ChsB. B EGFP–ChsBs were purified using GFP-trap from total cell lysates described in (A). Purified proteins treated with ( +) or without ( −) a phosphatase were subjected to immunoblot analysis using anti-GFP antibodies. White arrowheads indicate the detected bands that were decreased with the phosphatase treatment, while black arrowheads indicate the bands that were not changed with the phosphatase treatment. Under the phosphatase-treated condition, 10 µL of elution fraction was loaded; in the phosphatase-free condition, 30 µL of elution fraction was loaded
Fig. 6
Fig. 6
Ratio of the lower band of ChsB is correlated with its stability. Ratios of the amounts of degraded products to the total EGFP–ChsBs were calculated from immunoblot analysis in Fig. 3A and 5A. Then, the degradation ratios and the ratios of the lower bands of the total EGFP–ChsBs were plotted

Similar articles

References

    1. Albuquerque CP, Smolka MB, Payne SH, et al. A multidimensional chromatography technology for in-depth phosphoproteome analysis. Mol Cell Proteom. 2008;7:1389–1396. doi: 10.1074/mcp.M700468-MCP200. - DOI - PMC - PubMed
    1. Blom N, Gammeltoft S, Brunak S. Sequence and structure-based prediction of eukaryotic protein phosphorylation sites. J Mol Biol. 1999;294:1351–1362. doi: 10.1006/jmbi.1999.3310. - DOI - PubMed
    1. Blom N, Sicheritz-Pontén T, Gupta R, et al. Prediction of post-translational glycosylation and phosphorylation of proteins from the amino acid sequence. Proteomics. 2004;4:1633–1649. doi: 10.1002/pmic.200300771. - DOI - PubMed
    1. Borgia PT, Iartchouk N, Riggle PJ, et al. The chsB gene of Aspergillus nidulans is necessary for normal hyphal growth and development. Fungal Genet Biol. 1996;20:193–203. doi: 10.1006/fgbi.1996.0035. - DOI - PubMed
    1. Chen W, Cao P, Liu Y, et al. Structural basis for directional chitin biosynthesis. Nature. 2022;610:402–408. doi: 10.1038/s41586-022-05244-5. - DOI - PMC - PubMed

LinkOut - more resources