. 2023 Apr 18;136(5):113.
doi: 10.1007/s00122-023-04345-7.

Transgressive and parental dominant gene expression and cytosine methylation during seed development in Brassica napus hybrids

Affiliations

Transgressive and parental dominant gene expression and cytosine methylation during seed development in Brassica napus hybrids

Mauricio Orantes-Bonilla et al. Theor Appl Genet. .

Abstract

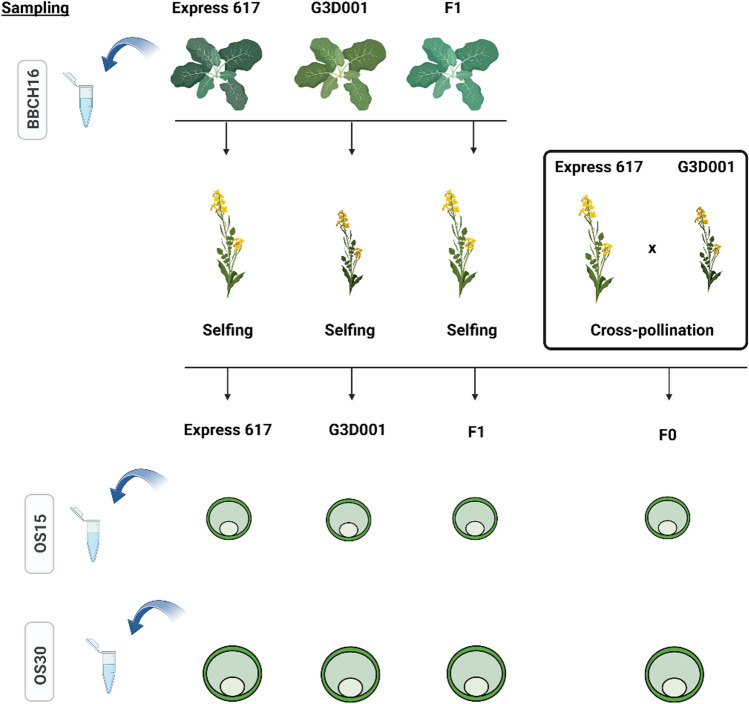
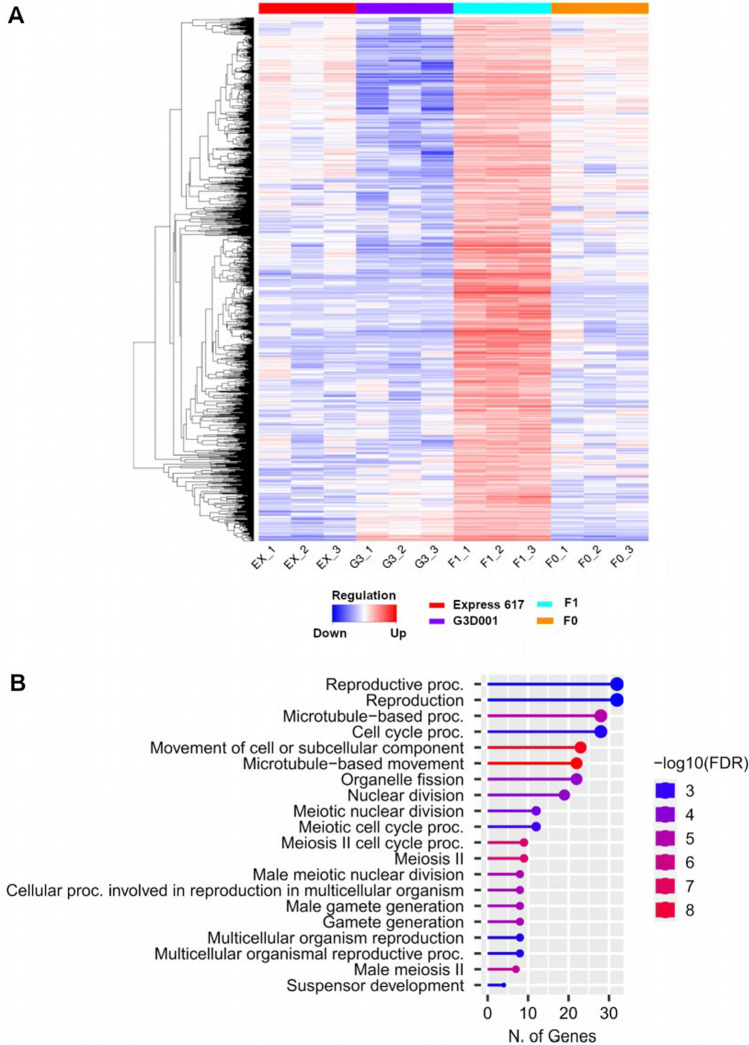
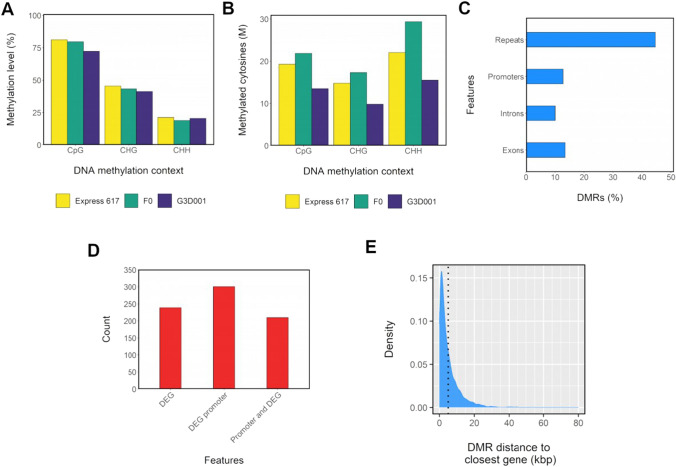
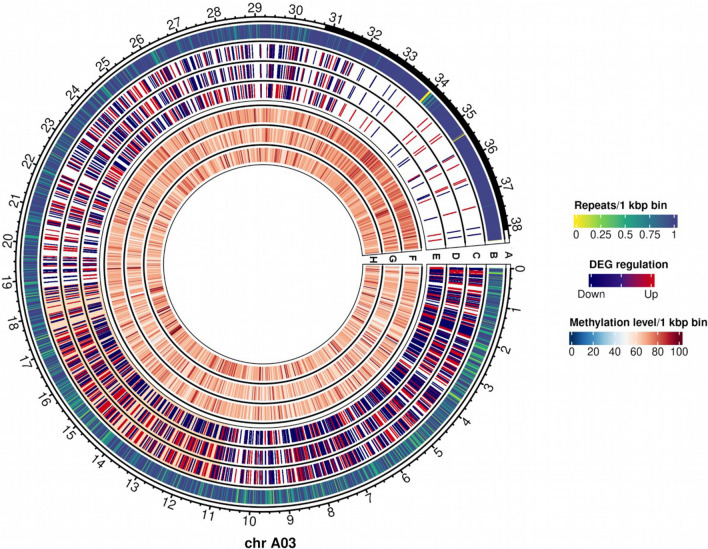
Transcriptomic and epigenomic profiling of gene expression and small RNAs during seed and seedling development reveals expression and methylation dominance levels with implications on early stage heterosis in oilseed rape. The enhanced performance of hybrids through heterosis remains a key aspect in plant breeding; however, the underlying mechanisms are still not fully elucidated. To investigate the potential role of transcriptomic and epigenomic patterns in early expression of hybrid vigor, we investigated gene expression, small RNA abundance and genome-wide methylation in hybrids from two distant Brassica napus ecotypes during seed and seedling developmental stages using next-generation sequencing. A total of 31117, 344, 36229 and 7399 differentially expressed genes, microRNAs, small interfering RNAs and differentially methylated regions were identified, respectively. Approximately 70% of the differentially expressed or methylated features displayed parental dominance levels where the hybrid followed the same patterns as the parents. Via gene ontology enrichment and microRNA-target association analyses during seed development, we found copies of reproductive, developmental and meiotic genes with transgressive and paternal dominance patterns. Interestingly, maternal dominance was more prominent in hypermethylated and downregulated features during seed formation, contrasting to the general maternal gamete demethylation reported during gametogenesis in angiosperms. Associations between methylation and gene expression allowed identification of putative epialleles with diverse pivotal biological functions during seed formation. Furthermore, most differentially methylated regions, differentially expressed siRNAs and transposable elements were in regions that flanked genes without differential expression. This suggests that differential expression and methylation of epigenomic features may help maintain expression of pivotal genes in a hybrid context. Differential expression and methylation patterns during seed formation in an F1 hybrid provide novel insights into genes and mechanisms with potential roles in early heterosis.


Conflict of interest statement

The authors have no relevant financial or non-financial interests to disclose.

Figures

Fig. 1
Fig. 1
Transcriptomic and epigenomic experimental design. Leaves samples were taken at the six-leaves stages (BBCH16) from each biological replicate. Homozygous inbred plants of Express 617 and G3D001 along with their heterozygous F1 hybrid were self-pollinated to generate selfed ovules from each genotype. The two inbreed parents were also crossed during the experiment to develop cross-pollinated ovules (F0). Pollinated ovules were sampled from each biological replicate and sequenced at 15 (OS15) and 30 (OS30) days after pollination
Fig. 2
Fig. 2
Percentages of differentially expressed genes (DEGs), differentially expressed miRNAs (DE-miRNAS), differentially expressed siRNAs (DE-siRNAS) and differentially methylated regions (DMRs) in CpG and CHG methylation contexts by expression level dominance (ELD) and methylation level dominance (MLD) patterns per stage. Increase and decrease in expression and methylation per patterrn are displayed by the dot-ended lines showing the relative expression or methylation levels for the parental genotypes Express 617 (E) and G3D001 (G) along with their F1 hybrid (F). Differential expression and methylation are displayed for leaf samples at stage BBCH16 and for ovules at 15 (OS15) and 30 (OS30) days after pollination by selfing (F1 ovules) or cross-pollination between the two parental lines (F0 ovules). Percentages are displayed with colored backgrounds to represent high (red) or low (blue) abundance
Fig. 3
Fig. 3
Percentage of shared differential features between stages based on dominance level patterns displaying differentially expressed genes (DEGs), differentially expressed miRNAs (DE-miRNAs), differentially expressed siRNAs (DE-siRNAs) and differentially methylated regions (DMRs) in CpG and CHG contexts
Fig. 4
Fig. 4
(a) Gene expression heatmap and (b) gene ontology (GO) enrichment of biological processes from 15 days after pollination ovules with transgressive upregulation patterns in the F1
Fig. 5
Fig. 5
Phenotypes for field-grown plants of inbred B. napus parents G3D001, Express 617 and their F1 hybrid showing (a) plant architecture, (b) plant height and (c) dry seed weight during an experimental trial in Wuhan, Central China. Biological replicate averages and standard deviations are shown in (b) and (c) for plant height and dry seed weight, and genotypes showing significant differences (p < 0.05) detected by Tukey tests are indicated with letters above the bars
Fig. 6
Fig. 6
Normalized expression levels from selected differentially expressed miRNAs (DE-miRNA) and their respective differentially expressed target genes (DEG) in ovules 30 days after pollination in the F1 and parental genotypes, respectively. (a) Inversely proportional miRNA-mRNA target expression of miRNA 169A and a B. napus ortholog of its target gene EMB2016 on chromosome A03 (A03p029900.3_BnaEXP). (b) Proportional miRNA-mRNA target expression of miRNA 3629A and a B. napus ortholog of its target gene EMB2204 on chromosome A03 (A02p005120.1_BnaEXP)
Fig. 7
Fig. 7
Methylation patterns in 15 days after pollination ovules from F0 and parents. (a) Methylation level per genotype and DNA methylation context. (b) Count of methylated cytosines in million (M) scale per genotype and DNA methylation context. (c) Distribution of differentially methylated regions (DMRs) across introns, exons, repeats and promoters (1 kbp upstream from gene start). (d) Distribution of methylated differential expressed genes (DEGs) and their promoters. (e) Kernel density estimation (KED)-based distribution of DMRs distance to closest gene. A dotted line is used to delimit DMRs located 5 kbp from a gene
Fig. 8
Fig. 8
Gene expression and gene body and promoter methylation in CpG and CHG contexts from 15 days after pollination ovules displaying transgressive patterns in the F0 and its parents. Genes are sorted in the same order in both heatmaps
Fig. 9
Fig. 9
Differentially expressed genes (DEGs) and methylation levels from 15 days after pollination ovules from F0 and parents in chromosome A03. Outer to inner tracks correspond to: (a) Predicted centromere positions in black; (b) Repeat density per 1 kbp bin; (ce) DEG regulation in (c) Express 617, (d) F0 and (e) G3D001; (SSfh): Methylation levels per 1 kbp bin in (f) Express 617, (g) F0 and (h) G3D001. A differentially expressed chromosome segment between around 11 Mbp and 18.8 Mbp is highlighted in orange in tracks ce

Similar articles

Cited by

References

    1. Alonso-Peral MM, Trigueros M, Sherman B, Ying H, Taylor JM, Peacock WJ, et al. Patterns of gene expression in developing embryos of Arabidopsis hybrids. Plant J. 2017;89:927–939. doi: 10.1111/tpj.13432. - DOI - PubMed
    1. Altschul SF, Gish W, Miller W, Myers EW, Lipman DJ. Basic local alignment search tool. J Mol Biol. 1990;215:403–410. doi: 10.1016/S0022-2836(05)80360-2. - DOI - PubMed
    1. Andrews, S. (2010). FastQC: A quality control tool for high throughput sequence data. https://www.bioinformatics.babraham.ac.uk/projects/fastqc. Accessed 2021
    1. Arechederra M, Daian F, Yim A, Bazai SK, Richelme S, Dono R, et al. Hypermethylation of gene body CpG islands predicts high dosage of functional oncogenes in liver cancer. Nat Commun. 2018;9:3164. doi: 10.1038/s41467-018-05550-5. - DOI - PMC - PubMed
    1. Ashikawa I. Gene-associated CpG islands in plants as revealed by analyses of genomic sequences. Plant J. 2001;26:617–625. doi: 10.1046/j.1365-313x.2001.01062.x. - DOI - PubMed