. 2023 Jun 5;222(6):e202212117.
doi: 10.1083/jcb.202212117. Epub 2023 Apr 18.

Cellulose synthase-like D movement in the plasma membrane requires enzymatic activity

Affiliations

Cellulose synthase-like D movement in the plasma membrane requires enzymatic activity

Shu-Zon Wu et al. J Cell Biol. .

Abstract

Cellulose Synthase-Like D (CSLD) proteins, important for tip growth and cell division, are known to generate β-1,4-glucan. However, whether they are propelled in the membrane as the glucan chains they produce assemble into microfibrils is unknown. To address this, we endogenously tagged all eight CSLDs in Physcomitrium patens and discovered that they all localize to the apex of tip-growing cells and to the cell plate during cytokinesis. Actin is required to target CSLD to cell tips concomitant with cell expansion, but not to cell plates, which depend on actin and CSLD for structural support. Like Cellulose Synthase (CESA), CSLD requires catalytic activity to move in the plasma membrane. We discovered that CSLD moves significantly faster, with shorter duration and less linear trajectories than CESA. In contrast to CESA, CSLD movement was insensitive to the cellulose synthesis inhibitor isoxaben, suggesting that CSLD and CESA function within different complexes possibly producing structurally distinct cellulose microfibrils.


Conflict of interest statement

Disclosures: The authors declare no competing interests exist.

Figures

Figure 1.
Figure 1.
Maximum likelihood cladogram of CSLD sequences from selected land plant species rooted with green algal CSLD sequences. The CSLD families of mosses, lycophytes, liverworts, and charophyte green algae diversified independently. Angiosperm CSLDs group by demonstrated function (filled circles) and expression (open circles) with sequences from other species. Nodes are labeled with bootstrap values (1,000 replicates). Species include Physcomitrium patens (Pp; Phytozome locus IDs; Roberts and Bushoven, 2007), Coleochaete orbicularis (KF; GenBank IDs; Mikkelsen et al., 2014), Selaginella moellendorffi (Smo; Phytozome protein IDs; Harholt et al., 2012), Marchantia polymorpha (Mapoly; Phytozome; identified by BLAST), Picea abies (MA; Phytozome protein IDs; Yin et al., 2014), Arabidopisis thaliana (AT; locus IDs; Richmond and Somerville, 2000), Populus trichocarpa (Potri; Phytozome protein IDs; Yin et al., 2014), Gossypium raimondii (Gorai; Phytozome protein IDs; Li et al., 2017), Zea mays (GRMZM; Phytozome protein IDs; Yin et al., 2014) and Oryza sativa (Os; locus IDs; Yin et al., 2014). References documenting function and expression (lower case letters) are as follows: aBernal et al., 2008; bWang et al., 2011; cPeng et al., 2019; dMoon et al., 2018; eHu et al., 2018; fQi et al., 2013; gFavery et al., 2001; hWang et al., 2001; iPark et al., 2011; jYoo et al., 2012; kYang et al., 2016; lPenning et al., 2009; mLi et al., 2009; nKim et al., 2007; oBernal et al., 2007; pZhu et al., 2010; qYin et al., 2011; rSamuga and Joshi, 2004; sHunter et al., 2012; tHu et al., 2010; uWu et al., 2010; vLuan et al., 2011; wYoshikawa et al., 2013; xLi et al., 2016.
Figure S1.
Figure S1.
Synteny, expression analysis and CSLD alignment. (A) Synteny analysis of CSLD diversification based on the chromosome-scale assembly of the P. patens genome (Lang et al., 2018) shows that CSLD2 and CSLD6 are close paralogs. The eight P. patens CSLDs reside on chromosomes descended from two of the seven chromosomes proposed to have existed before the first of two whole genome duplications (WGD). CSLD2 and 6 diverged from a common ancestor in WGD1. Following WGD2 paralogs of CSLD6 and CSLD2 were lost from chromosomes 5 and 16, respectively. Duplication of the chromosome carrying the common ancestor of CSD1, 3, 4, 5, 7 and 8 in WGD1 was followed by a fusion affecting the common ancestor of chromosomes 1 and 2, which both carry two CSLDs as tandem repeats. The tandem duplication may have occurred after WDG2 on the common ancestor of chromosomes 1 and 2 or before WGD1 followed by loss of one duplicate from the common ancestor of chromosomes 14 and 10/17. There is no evidence of loss following WGD2. Intron structure is most parsimoniously explained by intron loss. CSLD2 and 6 have three introns, the second of which is shared with P. patens CESAs (Roberts and Bushoven, 2007). This intron two is present in CSLD3 and 7, but not CSLD1, 4, 5, and 8 (indicated in red). Gain of intron two in CSLD2, 3, 6, and 7 is unlikely given that it is homologous with an intron in P. patens CESAs. It is possible that intron 2 was lost before WGD2 in the common ancestor of CSLD5 and 8 and lost independently in the common ancestor of CSLD1 and 4 before WGD2, but after tandem duplication of the common ancestor of CSLD1, 3, 4, and 7. Alternatively, tandem duplication and loss of intron two in the common ancestor of CSLD1, 4, 5, and 8 may have occurred before WGD1 with loss of the paralog of the CSLD3 and 7 common ancestor occurring before WGD2. (B) Transcriptional profile of P. patens CSLDs at different developmental stages using a NimbleGene custom microarray (Ortiz-Ramírez et al., 2016) accessed from PEATmoss (Fernandez-Pozo et al., 2020). CSLD2 and CSLD6 had higher expression in gametophores and sporophytes compared to protonemal tissues (chloronema and caulonema). In contrast, the other six P. patens CSLDs were more highly expressed in protonemal tissues and had low expression in gametophores. Results from transcriptional profiling of P. patens developmental stages using a CombiMatrix array (Hiss et al., 2014; Wolf et al., 2010) or RNA-seq (Perroud et al., 2018) were generally consistent, although CSLD2 transcripts were not detected in the RNA-seq analysis. (C) Sequence alignment of PpCESA10 and PpCSLD with Zn-binding domain (blue), transmembrane helices (gray), plant conserved region (aqua), class-specific region (pink), interfacial helix (orange), and conserved D, D, D, QxxRW motifs (red) highlighted based on homology with PttCESA8 (Purushotham et al., 2020). The red circle indicates the location of the TEN mutation. Black circles indicate the locations of point mutations that confer isoxaben resistance in Arabidopsis CESAs. No DCB resistance mutation have been characterized (Larson and McFarlane, 2021).
Figure S2.
Figure S2.
Genotype and phenotype of csld6KO, csld2KO, and csld2/6KO. (A) PCR-based genotyping. CSLD6KO-npt and CSLD2KO-hph vectors integrated to delete CSLD6 and CSLD2, respectively, with primers used for amplification of the 5′ and-3′ integration sites (arrows). For csld6KO-4, -11, -12, -20 and -32 (top row), 5′ integration tested with primer pair D6KOFlankF/VectorR-npt produced the expected 1,581 bp fragment, 3′ integration tested with primer pair VectorF-npt/D6KOFlankR produced the expected 1,476 bp fragment, and target deletion was verified by the absence of a product from primers D6TargetF/D6TargetR, which anneals within the CSLD6 coding sequence and amplified an 828 bp fragment in the wild type. For csld2KO (middle two rows), 5′ integration tested with primer pair D2KOFlankF/VectorR-hph produced the expected 1,557 bp fragment in 10 lines, 3′ integration tested with primer pair VectorF-hph/D2KOFlankR produced the expected 1,611 bp fragment in 7 of those lines and target deletion was verified in lines csld2KO-1, -4, -9, -10, -16, and -17 by the absence of a product from primers D2TargetF/D2TargetR, which anneal within the CSLD2 coding sequence and amplify a 217 bp fragment in the wild type. For csld2/6KO (bottom two rows), 5′ and 3′ integration of the CSLD2KO-hph vector in csld2KO-32 was tested with the same primer pairs. Target deletion was verified in lines csld2/6KO-12, -13, -38, and -77. cre-mediated deletion of the selection cassette was verified for csld2/6KO-9 and 16 by amplification across the deletion site with primers D2KOFlankF/D2KOFlankR (2,724 bp). (B) Tube structures on csld2/6KO phyllids develop through altered cell expansion. Cells surrounding a cell separation (*) elongate radially forming an abaxial bulge with separation at the apex. Cell division and expansion enlarges the bulge forming a tube that protrudes from the abaxial surface. Scale bars = 50 μm. (C) CSLD2 or CSLD6 rescues phyllid development defects. Wild-type leaf morphology was restored when csld2/6KO plants were transformed with either a CSLD2 or CSLD6 expression vector, but not an empty control vector (EV). Ratios indicate the number of transformed lines with normal gametophores over the total number of transformed lines with gametophores. csld2/6KO image is a partial duplication of Fig. 2 G. (D) CSLD2 and CSLD6 are not required for protonemal development. Quantification of chlorophyll autofluorescence images of 7-d old wild type and csld2/6KO plants regenerated from protoplasts as a proxy for total plant area. A binary image of the median plant from each line is shown above (scale bar = 250 µm). For each of two experiments, 25 plants were measured from each of six replicate plates for each genetic line. Area was normalized to the wild-type parent line. Significant differences determined by a one-way ANOVA analysis with a Tukey post hoc test (alpha = 0.05) are indicated by different letters. Source data are available for this figure: SourceData FS2.
Figure 2.
Figure 2.
CSLD2 and CSLD6 are redundant and required for normal phyllid development. (A and H) Phyllid development proceeds normally in wild-type (A and B), csld2KO (C and D), and csld6KO (E and F) plants. In contrast, the phyllids of double csld2/6KO plants (G and H) show a variety of morphological defects including midribs that do not extend to the tips (white asterisk), formation of protonema-like filaments on the leaf margins (black asterisk) and bulges that sometimes extend to form tube-like structures (black arrowhead). Minor defects consisting of cell separations surrounded by cells with altered growth orientation (white arrowheads) are found in csld6KO (F) and csld2/6KO (H) phyllids. (I–N) Phyllids stained with Pontamine Fast Scarlet 4B (S4B) and imaged with confocal scanning laser microscopy. Cells elongate parallel to the phyllid axis in wild type (I). Cell adhesion and expansion defects in csld2/6KO plants (J–N) include structures that form where cells surrounding a small cell separation elongate in a radial pattern (J, arrowhead), bulges that form as cells surrounding a small separation elongate and divide (K, arrowhead), large cell separations (L, arrowhead), midribs that end abruptly instead of extending to the leaf tip (M, arrowhead), and marginal cells that extend as filaments that superficially resemble protonemata (N, arrowhead). Scale bars, 2 mm (A, C, E, and G), 200 μm (B, D, F, and H), and 50 μm (I and J–N).
Figure S3.
Figure S3.
Molecular characterization of the tagged CSLD loci. (A) Diagram illustrates the result of HDR mediated insertion of mScarlet-i (red) sequence in a generic CSLD genomic locus. The position of the protospacer (PS) sequences is indicated with an orange arrow. The dashed vertical lines indicate the junction between the knock-in construct and upstream and downstream genomic sequences. Small arrows above the diagrams represent primers used for genotyping. PCR products obtained with the indicated primer pairs are shown below the diagram. Expected sizes for wild type (WT) and edited loci are shown for each CSLD locus. Molecular weight is indicated in kb. (B) Diagram illustrates the result of HDR mediated insertion of mEGFP (green) sequences in the CSLD6 genomic locus. Coding exons are indicated by thick boxes and untranslated exons are indicated by thin boxes. Thin lines indicate intronic regions. The dashed vertical lines indicate the junction between the knock-in construct and upstream and downstream genomic sequences. Small arrows above the diagrams represent primers used for genotyping. Scale bar is 0.5 kb. PCR products obtained with the indicated primer pairs are shown below the diagram. Predicted sizes for correct products are indicated below each gel. Molecular weight is indicated in kb. (C) Gametophore phyllids form normally in 3–4-wk-old plants regenerated from ground tissue, with no phyllid patterning defects visible as seen in csld2/6KO plants (see Fig. 2, G and H), demonstrating that the tagged CSLD6 is functional. Scale bar, 500 µm. (D) Similar to mScarlet-CSLD6, mEGFP-CSLD6 is enriched in cytosolic punctae and at the apical plasma membrane of tip growing cells. Images are from a time lapse acquisition of confocal images of the medial plane of a growing protonemal cell. Time is indicated by min:sec. Yellow and orange dotted lines indicate the shape of the cell at 00:00, and 05:50 times, respectively. Scale bar, 10 µm. (E) Maximum projection of a confocal Z-stack of a dividing protonemal cell shows that mEGFP-CSLD6 accumulates at the cell division plane. Large globular structures are chloroplasts which are more concentrated near the division plane and auto-fluoresce in the GFP channel. Source data are available for this figure: SourceData FS3.
Figure 3.
Figure 3.
Localization of endogenously tagged CSLD1-8 with mScarlet in a moss line stably expressing mEGFP-tubulin. (A) In protonemata, CLSDs localized to punctate structures and are enriched on the plasma membrane near the cell apex. (B) During cell division, CSLDs accumulate on the expanding cell plate. Scale bar, 5 µm. All images are single focal planes acquired on a laser scanning confocal microscope.
Figure 4.
Figure 4.
Arrival of CSLD6 to the cell apex depends on and occurs after actin, but CSLD6 enrichment precedes actin at the developing cell plate. (A) In moss gametophores, CLSD6 is enriched in punctate structures and in the cell plates during cell division (yellow arrowheads.) Insets from the boxed regions reveal the presence of fewer CSLD6 puncta in dividing cells. Scale bar, 20 µm. Scale bar for inset, 10 µm. Time stamps, hour:minute. Also see Video 1. (B) In moss protonemata, mScarlet-CSLD6 (magenta) accumulates at the cell apex (blue arrowheads) and at the site of cell division (yellow arrowheads.) Actin is labeled with lifeact-mEGFP (green), which also accumulates near the cell apex and at the site of cell division. Inset from the boxed region reveals that CSLD6 labels the plasma membrane, while actin is in the cytosol at the cell apex. Images are maximum projections of z-stacks from a time-lapse acquisition. Inset is from the medial plane. Scale bar, 20 µm. Scale bar for inset, 10 µm. Time stamps, hour:minute. Also see Video 2. (C) mScarlet-CSLD6 in control and LatB-treated protonemal apical cells. Cyan dotted line outlines the cells. Scale bar, 5 µm. Images are from the medial focal plane. (D) During branch formation, actin appeared (4:50) before CSLD6 accumulation (6:40). Cell expansion occurs (8:00) after actin and CSLD6 accumulation. Images are maximum projections of z-stacks from a time-lapse acquisition. Scale bar, 10 µm. Time stamps, hour:minute. Also see Video 3. (E) Kymographs generated along the yellow dashed line in C. In the kymographs, actin appears at the cell apex (yellow arrowheads) before CLSD6 (blue arrowheads) and cell expansion. Scale bars, 10 µm (horizontal) and 2 h (vertical). (F) In dividing protonemal cells, CSLD6 appears in the cell plate (5:30) earlier than actin (6:00). Images are single focal plane confocal images from a time-lapse acquisition. Scale bar, 5 µm. Time stamps, min:sec. Also see Video 4.
Figure S4.
Figure S4.
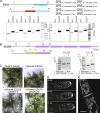
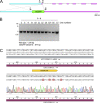
Molecular characterization of the tagged CESA10 locus and the mEGFP-CSLD6-TEN locus. (A) Diagram illustrates the result of HDR mediated insertion of mEGFP sequences from the homology repair plasmid (bottom) into the CESA10 genomic locus (top). Exons (first 7 shown) are indicated by pink boxes and the cloned promoter is indicated by cyan boxes. Thin lines indicate intronic regions. The inserted mEGFP sequence is denoted by a thick green box. Small arrows above the diagrams represent primers used for genotyping. (B) PCR products obtained with primer pairs using template DNA isolated from the indicated moss lines were separated on an agarose gel and stained with ethidium bromide. The asterisk indicates the line chosen for imaging after sequencing the PCR product. Molecular weight is indicated in kb. Predicted sizes for correct products are indicated below the gel. (C) Sequencing of a PCR product (Table S2) amplified from a plant transformed with PS4 (yellow bar) cloned into pMH-Cas9 together with double stranded TEN-oligo (Table S2) reveals CRISPR-Cas9 mediated editing resulting in the three designed silent mutations and the G2599A mutation resulting in D867N. Source data are available for this figure: SourceData FS4.
Figure 5.
Figure 5.
CSLD6 moves in linear trajectories on the plasma membrane, which are specifically inhibited by DCB. (A) Moss protonemata expressing mEGFP-CESA10, mEGFP-CSLD6, or mEGFP-CSLD6-TEN imaged with VAEM. mEGFP-CSLD6-TEN did not move in the membrane. 20 µM isoxaben did not affect CSLD6 particle movement, but treatment with 10 µM DCB treatment inhibited CSLD6 particle motility. Scale bar for all images in A, 2 µm (horizontal) and 1 min (vertical). Kymographs were generated along a trajectory in the time projection. Also see Video 5. (B) Histogram of particle speed as determined by particle tracking with the Fiji plugin TrackMate. On average CSLD6 particles moved faster than CESA10. (C) Speed measurements from kymographs (CESA10, n = 44 trajectories from two cells; CSLD6, n = 119 trajectories from two cells) or from particle tracking (CESA10, n = 72 trajectories from two cells; CSLD6, n = 198 trajectories from two cells) were the same. n.s. denotes no significant difference as determined by a Kruskal–Wallis statistical test. (D) Images of phyllids from gametophores of the indicated genotype show that the CSLD6-TEN allele (containing the D867N mutation) exhibits abnormally shaped cells similar to phyllids from csld2/6KO plants (see Fig. 2). Scale bar for all images in D, 100 µm. (E) Confinement ratio shows that CESA10 trajectories from ten cells were straighter than CSLD6 trajectories (CESA10, n = 271 from ten cells; CSLD6, n = 682 trajectories from five cells, CSLD6+isoxaben, n = 486 trajectories from six cells). Asterisks denote P < 0.001 and n.s. denotes no significant difference as determined by a Kruskal–Wallis statistical test. Scale bar for all images in E, 2 µm. (F) Histogram of CSLD6 particle speed with or without isoxaben treatment as determined by particle tracking with the Fiji plugin TrackMate. (G and H) Single focal plane confocal time-lapse image of protonemata expressing mScarlet-CSLD6 with no drug (G), 20 µM DCB, or 20 µM isoxaben (H). Scale bar for all images in G and H, 5 µm. Also see Video 6. (G) CSLD6 accumulated at the cell apex and appeared as punctae (yellow arrowheads). (H) With DCB treatment, CSLD6 still accumulated at the cell apex but the tip cell ruptures (blue arrowhead). Isoxaben treatment did not cause cell rupture and did not affect CSLD6 localization to the cell tip.
Figure 6.
Figure 6.
CSLD trajectories do not align with cortical microtubules. (A) Time-lapse VAEM imaging of protonemata expressing mScarlet-CSLD6 (magenta in the merged image) and mEGFP-tubulin (green in the merged image) demonstrate that the majority of CSLD6 particles do not associate with cortical microtubules. Scale bar for all images in A, 5 µm. Also see Video 7. (B and C) Lines on the image were used to produce the kymographs shown in C. Scale bar in B, 5 µm. (C) Kymographs demonstrate that mScarlet CSLD6 (magenta) moves in linear trajectories that are not associated with microtubules (green). Horizontal scale bar in C, 2 µm. Vertical scale bar in C, 1 min.
Figure 7.
Figure 7.
CSLD activity and actin stabilize the nascent cell plate. Cell divisions in moss protonemata expressing mScarlet-CSLD6 (magenta in merge) and mEGFP-tubulin (green in merge) and stained for callose with aniline blue (blue in merge). (A) Cell without drug treatment. Also see Video 8. (B) Cell treated with 10 µM DCB. The cell plate buckles (18:00 and 25:00) but straightens again afterward (35:00 and 50:00). Also see Video 8. (C) Cell treated with 25 µM LatB. Also see Video 9. (D) Cell treated with 25 µM LatB and 10 µM DCB. Also see Video 10. Scale bars, 5 µm. Time stamps, min:sec.
Figure S5.
Figure S5.
Isoxaben does not affect cell plate formation. Cell division in moss protonemata expressing mScarlet-CSLD6 (magenta in merge) and mEGFP-tubulin (green in merge), stained with aniline blue for callose (blue in merge). (A) Cell treated with 20 µM isoxaben. (B) Cell treated with 20 µM Isoxaben and 25 µM LatB. Images are single focal plane confocal images from a time-lapse acquisition. Scale bar, 5 µm. Time stamp, min:sec.

References

    1. Anderson, C.T., and Kieber J.J.. 2020. Dynamic construction, perception, and remodeling of plant cell walls. Annu. Rev. Plant Biol. 71:39–69. 10.1146/annurev-arplant-081519-03584 - DOI - PubMed
    1. Baldauf, S.L. 2003. Phylogeny for the faint of heart: A tutorial. Trends Genet. 19:345–351. 10.1016/S0168-9525(03)00112-4 - DOI - PubMed
    1. Bascom, C.S., Jr, Winship L.J., and Bezanilla M.. 2018. Simultaneous imaging and functional studies reveal a tight correlation between calcium and actin networks. Proc. Natl. Acad. Sci. USA. 115:E2869–E2878. 10.1073/pnas.1711037115 - DOI - PMC - PubMed
    1. Bascom, C.S., Jr, Wu S.Z., Nelson K., Oakey J., and Bezanilla M.. 2016. Long-term growth of moss in microfluidic devices enables subcellular studies in development. Plant Physiol. 172:28–37. 10.1104/pp.16.00879 - DOI - PMC - PubMed
    1. Bernal, A.J., Jensen J.K., Harholt J., Sørensen S., Moller I., Blaukopf C., Johansen B., de Lotto R., Pauly M., Scheller H.V., and Willats W.G.. 2007. Disruption of ATCSLD5 results in reduced growth, reduced xylan and homogalacturonan synthase activity and altered xylan occurrence in Arabidopsis. Plant J. 52:791–802. 10.1111/j.1365-313X.2007.03281.x - DOI - PubMed

Publication types