. 2023 Nov;19(11):4952-4966.
doi: 10.1002/alz.13055. Epub 2023 Apr 18.

MicroRNA expression in extracellular vesicles as a novel blood-based biomarker for Alzheimer's disease

Affiliations

MicroRNA expression in extracellular vesicles as a novel blood-based biomarker for Alzheimer's disease

Ashish Kumar et al. Alzheimers Dement. 2023 Nov.

Abstract

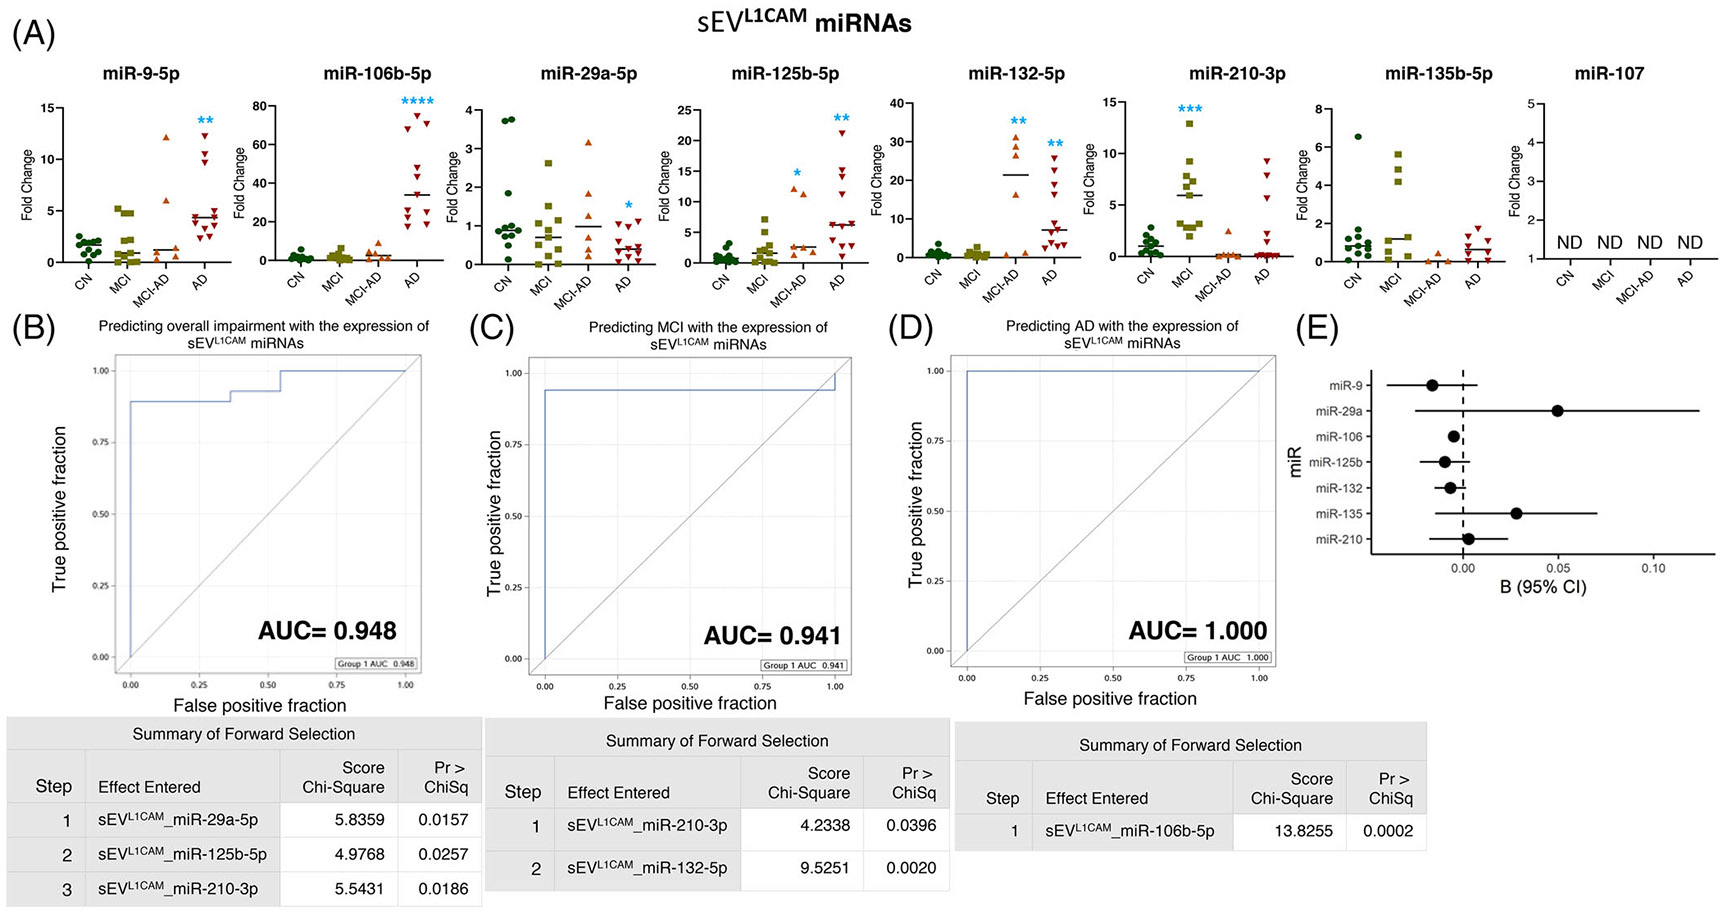
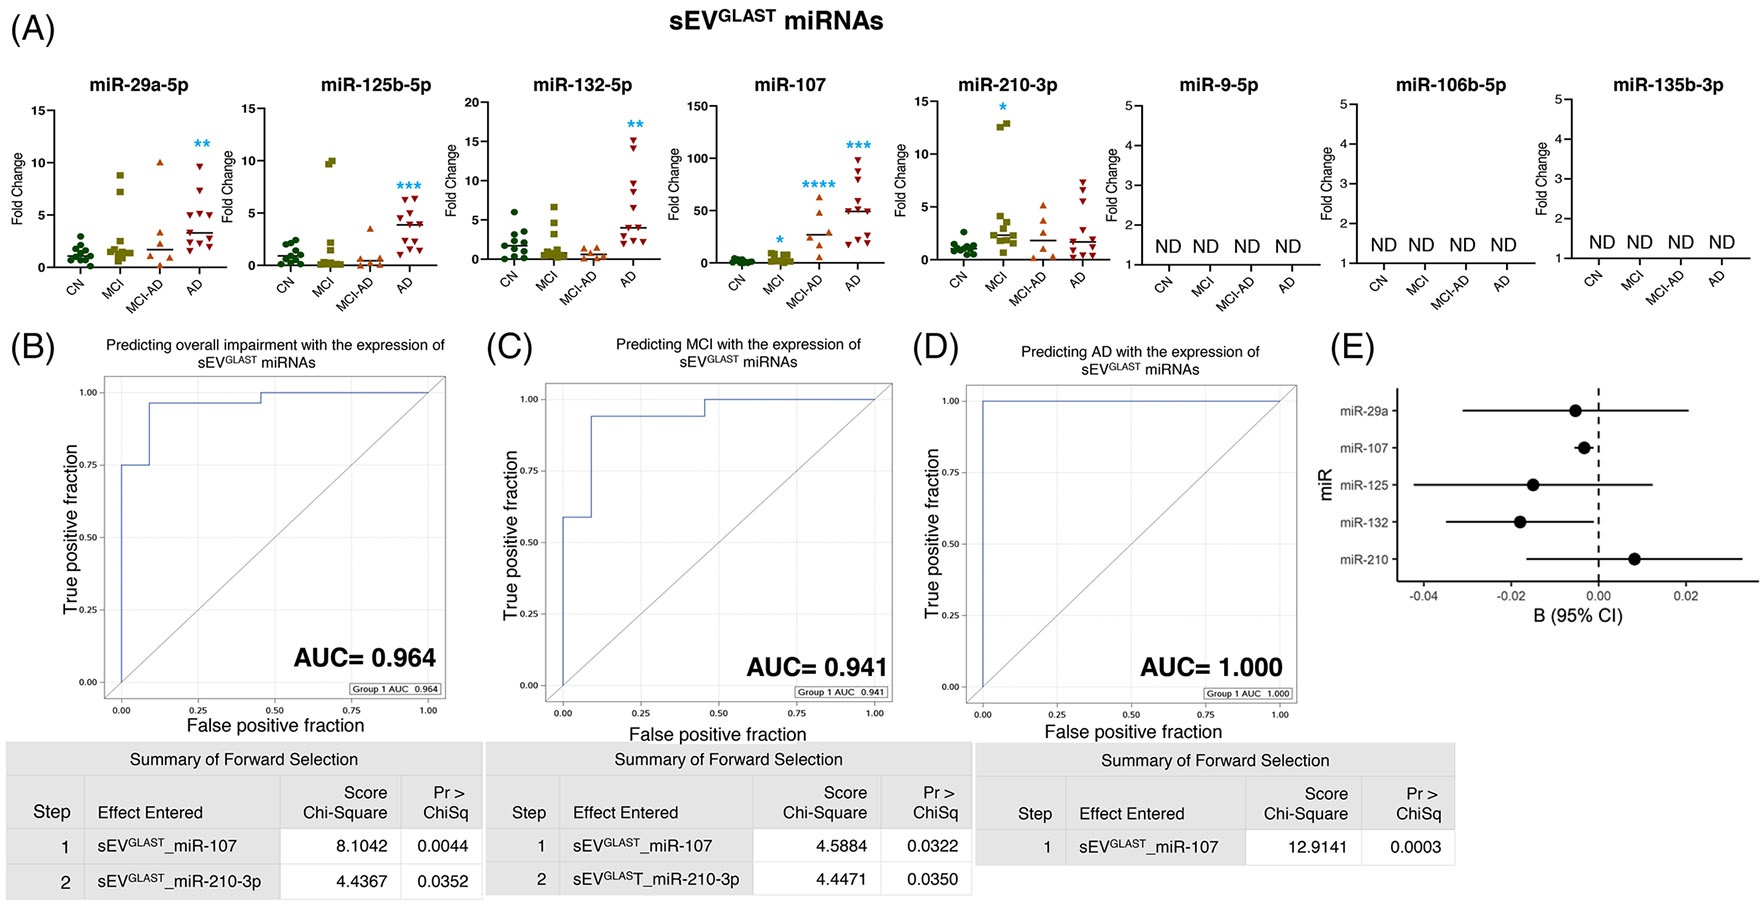
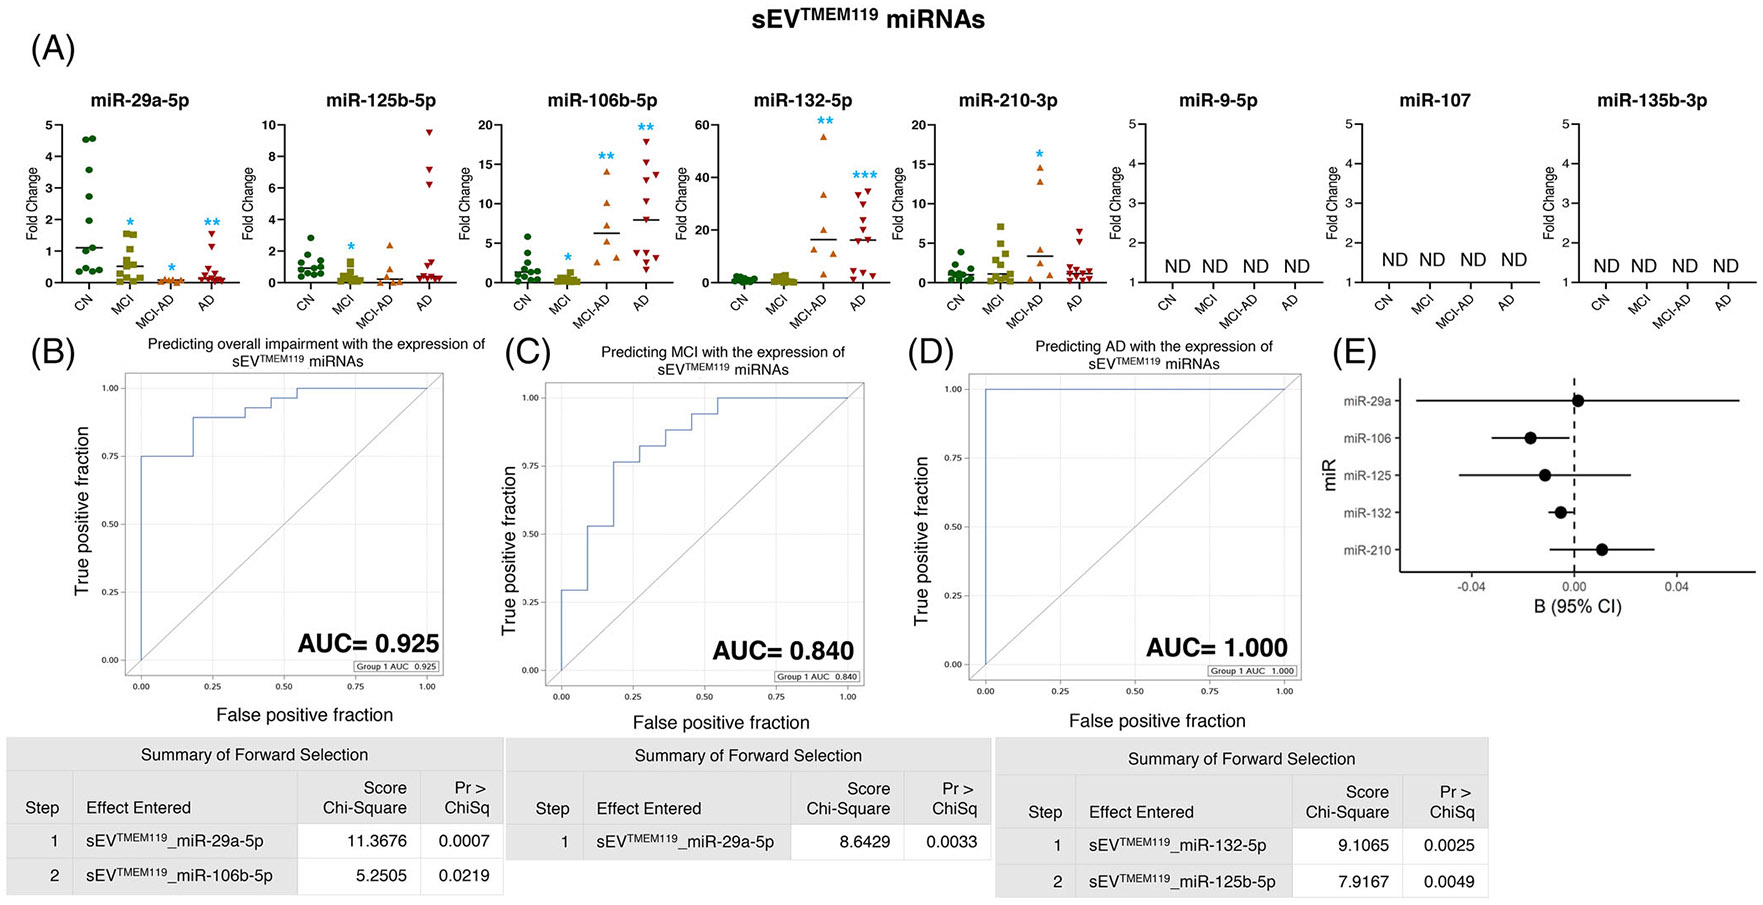
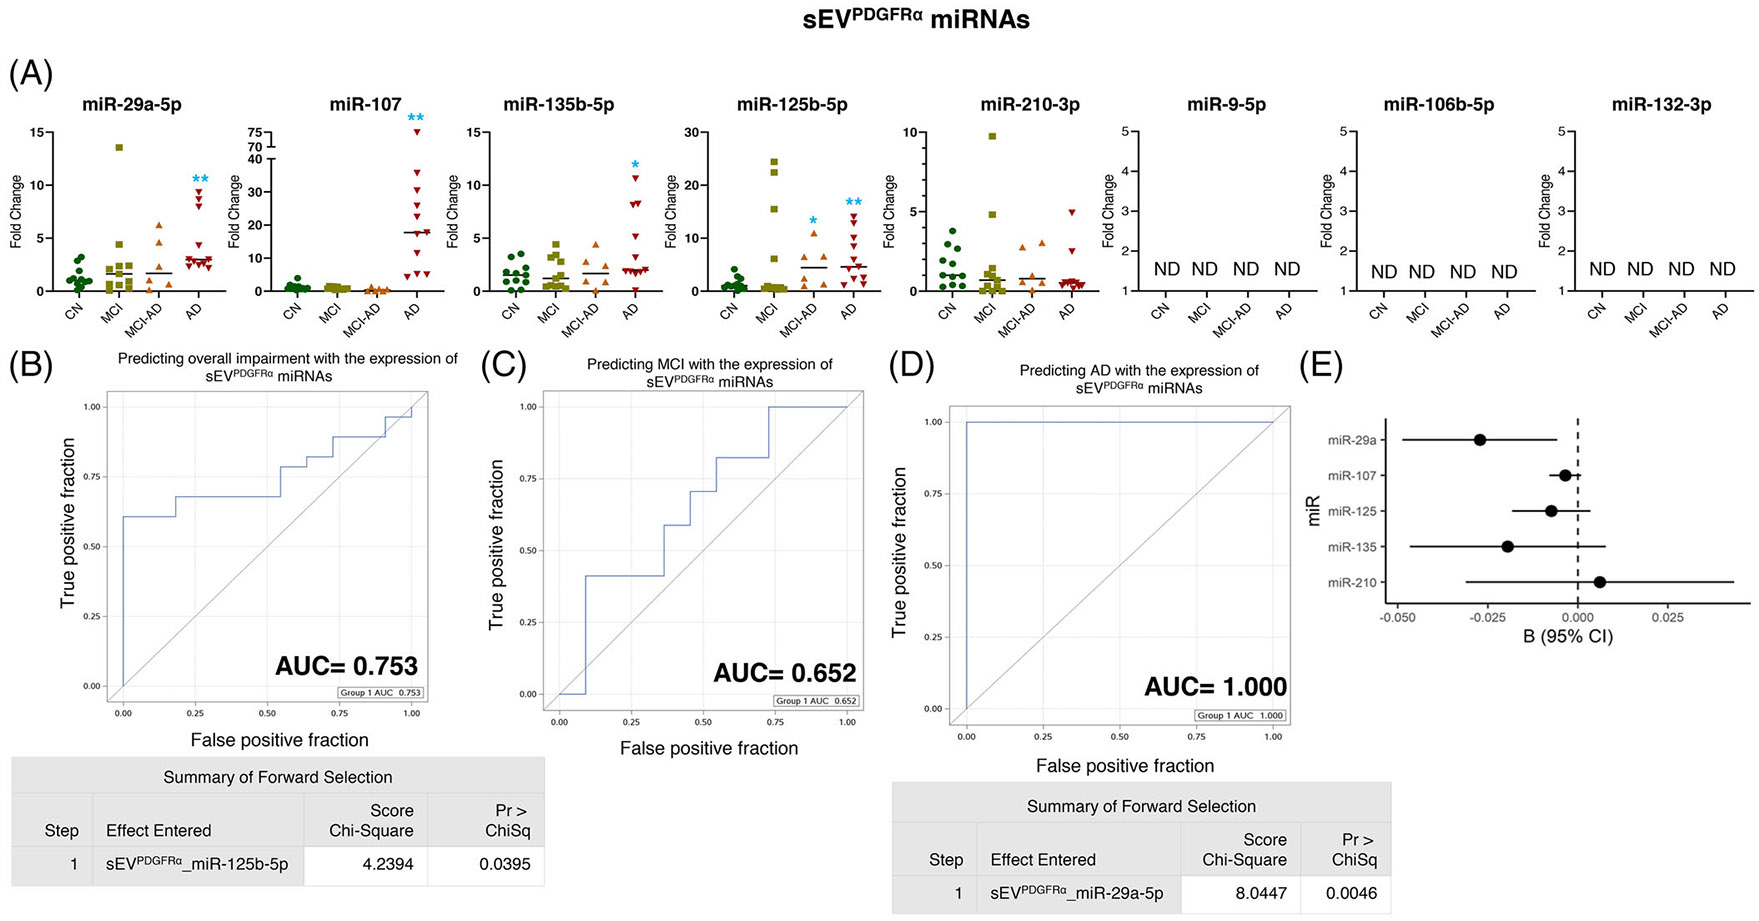
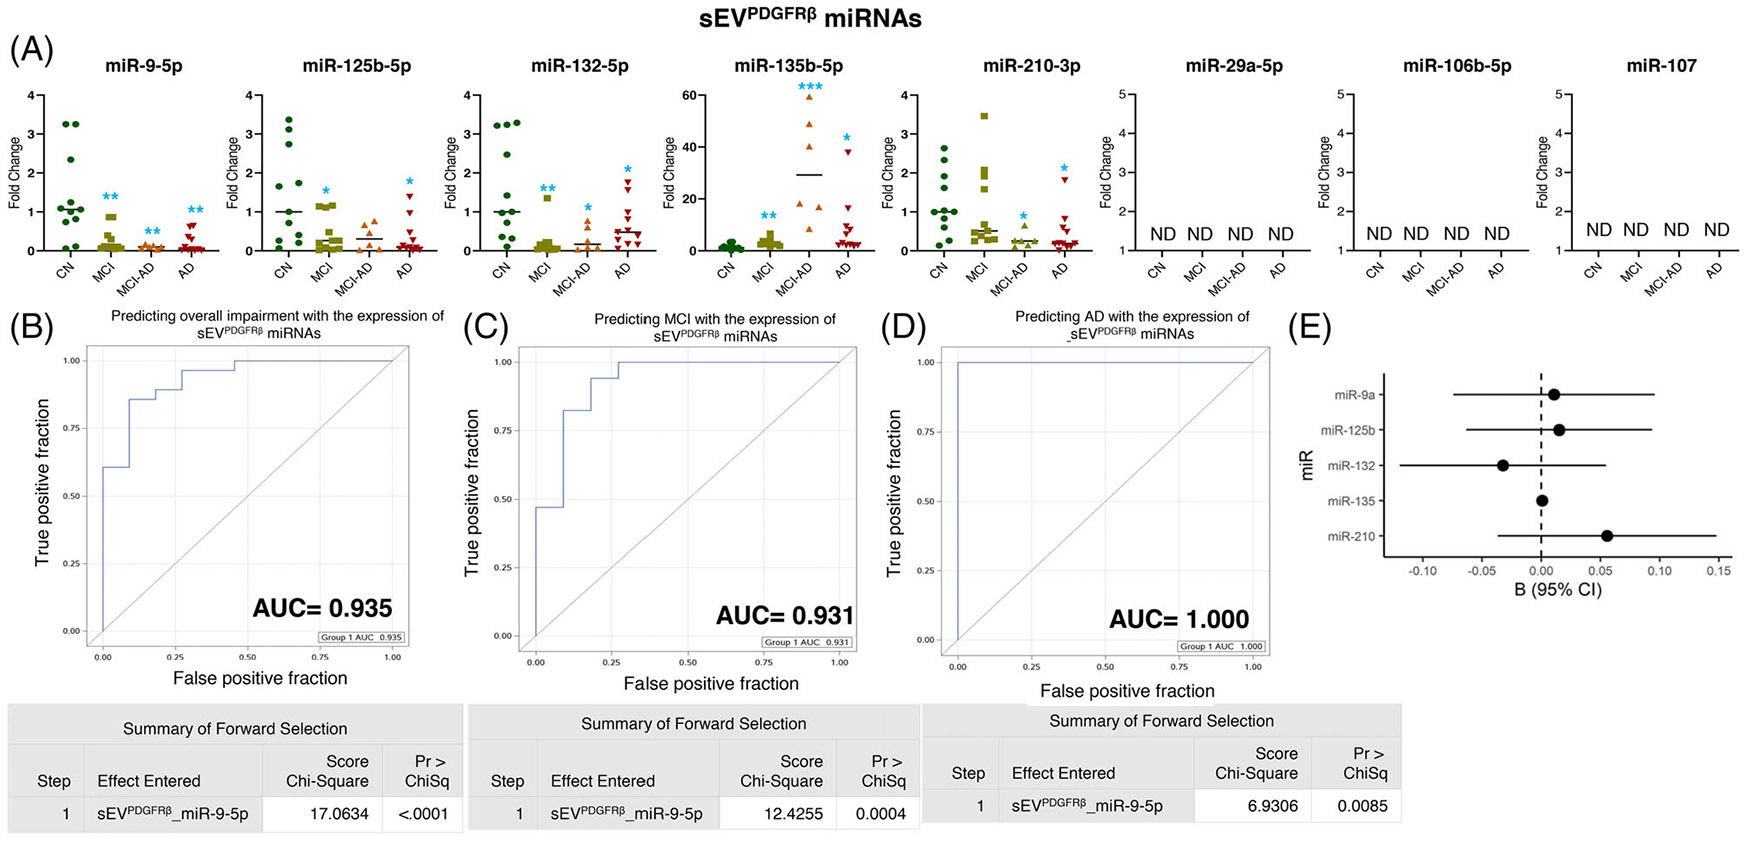
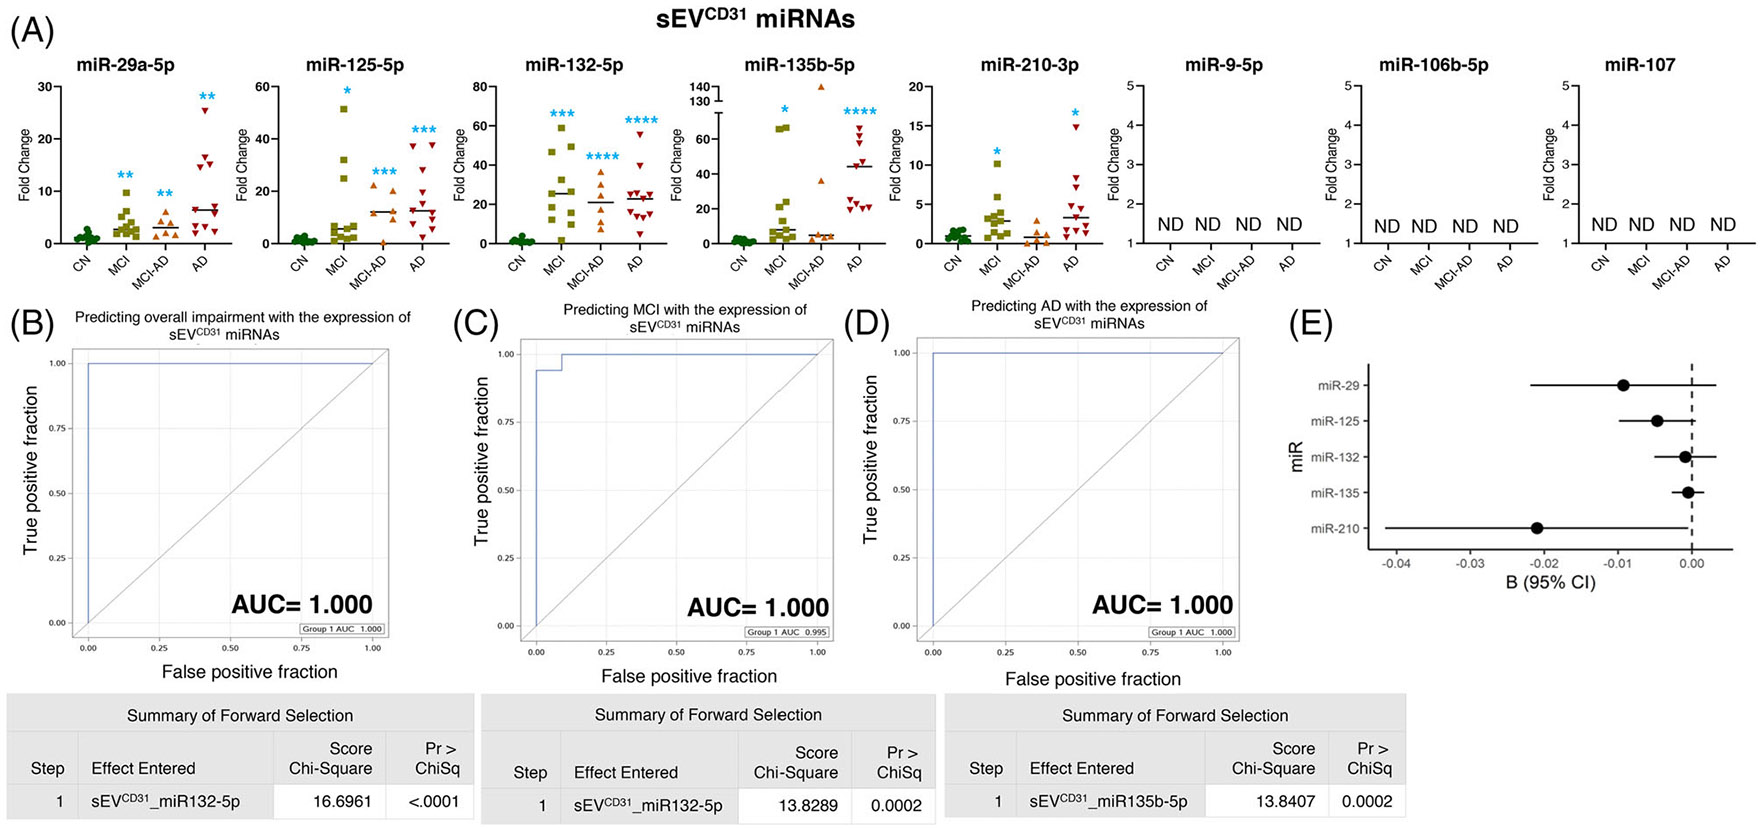
Introduction: Brain cell-derived small extracellular vesicles (sEVs) in blood offer unique cellular and molecular information related to the onset and progression of Alzheimer's disease (AD). We simultaneously enriched six specific sEV subtypes from the plasma and analyzed a selected panel of microRNAs (miRNAs) in older adults with/without cognitive impairment.

Methods: Total sEVs were isolated from the plasma of participants with normal cognition (CN; n = 11), mild cognitive impairment (MCI; n = 11), MCI conversion to AD dementia (MCI-AD; n = 6), and AD dementia (n = 11). Various brain cell-derived sEVs (from neurons, astrocytes, microglia, oligodendrocytes, pericytes, and endothelial cells) were enriched and analyzed for specific miRNAs.

Results: miRNAs in sEV subtypes differentially expressed in MCI, MCI-AD, and AD dementia compared to the CN group clearly distinguished dementia status, with an area under the curve (AUC) > 0.90 and correlated with the temporal cortical region thickness on magnetic resonance imaging (MRI).

Discussion: miRNA analyses in specific sEVs could serve as a novel blood-based molecular biomarker for AD.

Highlights: Multiple brain cell-derived small extracellular vesicles (sEVs) could be isolated simultaneously from blood. MicroRNA (miRNA) expression in sEVs could detect Alzheimer's disease (AD) with high specificity and sensitivity. miRNA expression in sEVs correlated with cortical region thickness on magnetic resonance imaging (MRI). Altered expression of miRNAs in sEVCD31 and sEVPDGFRβ suggested vascular dysfunction. miRNA expression in sEVs could predict the activation state of specific brain cell types.

Keywords: Alzheimer's disease; biomarker; brain cells; extracellular vesicles; microRNA.


Conflict of interest statement

CONFLICT OF INTEREST STATEMENT

GD is the founder of LiBiCo, which has no influence or contribution to the work presented in this manuscript. Author disclosures are available in the supporting information.

Figures

FIGURE 1
FIGURE 1
Expression profiling of specific microRNAs (miRNAs) in small extracellular vesicle (sEV)L1CAM and their correlation with cognitive impairment and temporal cortical thickness. (A) The expression of eight miRNAs was analyzed in sEVL1CAM in subjects with normal cognition (CN; n = 11), mild cognitive impairment (MCI; n = 11), MCI-AD (Alzheimer’s disease) (n = 6), or AD (n = 11) by quantitative real-time polymerase chain reaction (PCR). Fold-change in the expression of miRNA showing detectable expression was calculated by the ΔΔCt method (as mentioned in Methods) after normalization with cel-miR-39-3p. Fold-change of all the samples is plotted by calculating 2−ΔΔCt. ND = “not detectable.” *p < 0.05, **p < 0.005, ***p < 0.0005, ****p < 0.0001. (B–D) Receiver-operating characteristic (ROC) curves curated from logistic regression classifiers of sEVL1CAM for overall impairment (B), MCI (C), or AD (D) outcomes using the forward selection method with alpha = 0.05. All models were adjusted for age and sex. Summary of the forward selection sEVL1CAM miRNA shown under each ROC curve. (E) Correlation of detected miRNAs in sEVL1CAM with the temporal cortical thickness on magnetic resonance imaging (MRI).
FIGURE 2
FIGURE 2
Expression profiling of specific microRNAs (miRNAs) in small extracellular vesicle (sEV)GLAST and their correlation with cognitive impairment and temporal cortical thickness. (A) The expression of eight miRNAs was analyzed in sEVGLAST in subjects with normal cognition (CN; n = 11), mild cognitive impairment (MCI; n = 11), MCI-AD (Alzheimer’s disease) (n = 6), or AD (n = 11) by quantitative real-time polymerase chain reaction (PCR). Fold-change in the expression of miRNA showing detectable expression was calculated by the ΔΔCt method after normalization with cel-miR-39-3p. Fold-change of all the samples is plotted by calculating 2−ΔΔCt. ND = “not detectable.” *p < 0.05, **p < 0.005. (B–D) Receiver-operating characteristic (ROC) curves curated from logistic regression classifiers of sEVGLAST for overall impairment (B), MCI (C), or AD (D) outcomes using the forward selection method with alpha = 0.05. All models were adjusted for age and sex. Summary of the forward selection sEVGLAST miRNA shown under each ROC curve. (E) Correlation of detected miRNAs in sEVGLAST with the temporal cortical thickness on magnetic resonance imaging (MRI).
FIGURE 3
FIGURE 3
Expression profiling of specific microRNAs (miRNAs) in small extracellular vesicle (sEV)TMEM119 and their correlation with cognitive impairment and temporal cortical thickness. (A) The expression of eight miRNAs was analyzed in sEVTMEM119 in subjects with normal cognition (CN; n = 11), mild cognitive impairment (MCI; n = 11), MCI-AD (Alzheimer’s disease) (n = 6), or AD (n = 11) by quantitative real-time polymerase chain reaction (PCR). Fold-change in the expression of miRNA showing detectable expression was calculated by the ΔΔCt method (as mentioned in methods) after normalization with cel-miR-39-3p. Fold-change of all the samples is plotted by calculating 2−ΔΔCt. ND = “not detectable.” *p < 0.05, **p < 0.005. (B–D) Receiver-operating characteristic (ROC) curves curated from logistic regression classifiers of sEVTMEM119 for overall impairment (B), MCI (C), or AD (D) outcomes using the forward selection method with alpha = 0.05. All models were adjusted for age and sex. Summary of the forward selection sEVTMEM119 miRNA shown under each ROC curve. (E) Correlation of detected miRNAs in sEVTMEM119 with the temporal cortical thickness on magnetic resonance imaging (MRI).
FIGURE 4
FIGURE 4
Expression profiling of specific microRNAs (miRNAs) in small extracellular vesicle (sEV)PDGFRα and their correlation with cognitive impairment and temporal cortical thickness. (A) The expression of eight miRNAs was analyzed in sEVPDGFRα in subjects with normal cognition (CN; n = 11), mild cognitive impairment (MCI; n = 11), MCI-AD (Alzheimer’s disease) (n = 6), or AD (n = 11) by quantitative real-time polymerase chain reaction (PCR). Fold-change in the expression of miRNA showing detectable expression was calculated by the ΔΔCt method (as mentioned in methods) after normalization with cel-miR-39-3p. Fold-change of all the samples is plotted by calculating 2−ΔΔCt. ND = “not detectable.” *p < 0.05, **p < 0.005. (B–D) Receiver-operating characteristic (ROC) curves curated from logistic regression classifiers of sEVPDGFRα for overall impairment (B), MCI (C), or AD (D) outcomes using the forward selection method with alpha = 0.05. All models were adjusted for age and sex. Summary of the forward selection sEVPDGFRα miRNA shown under each ROC curve except for the MCI group, where no miRNA was identified to distinguish the MCI from the CN group. (E) Correlation of detected miRNAs in sEVPDGFRα with the temporal cortical thickness on magnetic resonance imaging (MRI).
FIGURE 5
FIGURE 5
Expression profiling of specific microRNAs (miRNAs) in small extracellular vesicle (sEV)PDGFRβ and their correlation with cognitive impairment and temporal cortical thickness. (A) The expression of eight miRNAs was analyzed in sEVPDGFRβ in subjects with normal cognition (CN; n = 11), mild cognitive impairment (MCI; n = 11), MCI-AD (Alzheimer’s disease) (n = 6), or AD (n = 11) by quantitative real-time polymerase chain reaction (PCR). Fold-change in the expression of miRNA showing detectable expression was calculated by the ΔΔCt method (as mentioned in methods) after normalization with cel-miR-39-3p. Fold-change of all the samples is plotted by calculating 2−ΔΔCt. ND = “not detectable.: *p < 0.05, **p < 0.005. (B–D) Receiver-operating characteristic (ROC) curves curated from logistic regression classifiers of sEVPDGFRβ for overall impairment (B), MCI (C), or AD (D) outcomes using forward selection technique with alpha = 0.05. All models were adjusted for age and sex. Summary of the forward selection sEVPDGFRβ miRNA shown under each ROC curve. (E) Correlation of detected miRNAs in sEVPDGFRβ with the temporal cortical thickness on magnetic resonance imaging (MRI).
FIGURE 6
FIGURE 6
Expression profiling of specific microRNAs (miRNAs) in small extracellular vesicle (sEV)CD31 and their correlation with cognitive impairment and temporal cortical thickness. (A) The expression of eight miRNAs was analyzed in sEVCD31 in subjects with normal cognition (CN; n = 11), mild cognitive impairment (MCI; n = 11), MCI-AD (Alzheimer’s disease) (n = 6), or AD (n = 11) by quantitative real-time polymerase chain reaction (PCR). Fold-change in the expression of miRNA showing detectable expression was calculated by the ΔΔCt method (as mentioned in methods) after normalization with cel-miR-39-3p. Fold-change of all the samples is plotted by calculating 2−ΔΔCt. ND = “not detectable.” *p < 0.05, **p < 0.005, ***p < 0.0005, ****p < 0.0001. (B–D) Receiver-operating characteristic (ROC) curves curated from logistic regression classifiers of sEVCD31 for overall impairment (B), MCI (C), or AD (D) outcomes using the forward selection technique with alpha = 0.05. All models were adjusted for age and sex. Summary of the forward selection sEVCD31miRNA shown under each ROC curve. (E) Correlation of detected miRNAs in sEVCD31 with the temporal cortical thickness on magnetic resonance imaging (MRI).

References

    1. Gauthier SR-NP, Morais JA, Webster C, World Alzheimer Report 2021: Journey through the diagnosis of dementia. 2021.
    1. DeStrooper B, Karran E. The cellular phase of Alzheimer’s disease. Cell. 2016;164(4):603–615. - PubMed
    1. Henstridge CM, Hyman BT, Spires-Jones TL. Beyond the neuron-cellular interactions early in Alzheimer disease pathogenesis. Nat Rev Neurosci. 2019;20(2):94–108. - PMC - PubMed
    1. Swerdlow RH. Pathogenesis of Alzheimer’s disease. Clin Interv Aging. 2007;2(3):347–359. - PMC - PubMed
    1. Dzamba D, Harantova L, Butenko O, Anderova M. Glial cells - The key elements of Alzheimer s disease. Curr Alzheimer Res. 2016;13(8):894–911. - PubMed

Publication types