. 2023 Jun 1;133(11):e163968.
doi: 10.1172/JCI163968.

Obesity-induced inflammation exacerbates clonal hematopoiesis

Affiliations

Obesity-induced inflammation exacerbates clonal hematopoiesis

Santhosh Kumar Pasupuleti et al. J Clin Invest. .

Abstract

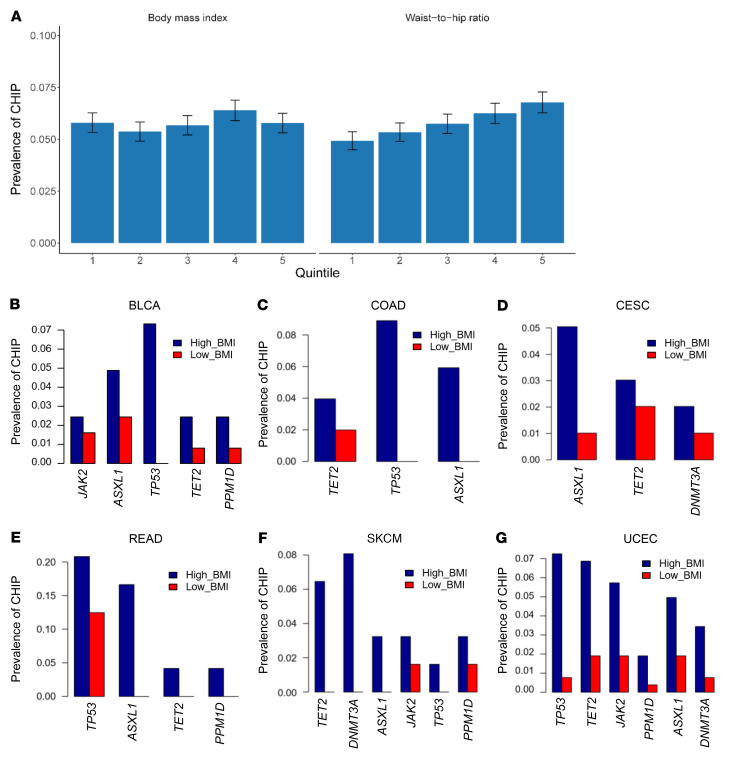
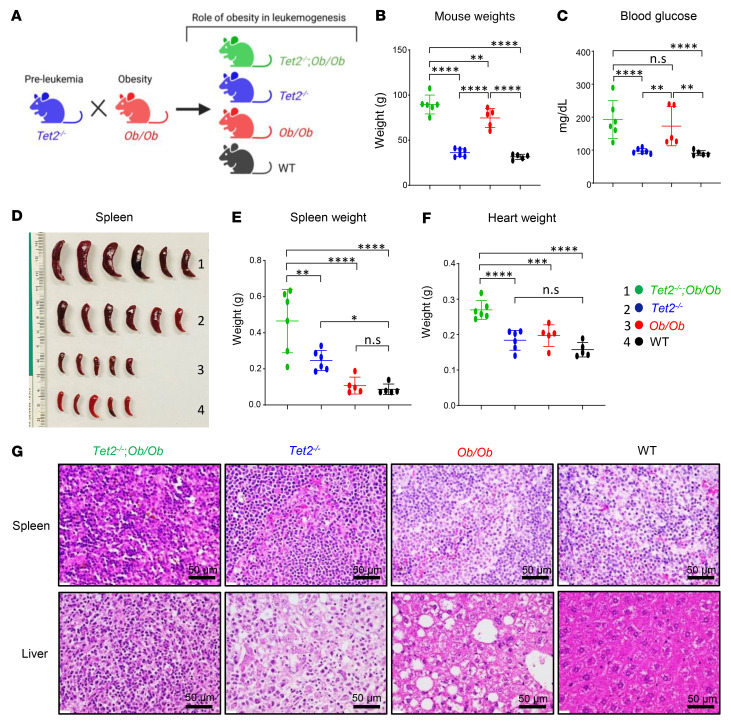
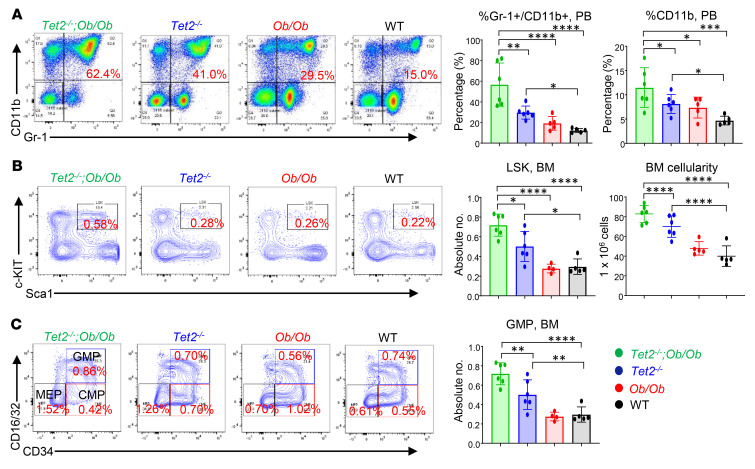
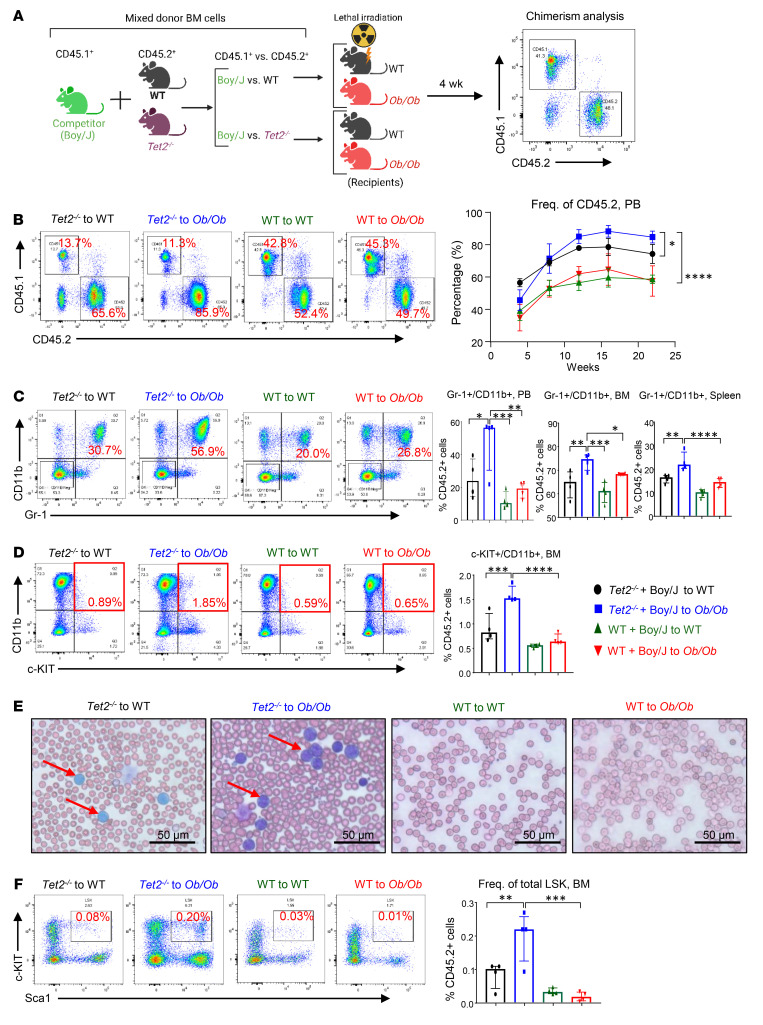
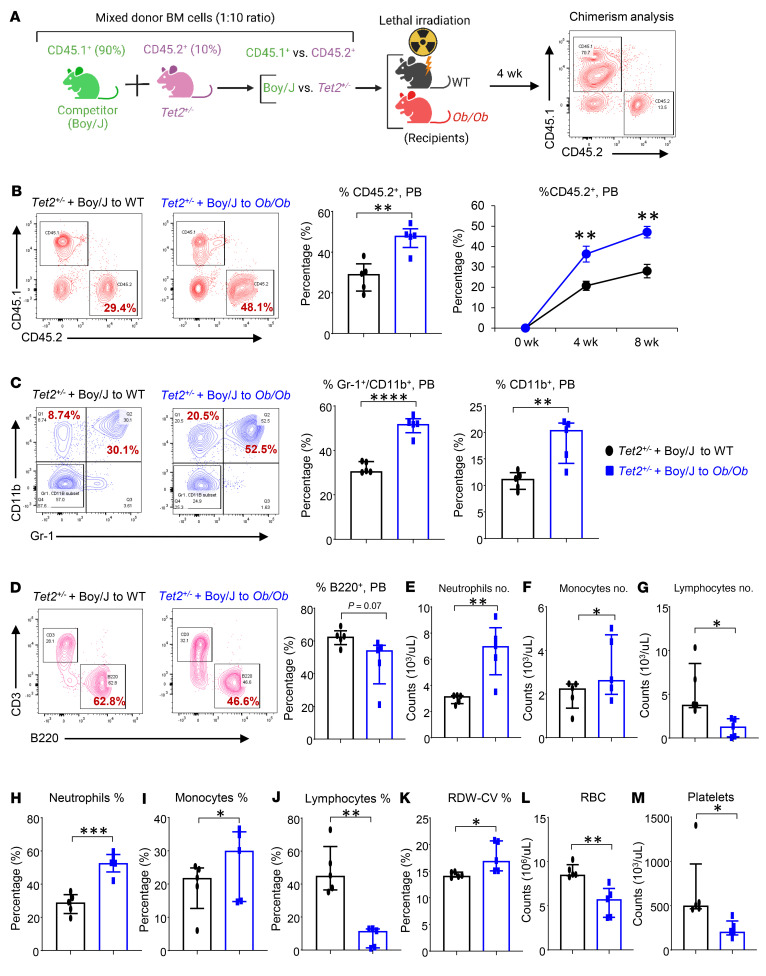
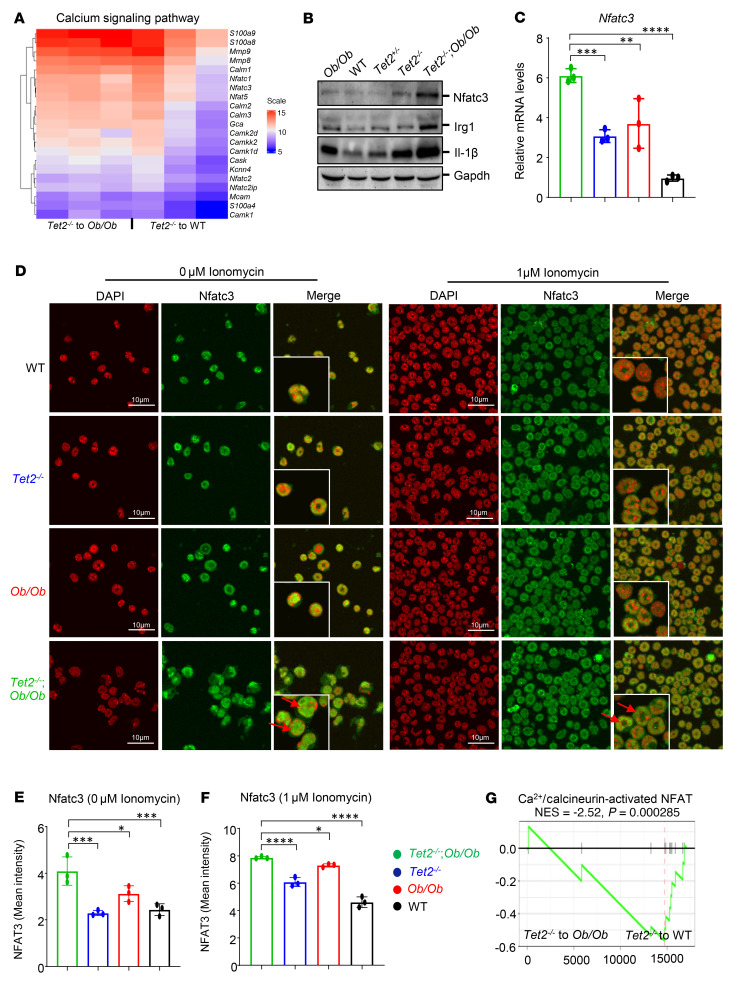
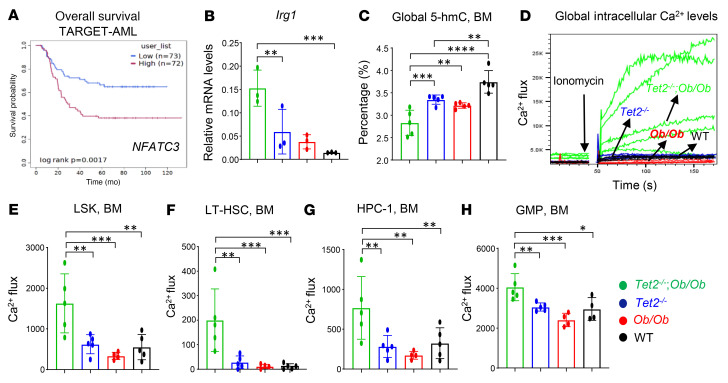
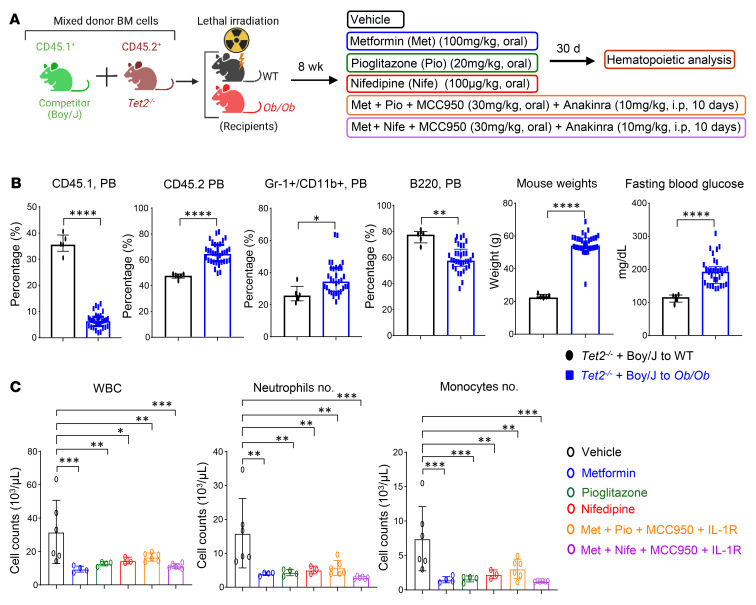
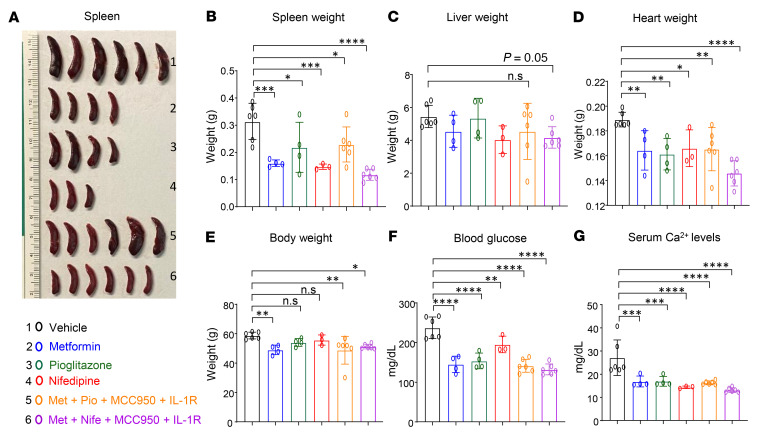
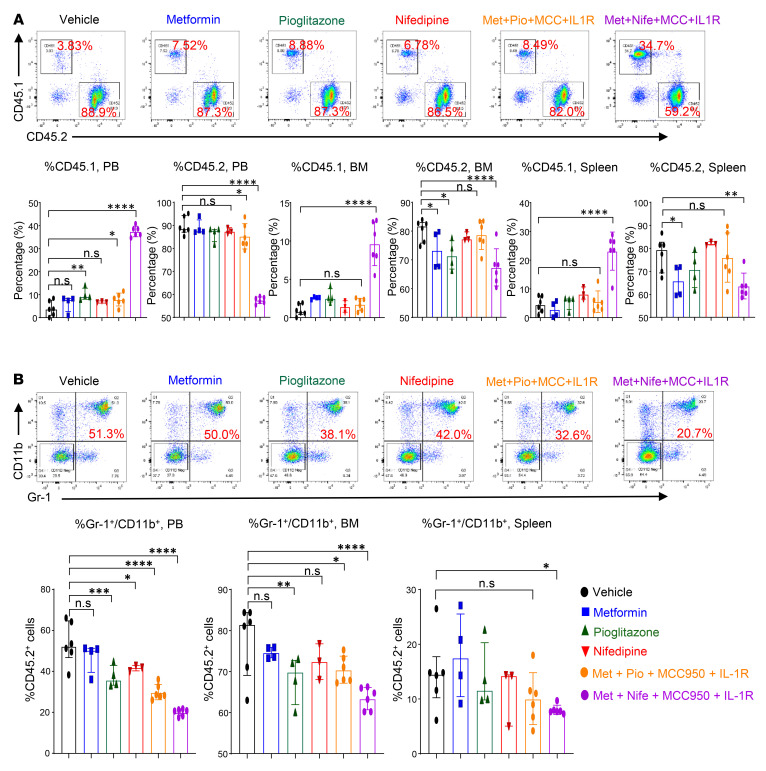
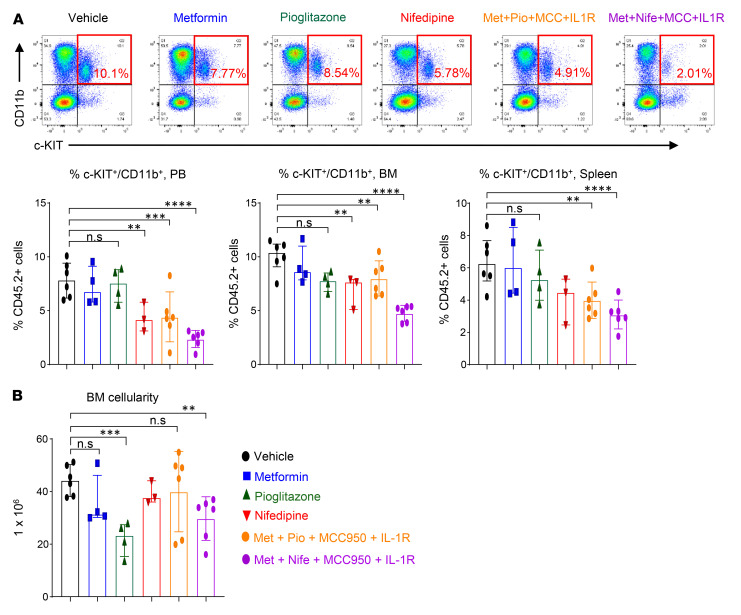
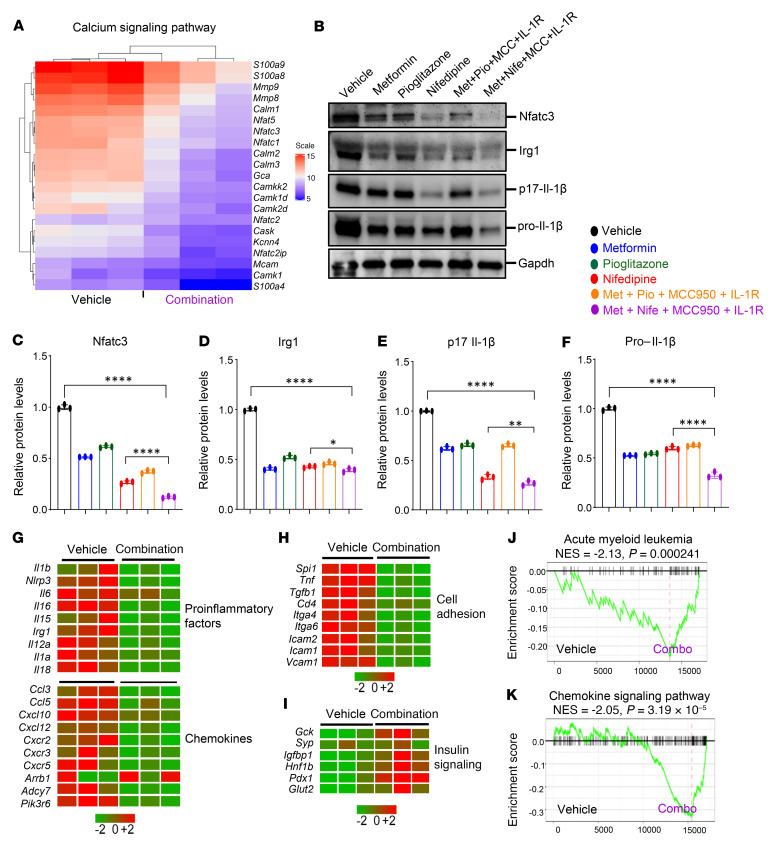
Characterized by the accumulation of somatic mutations in blood cell lineages, clonal hematopoiesis of indeterminate potential (CHIP) is frequent in aging and involves the expansion of mutated hematopoietic stem and progenitor cells (HSC/Ps) that leads to an increased risk of hematologic malignancy. However, the risk factors that contribute to CHIP-associated clonal hematopoiesis (CH) are poorly understood. Obesity induces a proinflammatory state and fatty bone marrow (FBM), which may influence CHIP-associated pathologies. We analyzed exome sequencing and clinical data for 47,466 individuals with validated CHIP in the UK Biobank. CHIP was present in 5.8% of the study population and was associated with a significant increase in the waist-to-hip ratio (WHR). Mouse models of obesity and CHIP driven by heterozygosity of Tet2, Dnmt3a, Asxl1, and Jak2 resulted in exacerbated expansion of mutant HSC/Ps due in part to excessive inflammation. Our results show that obesity is highly associated with CHIP and that a proinflammatory state could potentiate the progression of CHIP to more significant hematologic neoplasia. The calcium channel blockers nifedipine and SKF-96365, either alone or in combination with metformin, MCC950, or anakinra (IL-1 receptor antagonist), suppressed the growth of mutant CHIP cells and partially restored normal hematopoiesis. Targeting CHIP-mutant cells with these drugs could be a potential therapeutic approach to treat CH and its associated abnormalities in individuals with obesity.

Keywords: Cancer; Hematology; Hematopoietic stem cells; Inflammation.


Conflict of interest statement

Conflict of interest: PN reports research grants from Allelica, Apple, Amgen, Boston Scientific, Genentech/Roche, and Novartis; personal fees from Allelica, Apple, AstraZeneca, Blackstone Life Sciences, Foresite Labs, Genentech/Roche, GV, HeartFlow, Magnet Biomedicine, and Novartis; scientific advisory board membership of Esperion Therapeutics, Preciseli, and TenSixteen Bio; equity in Preciseli and TenSixteen Bio; and spousal employment at Vertex Pharmaceuticals. PN is a scientific cofounder of TenSixteen Bio.

Figures

Figure 1
Figure 1. The prevalence of CHIP mutations is higher in patients with obesity.
(A) Prevalence of CHIP mutations across quintiles of BMI and WHR in a cohort of 47,466 unrelated participants in the UK Biobank. The prevalence of CHIP increased with higher WHRs, and the percentage of participants with CHIP was 4.93%, 5.75%, and 6.56% in the lowest, middle, and highest WHR quintiles, respectively. (BG) Higher frequencies of CHIP mutations in patients with a high BMI (>30 kg/m2) compared with patients with a low BMI (≤25 kg/m2). TCGA data were derived from patients with 1 of the following 6 types of cancer: BLCA, COAD, CESC, READ, SKCM, or UCEC.
Figure 2
Figure 2. Tet2 loss-of-function–driven CH exacerbates hyperglycemia and splenomegaly in obese mice.
(A) Schematic demonstrating the generation of Tet2–/– Ob/Ob compound mutant mice along with Tet2–/–, Ob/Ob, and WT control mice. (BF) Elevated body weights, fasting blood glucose levels, spleen weights, and heart weights were observed in Tet2–/– Ob/Ob compound mutant mice compared with mice in the other groups. (G) Histological analysis of H&E-stained sections of spleen and liver from a representative Tet2–/– Ob/Ob mouse along with controls (n = 5–6 mice per group). Scale bars: 50 μm. Data are shown as the mean ± SEM. *P < 0.05, **P < 0.005, ***P < 0.0005, and ****P < 0.0001, by 1-way ANOVA.
Figure 3
Figure 3. Obesity exacerbates the expansion of Tet2–/– pre-LHSCs/PCs.
(A) Representative flow cytometry plots of PB mature myeloid cells (Gr-1+CD11b+) from mice of the indicated genotypes. An increased frequency of myeloid cells (Gr-1+CD11b+) and CD11b+ cells was observed in Tet2–/– Ob/Ob compound mutant mice compared with mice in the other groups. (B) Representative flow cytometry plots of BM LSK cells from mice of the indicated genotypes. Enhanced absolute numbers of total LSK cells and BM cellularity were observed in Tet2–/– Ob/Ob mice compared with mice in the other groups. (C) Representative flow cytometry plots of BM progenitors from mice of the indicated genotypes. Enhanced absolute numbers of total GMPs (Linc-KIT+CD16/CD32+CD34+) were observed in Tet2–/– Ob/Ob mice compared with mice in the other groups (n = 5–6 mice per group). Data are shown as the mean ± SEM. *P < 0.05, **P < 0.005, ***P < 0.0005, and ****P < 0.0001, by 1-way ANOVA.
Figure 4
Figure 4. Tet2 deficiency confers a competitive advantage to HSC/Ps in obese recipient mice.
(A) Schematic of the competitive BMT assay. Donor cells from Tet2–/– or WT mice were mixed with Boy/J cells, and a competitive BMT assay was performed using lethally irradiated WT or Ob/Ob mice as recipients. Donor-derived chimerism was observed using antibodies against CD45.1+ or CD45.2+. (B) Representative flow cytometry profiles for donor chimerism in the PB of recipient mice measured every 4 weeks, and quantification of CD45.2+ cells in the PB of the indicated recipient mice. (C) Representative flow cytometry profile of Gr-1+CD11b+ double-positive cells in the PB of the indicated recipient mice, and frequency of myeloid cells in the PB and BM and spleens of competitive transplant recipients over 22 weeks. (D) Representative flow cytometry plots of myeloid blasts (c-KIT+CD11b+ double-positive cells) and frequency of myeloid blast cells in the BM of competitive transplant recipients over 22 weeks. (E) PB smears from the indicated recipient mice 22 weeks after BMT. Scale bars: 50 μm. (F) Representative flow cytometry profile of LSK cells in the BM from the indicated recipient mice, and frequency of LSK cells in the BM of competitive transplant recipients over 22 weeks (n = 4 mice per group). Data are shown as the mean ± SEM. *P < 0.05, **P < 0.005, ***P < 0.0005, and ****P < 0.0001, by 1-way ANOVA. Freq., frequency.
Figure 5
Figure 5. Tet2+/– mutant pre-LHSCs/PCs outcompete WT cells and promote CH in obese recipient mice.
(A) Schematic of the competitive BMT assay. Donor BM cells (10%) from Tet2+/– mice were mixed with Boy/J BM cells (90%), and a competitive BMT assay was performed using lethally irradiated WT and Ob/Ob mice as recipients. Donor-derived chimerism was observed using antibodies against CD45.1+ or CD45.2+. (B) Representative flow cytometry profiles for donor chimerism (CD45.1+CD45.2+ cells) in the PB of recipient mice measured every 4 weeks, and quantification of CD45.2+ cells in the PB of the indicated recipient mice. (C) Representative flow cytometry profile of myeloid cells (Gr-1+CD11b+ cells) in the PB of the indicated recipient mice, and frequency of Gr-1+CD11b+ double-positive myeloid cells in PB and of CD11b+ myeloid cells in PB of competitive transplant recipients over 8 weeks. (D) Representative flow cytometry plots of lymphocytes (CD3+B220+ cells) from the indicated recipient mice, and frequency of B220+ B lymphocytes in the PB of competitive transplant recipients over 8 weeks. (EM) PB counts of (E) neutrophils, (F) monocytes, and (G) lymphocytes; percentages of (H) neutrophils, (I) monocytes, (J) lymphocytes, and (K) RDWs; and (L) RBC and (M) platelet counts in the indicated recipients 8 weeks after competitive BMT (n = 5 mice per group). Data are shown as the mean ± SEM. *P < 0.05, **P < 0.005, ***P < 0.0005, and ****P < 0.0001, by 2-tailed Student’s t test.
Figure 6
Figure 6. The Ca2+ signaling pathway is enriched in Ob/Ob mice bearing Tet2–/– cells.
(A) Heatmap of the expression of calcium channel–related genes in obese and WT mice bearing Tet2–/– cells. (B) WB analysis was performed to measure the protein levels of Nfatc3, Irg1, and IL-1β in BM cells from Tet2–/– Ob/Ob, Tet2–/–, Ob/Ob, and WT mice. (C) Expression of the Nfatc3 gene in Tet2–/– Ob/Ob compound mutant mice and control mice BM cells was detected by qRT-PCR. (D) HSC/Ps from Tet2–/– Ob/Ob, Tet2–/–, Ob/Ob, and WT mice were stimulated or not with 1 μm ionomycin, and Nfatc3 (green) localization was visualized by confocal microscopy. DAPI (red, pseudocolor) was used to stain the nucleus. Red arrow indicate nuclear translocation of Nfat3. Scale bars: 10 μM . The insets show the zoomed images (×2). (E and F) Quantification of the percentage of cells with nuclear Nfatc3 per high-power field using Fiji (ImageJ, NIH). (G) GSEA plot of gene sets related to the Ca2+/calcineurin-activated NFAT pathway that were upregulated in Ob/Ob mice bearing Tet2–/– cells compared with WT mice. NES, normalized enrichment score Data are shown as the mean ± SEM. *P < 0.05, **P < 0.005, ***P < 0.0005, and ****P < 0.0001, by 1-way ANOVA.
Figure 7
Figure 7. Obesity modulates Ca2+ levels in Tet2–/– HSC/Ps.
(A) Data from TARGET-AML (Survival Genie, https://bbisr.shinyapps.winship.emory.edu/SurvivalGenie/) were used to analyze the relationship between disease-free survival and NFATC3 expression in patients with AML. (B) Expression of the Irg1 gene in Tet2–/– Ob/Ob compound mutant mice and control mice BM cells was detected by qRT-PCR. (C) Quantification of 5-hmC levels in HSC/Ps derived from Tet2–/– Ob/Ob compound mutant mice compared with other groups. (DH) Quantification of intracellular Ca2+ levels in the global BM and different HSC/Ps compartments. BM cells were stained with Calbryte AM-520 and induced with 1 μM ionomycin and gated on LSK, HPC-1, LT-HSC, and GMP cell populations. Representative flow kinetics plots demonstrate the changes in Ca2+ flux in global BM cells (D) and quantification of Ca2+ levels in LSK cells (E), LT-HSCs (F), HPC-1 cells (G), and GMPs (H) in BM from mice of the indicated genotypes (n = 3–6 mice per group). Data are shown as the mean ± SEM. *P < 0.05, **P < 0.005, ***P < 0.0005, and ****P < 0.0001, by 1-way ANOVA.
Figure 8
Figure 8. Combination of metformin, nifedipine, MCC950, and anakinra treatment reduces Tet2–/– myeloid cells in Ob/Ob mice.
(A) Schematic of the competitive BMT assay and drug treatment. (B) Percentages of CD45.1, CD45.2, and myeloid Gr-1+/CD11b+ cells and B220+ B cells in the PB of the indicated recipients over 8 weeks of BMT, and body weights and fasting blood glucose levels in the indicated recipients over 8 weeks of BMT. (C) PB WBC, neutrophil, and monocyte counts in the indicated recipients after 30 days of the indicated drug treatments (n = 3–6 mice per group). Data are shown as the mean ± SEM. *P < 0.05, **P < 0.005, ***P < 0.0005, and ****P < 0.0001, by 2-tailed Student’s t test (B) or 1-way ANOVA (C).
Figure 9
Figure 9. Combination of metformin, nifedipine, MCC950, and anakinra treatment reduces splenomegaly and hyperglycemia.
(A) Spleen images, (B) spleen weights, (C) liver weights, (D) heart weights, (E) body weights, (F) fasting blood glucose levels, and (G) serum Ca2+ levels after 30 days of the indicated drug treatments (n = 3–6 mice per group). Data are shown as the mean ± SEM. *P < 0.05, **P < 0.005, ***P < 0.0005, and ****P < 0.0001, by 1-way ANOVA.
Figure 10
Figure 10. Effect of metformin, nifedipine, MCC950, and anakinra treatment on Tet2-deficient myeloid cells.
(A) Representative flow cytometry plots of donor chimerism (CD45.1+/CD45.2+) in the PB of recipient mice after 30 days of the indicated drug treatment and quantification of CD45.1+ cells in the PB, CD45.2+ cells in the PB, CD45.1+ cells in the BM, CD45.2+ cells in the BM, CD45.1+ cells in the spleen, and CD45.2+ cells in the spleen after 30 days of the indicated drug treatment. (B) Representative flow cytometry profile of myeloid cells (Gr-1+CD11b+) in the PB of recipient mice after 30 days of the indicated drug treatment and quantification of Gr-1+CD11b+ double-positive cells in the PB, BM, and spleen after 30 days of the indicated drug treatment (n = 3–6 mice per group). Data are shown as the mean ± SEM. *P < 0.05, **P < 0.005, ***P < 0.0005, and ****P < 0.0001, by 1-way ANOVA.
Figure 11
Figure 11. Effect of metformin, nifedipine, MCC950, and anakinra treatment on Tet2-deficient myeloid blasts and BM cellularity.
(A) Representative flow cytometry profile of myeloid blasts (c-KIT+CD11b+ double-positive cells) in the PB of recipient mice after 30 days of drug treatment and quantification of c-KIT+CD11b+ double-positive cells in the PB, BM, and spleen. (B) BM cellularity after 30 days of the indicated drug treatment (n = 3–6 mice per group). Data are shown as the mean ± SEM. **P < 0.005, ***P < 0.0005, and ****P < 0.0001, by 1-way ANOVA.
Figure 12
Figure 12. Effect of metformin, nifedipine, MCC950, and anakinra treatment on gene expression.
(A) Heatmap of DEGs related to Ca2+ signaling pathway after 30 days of the indicated drug treatment. (BF) WB analysis was performed to measure the protein levels of Nfatc3, Irg1, and Il-1β (p17 and pro–Il-1β) after 30 days of the indicated drug treatment. Data are shown as the mean ± SEM. *P < 0.05, **P < 0.005, and ****P < 0.0001, by 1-way ANOVA. (GI) Heatmaps of DEGs of proinflammatory factors, chemokines, cell-adhesion molecules, and insulin signaling pathway genes after 30 days of the indicated drug treatment. (J and K) GSEA plots of gene sets related to AML (J) and the chemokine signaling pathway (K) after 30 days of the indicated drug treatment.

Similar articles

  • Clonal hematopoiesis and inflammation in the vasculature: CHIVE, a prospective, longitudinal clonal hematopoiesis cohort and biorepository.
    Shannon ML, Heimlich JB, Olson S, Debevec A, Copeland Z, Kishtagari A, Vlasschaert C, Snider C, Silver AJ, Brown D, Spaulding T, Bhatta M, Pugh K, Stockton SS, Ulloa J, Xu Y, Baljevic M, Moslehi J, Jahangir E, Ferrell PB, Slosky D, Bick AG, Savona MR. Shannon ML, et al. Blood Adv. 2024 Jul 9;8(13):3453-3463. doi: 10.1182/bloodadvances.2023011510. Blood Adv. 2024. PMID: 38608257 Free PMC article.
  • Tumor-Infiltrating Clonal Hematopoiesis.
    Pich O, Bernard E, Zagorulya M, Rowan A, Pospori C, Slama R, Huerga Encabo H, O'Sullivan J, Papazoglou D, Anastasiou P, Iliakis CS, Clark SA, Dijkstra KK, Barbè V, Bailey C, Stonestrom AJ, Enfield KSS, Green M, Brierley CK, Magness A, Pearce DR, Hynds RE, Zaidi R, Rane JK, Álvarez-Prado ÁF, Thol K, Scott R, Bola SK, Hoxha E, Harris SK, Peggs KS, Quezada SA, Hackshaw A, Zaccaria S, Joyce JA, Malanchi I, Berger MF, Jamal-Hanjani M, Wack A, Downward J, Grey W, Lo Celso C, Grönroos E, Rudin CM, Mead AJ, Bonnet D, Papaemmanuil E, Swanton C. Pich O, et al. N Engl J Med. 2025 Apr 24;392(16):1594-1608. doi: 10.1056/NEJMoa2413361. N Engl J Med. 2025. PMID: 40267425 Free PMC article.
  • Clonal hematopoiesis of indeterminate potential and cardiovascular disease.
    Saadatagah S, Ballantyne CM. Saadatagah S, et al. Transl Res. 2023 May;255:152-158. doi: 10.1016/j.trsl.2022.08.013. Epub 2022 Sep 5. Transl Res. 2023. PMID: 36067904 Free PMC article. Review.
  • Age-related micro-environmental changes as drivers of clonal hematopoiesis.
    Bacharach T, Kaushansky N, Shlush LI. Bacharach T, et al. Curr Opin Hematol. 2024 Mar 1;31(2):53-57. doi: 10.1097/MOH.0000000000000798. Epub 2023 Dec 15. Curr Opin Hematol. 2024. PMID: 38133628 Review.
  • Clonal Hematopoiesis of Indeterminate Potential (CHIP) and Incident Type 2 Diabetes Risk.
    Tobias DK, Manning AK, Wessel J, Raghavan S, Westerman KE, Bick AG, Dicorpo D, Whitsel EA, Collins J, Correa A, Cupples LA, Dupuis J, Goodarzi MO, Guo X, Howard B, Lange LA, Liu S, Raffield LM, Reiner AP, Rich SS, Taylor KD, Tinker L, Wilson JG, Wu P, Carson AP, Vasan RS, Fornage M, Psaty BM, Kooperberg C, Rotter JI, Meigs J, Manson JE; TOPMed Diabetes Working Group and National Heart, Lung, and Blood Institute TOPMed Consortium. Tobias DK, et al. Diabetes Care. 2023 Nov 1;46(11):1978-1985. doi: 10.2337/dc23-0805. Diabetes Care. 2023. PMID: 37756531 Free PMC article.

Cited by

References

    1. Jaiswal S, et al. Age-related clonal hematopoiesis associated with adverse outcomes. N Engl J Med. 2014;371(26):2488–2498. doi: 10.1056/NEJMoa1408617. - DOI - PMC - PubMed
    1. Jaiswal S, et al. Clonal hematopoiesis and risk of atherosclerotic cardiovascular disease. N Engl J Med. 2017;377(2):111–121. doi: 10.1056/NEJMoa1701719. - DOI - PMC - PubMed
    1. Fuster JJ, Walsh K. Somatic mutations and clonal hematopoiesis: unexpected potential new drivers of age-related cardiovascular disease. Circ Res. 2018;122(3):523–532. doi: 10.1161/CIRCRESAHA.117.312115. - DOI - PMC - PubMed
    1. Köhnke T, Majeti R. Clonal hematopoiesis: from mechanisms to clinical intervention. Cancer Discov. 2021;11(12):2987–2997. doi: 10.1158/2159-8290.CD-21-0901. - DOI - PMC - PubMed
    1. Beerman I, et al. Functionally distinct hematopoietic stem cells modulate hematopoietic lineage potential during aging by a mechanism of clonal expansion. Proc Natl Acad Sci U S A. 2010;107(12):5465–5470. doi: 10.1073/pnas.1000834107. - DOI - PMC - PubMed

Publication types