. 2023 May 22;8(10):e169162.
doi: 10.1172/jci.insight.169162.

Gene augmentation of LCA5-associated Leber congenital amaurosis ameliorates bulge region defects of the photoreceptor ciliary axoneme

Affiliations

Gene augmentation of LCA5-associated Leber congenital amaurosis ameliorates bulge region defects of the photoreceptor ciliary axoneme

Siebren Faber et al. JCI Insight. .

Abstract

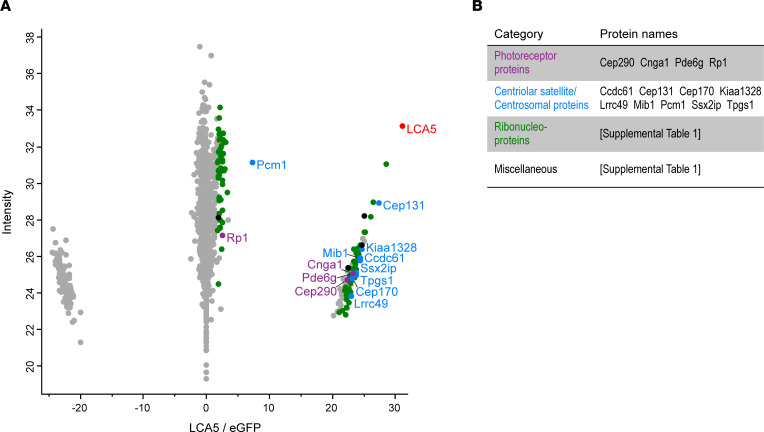
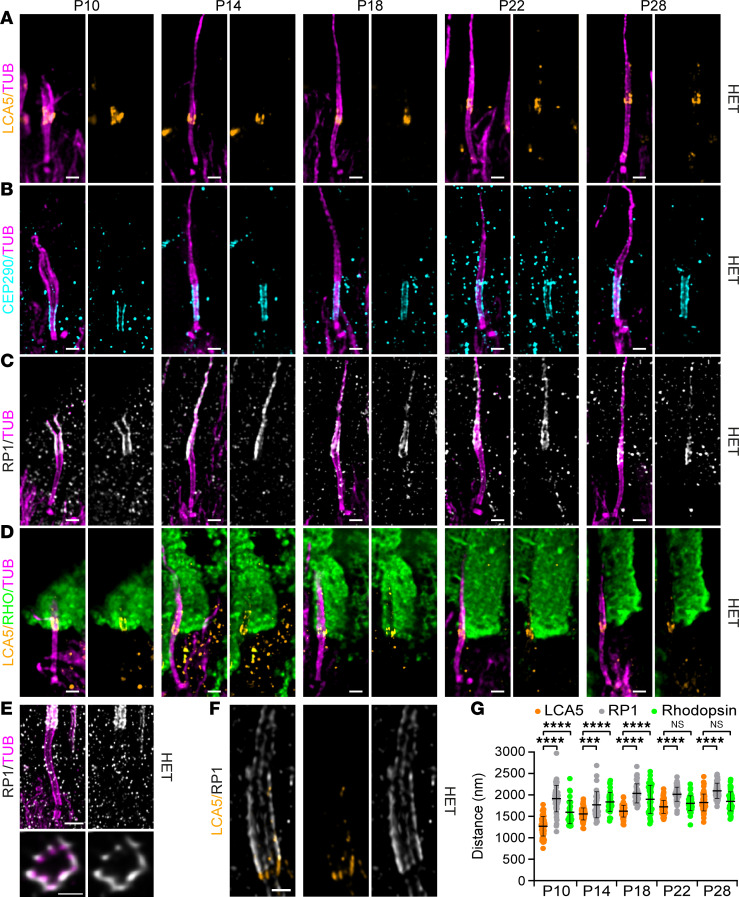
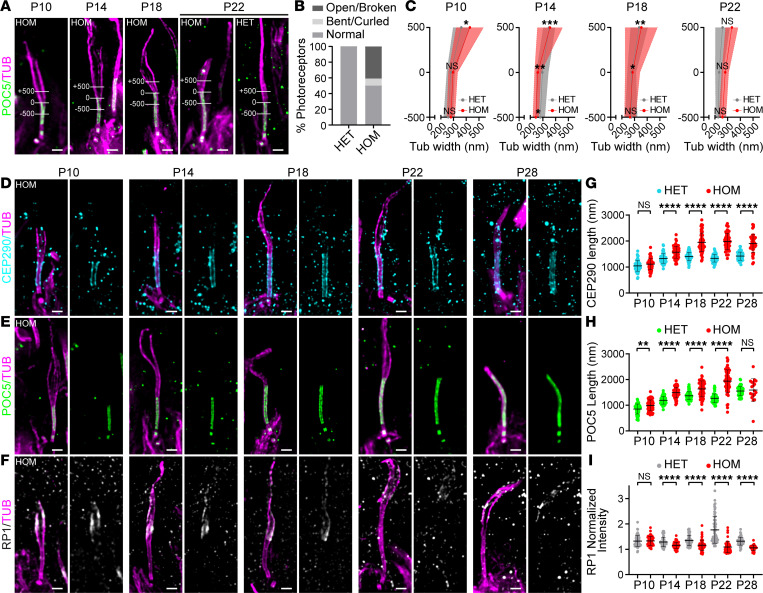
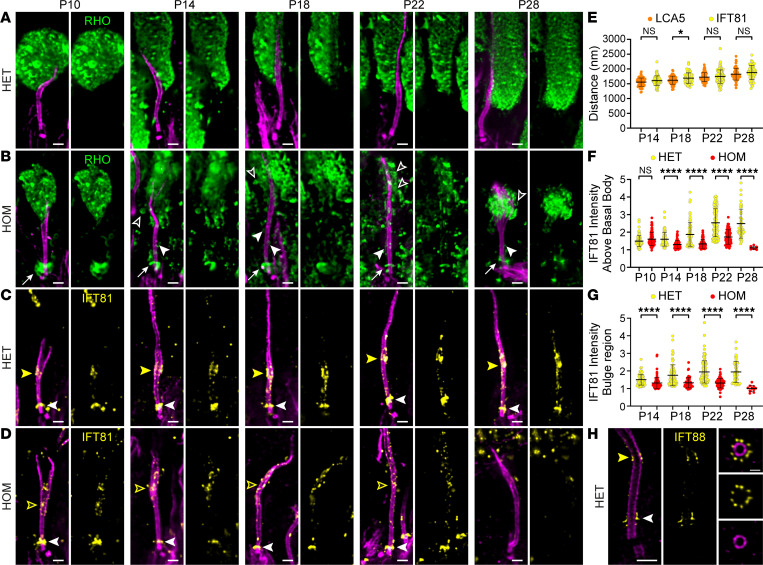
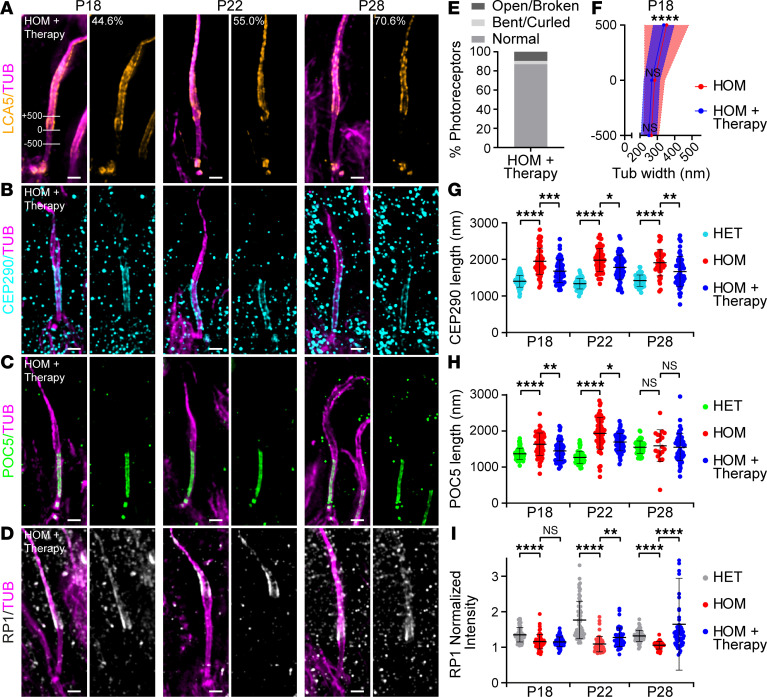
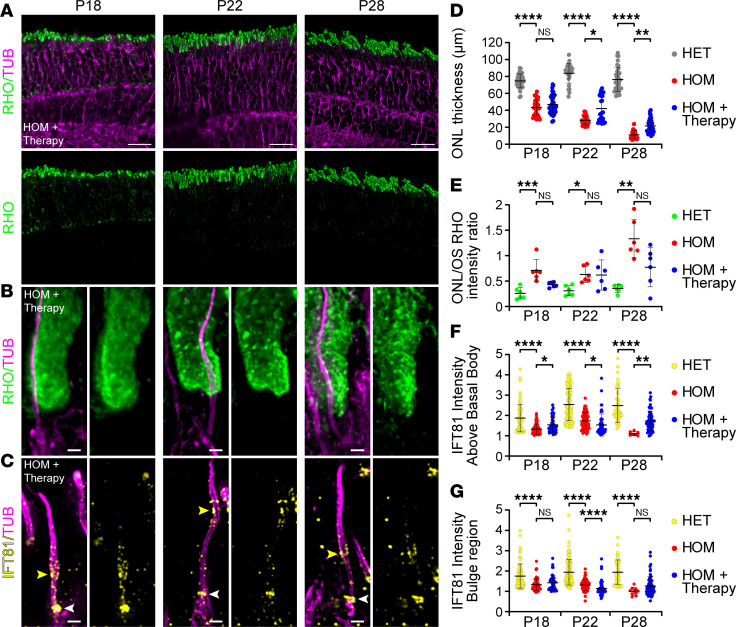
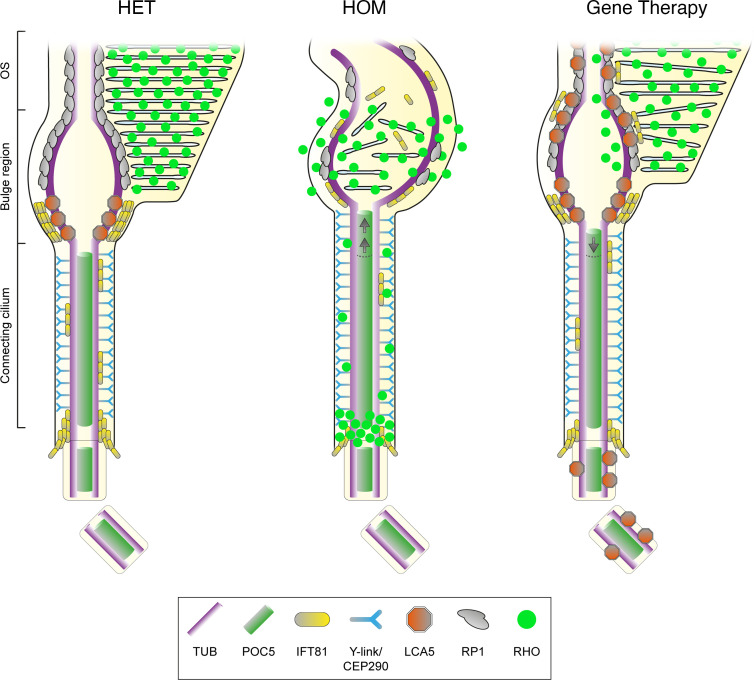
Leber congenital amaurosis (LCA) is a group of inherited retinal diseases characterized by early-onset, rapid loss of photoreceptor cells. Despite the discovery of a growing number of genes associated with this disease, the molecular mechanisms of photoreceptor cell degeneration of most LCA subtypes remain poorly understood. Here, using retina-specific affinity proteomics combined with ultrastructure expansion microscopy, we reveal the structural and molecular defects underlying LCA type 5 (LCA5) with nanoscale resolution. We show that LCA5-encoded lebercilin, together with retinitis pigmentosa 1 protein (RP1) and the intraflagellar transport (IFT) proteins IFT81 and IFT88, localized at the bulge region of the photoreceptor outer segment (OS), a region crucial for OS membrane disc formation. Next, we demonstrate that mutant mice deficient in lebercilin exhibited early axonemal defects at the bulge region and the distal OS, accompanied by reduced levels of RP1 and IFT proteins, affecting membrane disc formation and presumably leading to photoreceptor death. Finally, adeno-associated virus-based LCA5 gene augmentation partially restored the bulge region, preserved OS axoneme structure and membrane disc formation, and resulted in photoreceptor cell survival. Our approach thus provides a next level of assessment of retinal (gene) therapy efficacy at the molecular level.

Keywords: Cell Biology; Gene therapy; Genetics; Molecular genetics; Retinopathy.


Figures

Figure 1
Figure 1. Identification and clustering of potential lebercilin interactors.
(A) Scatterplot showing enriched proteins, comparing AAV-LCA5–injected retinas to AAV-eGFP–injected (control) retinas in Lca5gt/gt (HOM) mice. The bait protein lebercilin (LCA5) is shown in red. Significantly enriched proteins (P < 0.05 by Student’s t test and FDR < 0.05 by significance A test) are categorized into different groups based on their function, including photoreceptor-associated proteins (purple), centriolar satellite/centrosomal proteins (blue), ribonucleoproteins (green), and miscellaneous (black). X axis represents log2 ratio between AAV-LCA5–injected and AAV-eGFP–injected (control) retinas. Y axis represents the intensity score, indicating the relative amounts of proteins in the data set. There were 15 mice per biological replicate (n = 5). (B) Table showing the significant proteins categorized in different groups, based on their function. Original data are listed in Supplemental Table 1.
Figure 2
Figure 2. Nanoscale mapping of lebercilin.
(AD) Widefield (original magnification, 63×) images of expanded photoreceptors stained for tubulin (magenta) and lebercilin (LCA5; orange, A), CEP290 (cyan, B), RP1 (white/gray, C), or LCA5/rhodopsin (orange/green, D) from P10 to P28 in Lca5+/gt (HET) mice. Scale bars: 500 nm. (E) Confocal U-ExM images of adult photoreceptor stained for tubulin (magenta) and RP1 (white/gray). Lower panels show transversal view of the bulge region. Scale bars: 500 nm (side view), 200 nm (transversal view). (F) Confocal U-ExM image of adult photoreceptor stained for LCA5 (orange) and RP1 (white/gray). Scale bar: 200 nm. (G) Quantification of the distance of LCA5 (orange), RP1 (white/gray), and rhodopsin (green) signal proximal ends to the mother centriole proximal end from P10 to P28. Three animals per time point. Data presented as mean ± SD; n = 35–80. ***P < 0.001, ****P < 0.0001 by Kruskal-Wallis test with Dunn’s multiple-comparison test.
Figure 3
Figure 3. Effect of lebercilin loss on bulge formation, distal axoneme organization, and CC length.
(A) Widefield (original magnification, 63×) images of expanded photoreceptors stained for POC5 (green) and tubulin (magenta) from P10 to P22 in Lca5gt/gt (HOM) mice and in P22 Lca5+/gt (HET) mice. Lines in images illustrate the measurements used in C of tubulin width at 3 locations: +500 nm, 0 nm, −500 nm. The distal end of CC inner scaffold marker POC5 was used to set the 0 location. Scale bars: 500 nm. (B) Distal axoneme (above CC) conformations of HET versus HOM photoreceptors at P18 and P22 indicated in percentages. Photoreceptor distal axoneme conformations: normal (HET: 99.6%; HOM: 50.2%), open/broken (HET: 0.4%; HOM: 40.8%), and bent/curled (HET: 0%; HOM: 9%). n = 247 (HET), n = 217 (HOM). (C) Tubulin width measurements of the photoreceptor at the 3 locations depicted in A from P10 to P22. Average tubulin width at each location is indicated by a gray or red dot for HET and HOM, respectively. P28 not included, since most of the distal axonemes are lost at this time point. Only photoreceptors that were stained for tubulin and POC5 were used for the measurements. Three animals per time point. Data presented as mean ± SD; n = 16–29. *P < 0.05, **P < 0.01, ***P < 0.001 by F test. Significance represents the tubulin width dispersion between HET and HOM. (DF) Widefield (original magnification, 63×) images of expanded photoreceptors stained for tubulin (magenta) and CEP290 (cyan, D), POC5 (green, E), or RP1 (white/gray, F) from P10 to P28 in HOM mice. Scale bars: 500 nm. (GI) Impact of lebercilin loss on CEP290 length (G), CC inner scaffold length (POC5, H), or RP1-normalized intensity at the bulge region (I) from P10 to P28. Three animals per time point. Data presented as mean ± SD; n = 39–65 (G), n = 19–60 (H), n = 39–72 (I). **P < 0.01, ****P < 0.0001 by Mann-Whitney test.
Figure 4
Figure 4. Effect of lebercilin loss on OS formation and intraflagellar transport.
(A and B) Widefield (original magnification, 63×) images of expanded photoreceptors stained for tubulin (magenta) and rhodopsin (green) from P10 to P28 in Lca5+/gt (HET) (A) and Lca5gt/gt (HOM) (B) mice. White arrows indicate accumulation of rhodopsin above the basal body. White arrowheads indicate rhodopsin along the CC. Open white arrowheads indicate rhodopsin in vesicle-like structures. Scale bars: 500 nm. (C and D) Widefield (original magnification, 63×) images of expanded photoreceptors stained for tubulin (magenta) and IFT81 (yellow) from P10 to P28 in HET (C) and HOM (D) mice. White arrowheads indicate IFT81 localization above the basal body. Closed and open yellow arrowheads indicate IFT81 localization at the bulge region in HET and HOM, respectively. Scale bars: 500 nm. (E) Quantification of the distance of lebercilin (LCA5; orange; same values as in Figure 2G) and IFT81 bulge region (yellow) signal proximal ends to the mother centriole proximal end from P14 to P28. P10 not included, since the bulge region is not properly formed yet at this time point. Three animals per time point. Data presented as mean ± SD; n = 62–113. *P < 0.05 by Mann-Whitney test. (F and G) Impact of LCA5 loss on IFT81-normalized intensity above the basal body (F) or at the bulge region (G) from P10 to P28. P10 not included for IFT81 intensity at the bulge region, since it is not properly formed yet at this time point. Three animals per time point. Data presented as mean ± SD; n = 8–113 (F), n = 10–113 (G). ****P < 0.0001 by Mann-Whitney test. (H) Confocal U-ExM images of adult photoreceptor stained for tubulin (magenta) and IFT88 (yellow). Right panels show transversal view of the bulge region. White arrowhead indicates IFT88 localization above the basal body. Yellow arrowhead indicates IFT88 localization at the bulge region. Scale bars: 500 nm (side view), 200 nm (transversal view).
Figure 5
Figure 5. Effect of AAV-LCA5 gene augmentation therapy on distal axoneme organization and CC length.
(AD) Widefield (original magnification, 63×) images of expanded photoreceptors stained for tubulin (magenta) and lebercilin (LCA5; orange, A), CEP290 (cyan, B), POC5 (green, C), or RP1 (white/gray, D) from P18 to P28 in AAV-LCA5 gene therapy–treated Lca5gt/gt mice (HOM + Therapy). Lines in P18 LCA5 image (A) illustrate measurements shown in F of tubulin width at 3 locations: +500 nm, 0 nm, −500 nm. The proximal end of the LCA5 signal was used to set the 0 location. A indicates the percentage of photoreceptors that express LCA5 at each time point (n = 109–184). Three animals per time point. Scale bars: 500 nm. (E) Distal axoneme (above CC) conformations of HOM + Therapy photoreceptors from P18 to P28 indicated in percentages. Photoreceptor distal axoneme conformations: normal (87%), open/broken (9.6%), and bent/curled (3.4%). n = 146. (F) Tubulin width measurements of P18 HOM photoreceptors, gene therapy treated versus nontreated, at the 3 locations depicted in A. Average tubulin width at each location is indicated by a red or blue dot for HOM and HOM + Therapy, respectively. Only photoreceptors that express LCA5 were used for the measurements. HOM measurements correspond to the data presented in Figure 3C. Three animals per time point. Data presented as mean ± SD; n = 27–37. ****P < 0.0001 by F test. Significance represents tubulin width dispersion between HOM and HOM + Therapy. (GI) Impact of AAV-LCA5 gene therapy on CEP290 length (G), CC inner scaffold length (POC5, H), or RP1-normalized intensity at the bulge region (I) from P18 to P28. HET and HOM measurements correspond to the data in Figure 3, G–I. Three animals per time point. Data presented as mean ± SD; n = 39–65 (G), n = 19–60 (H), n = 39–62 (I). *P < 0.05, **P < 0.01, ***P < 0.001, ****P < 0.0001 by Kruskal-Wallis test with Dunn’s multiple-comparison test.
Figure 6
Figure 6. Effect of AAV-LCA5 gene augmentation therapy on OS formation and intraflagellar transport.
(A) Low-magnification (original magnification, 20×) widefield images of expanded Lca5gt/gt (HOM) retinas, treated with AAV-LCA5 gene therapy (HOM + Therapy), showing rod OS restoration from P18 to P28 by staining with rhodopsin (green) and tubulin (magenta). Scale bars: 20 μm. (B and C) Widefield (original magnification, 63×) images of expanded photoreceptors stained for tubulin (magenta) and rhodopsin (green, B) or IFT81 (yellow, C) from P18 to P28 in AAV-LCA5 gene therapy–treated HOM mice. White arrowheads in C indicate IFT81 localization above the basal body. Yellow arrowheads in C indicate IFT81 localization at the bulge region. Scale bars: 500 nm. (DG) Impact of AAV-LCA5 gene therapy on outer nuclear layer (ONL) thickness (D), ONL/OS rhodopsin intensity ratio (E), IFT81-normalized intensity above the basal body (F), or IFT81-normalized intensity at the bulge region (G) from P18 to P28. Note that HET and HOM measurements in F and G correspond to data in Figure 4, F and G. Three animals per time point. Data presented as mean ± SD; n = 28–36 (D), n = 6 (E), n = 8–113 (F), n = 10–113 (G). *P < 0.05, **P < 0.01, ***P < 0.001, ****P < 0.0001 by Kruskal-Wallis test with Dunn’s multiple-comparison test.
Figure 7
Figure 7. Schematic representation of Lca5+/gt (HET), Lca5gt/gt (HOM), and gene therapy–treated photoreceptors.
In unaffected HET photoreceptors (left), lebercilin (LCA5; orange) localizes predominantly at the proximal part of the bulge region, between CEP290 (cyan, at the level of the Y-links) and RP1 (gray, distal axonemal protein). IFT81 (yellow) localizes to the same bulge proximal region as LCA5, but also accumulates above the basal body and to a lesser extent along the CC. In HOM photoreceptors (middle), the CC is extended, as illustrated by an elongated CEP290 and POC5 (green) signal. Furthermore, bulge formation and distal axoneme organization is disrupted, leading to rhodopsin (RHO, bright green) mis-trafficking, with accumulation above the basal body, localization along the CC, and inside vesicle-like structures. Moreover, LCA5 loss leads to decreased levels of IFT81 and RP1 at the bulge region and more dispersed localization along the distal axoneme. AAV-LCA5 gene augmentation therapy (right) partially restores bulge formation, CC and distal axoneme organization, as well as RP1 and rhodopsin localization. IFT81 localization is restored to a lesser extent, possibly explained by the ectopic LCA5 expression along the distal axoneme.

Similar articles

Cited by

References

    1. den Hollander AI, et al. Mutations in LCA5, encoding the ciliary protein lebercilin, cause Leber congenital amaurosis. Nat Genet. 2007;39(7):889–895. doi: 10.1038/ng2066. - DOI - PubMed
    1. den Hollander Anneke IA. Leber congenital amaurosis: genes, proteins and disease mechanisms. Prog Retin Eye Res. 2008;27(4):391–419. doi: 10.1016/j.preteyeres.2008.05.003. - DOI - PubMed
    1. Osterberg G. Topography of the layer of rods and cones in the human retina. Acta Ophthalmol Suppl. 1935;6:1–103.
    1. May-Simera H, et al. Cilia - The sensory antennae in the eye. Prog Retin Eye Res. 2017;60:144–180. doi: 10.1016/j.preteyeres.2017.05.001. - DOI - PubMed
    1. Ostrowski LE, et al. A proteomic analysis of human cilia: identification of novel components. Mol Cell Proteomics. 2002;1(6):451–465. doi: 10.1074/mcp.M200037-MCP200. - DOI - PubMed

Publication types

Supplementary concepts