. 2023 Jun 1;133(11):e164222.
doi: 10.1172/JCI164222.

WNK1 promotes water homeostasis by acting as a central osmolality sensor for arginine vasopressin release

Affiliations

WNK1 promotes water homeostasis by acting as a central osmolality sensor for arginine vasopressin release

Xin Jin et al. J Clin Invest. .

Abstract

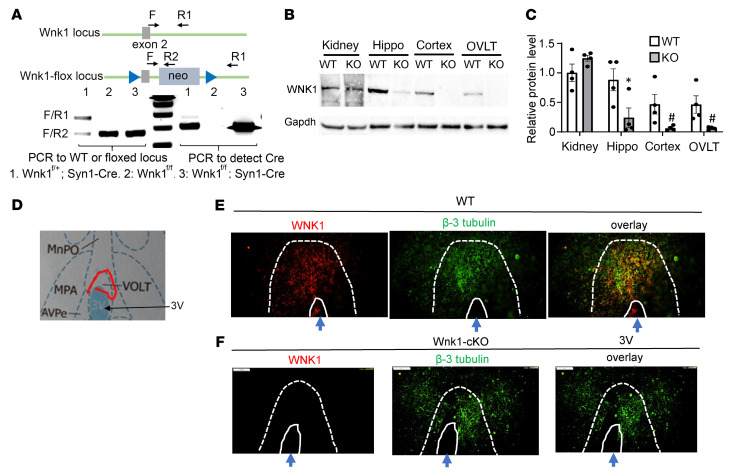
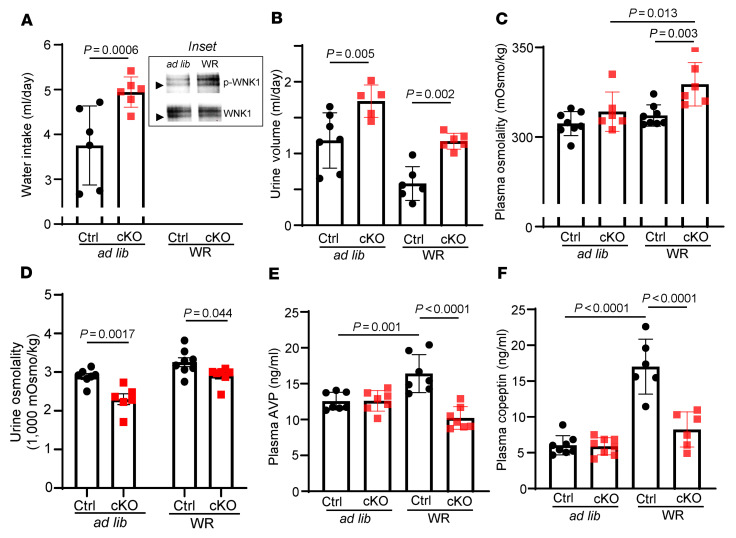
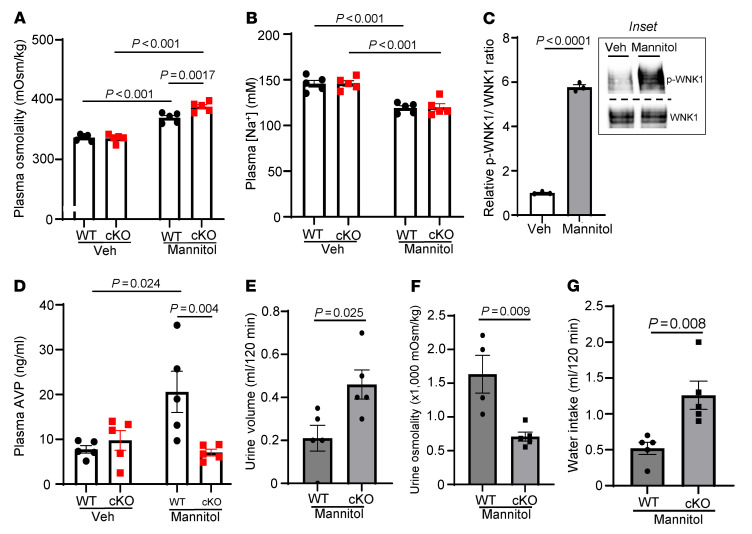
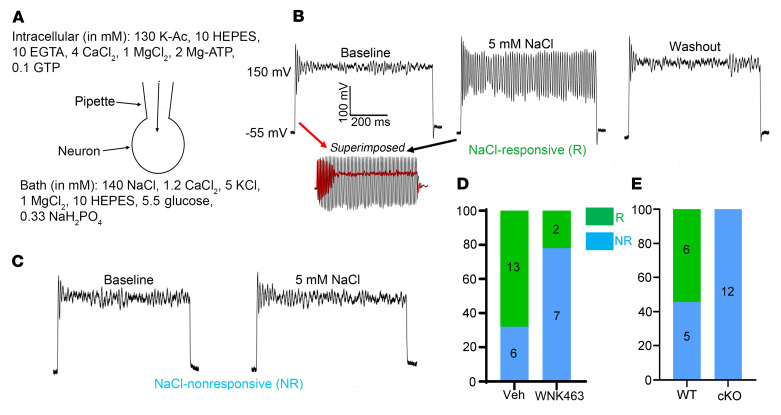
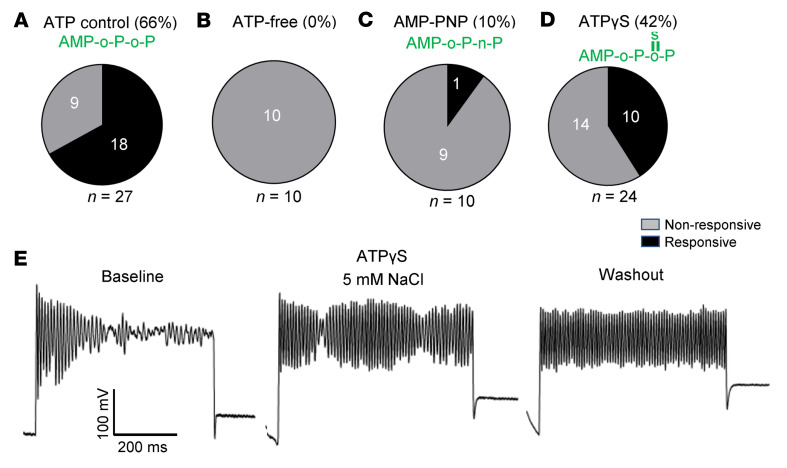
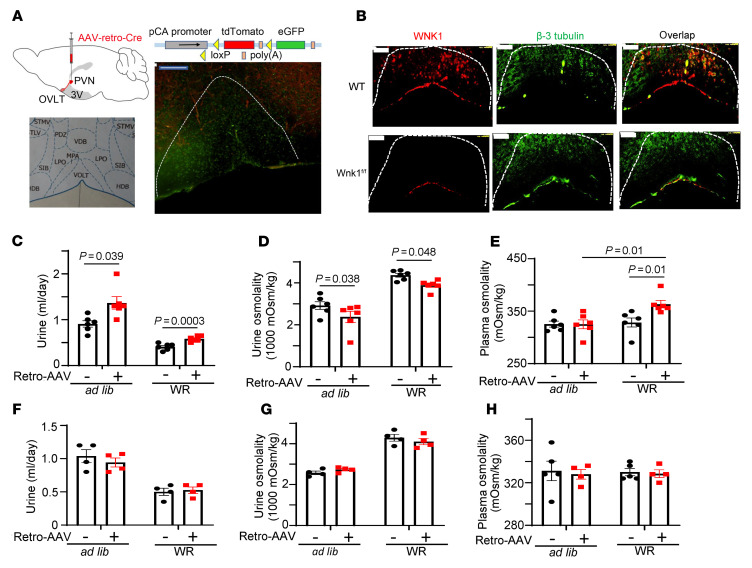
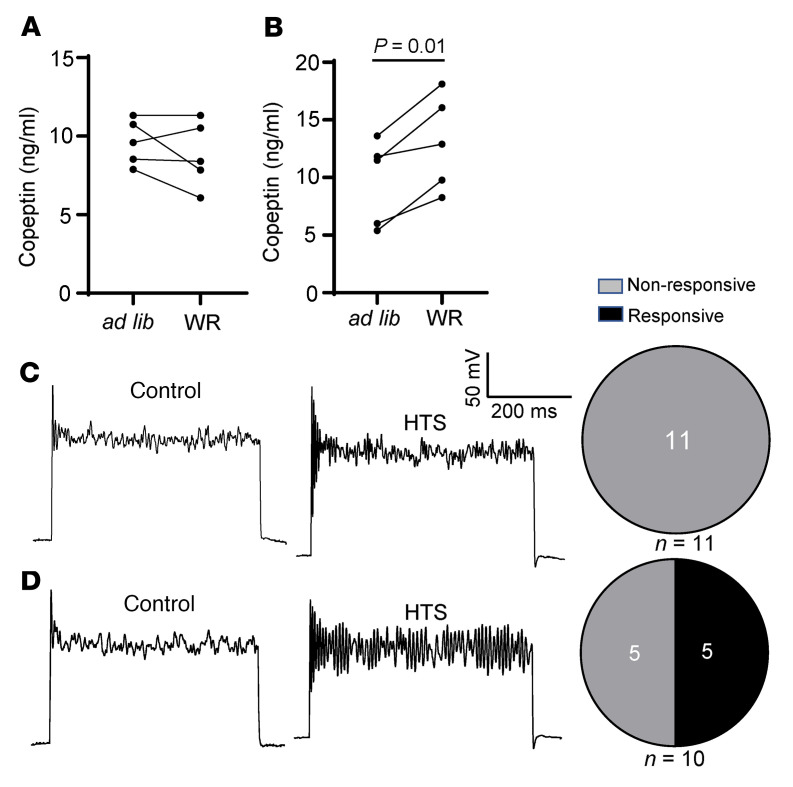
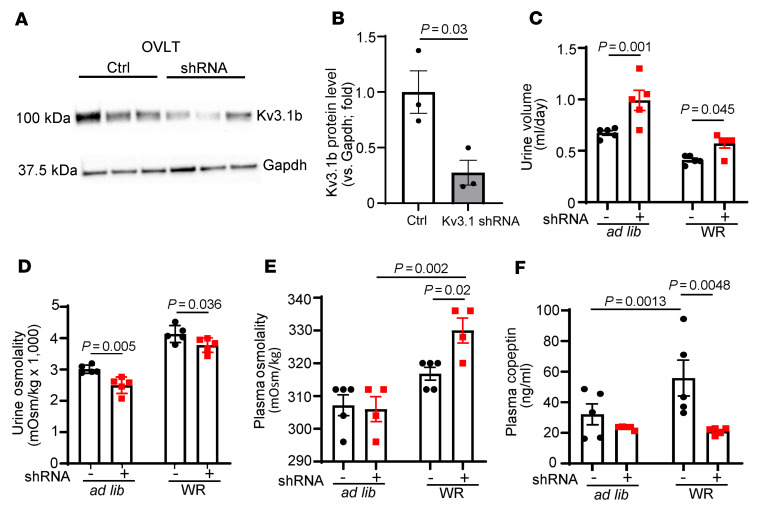
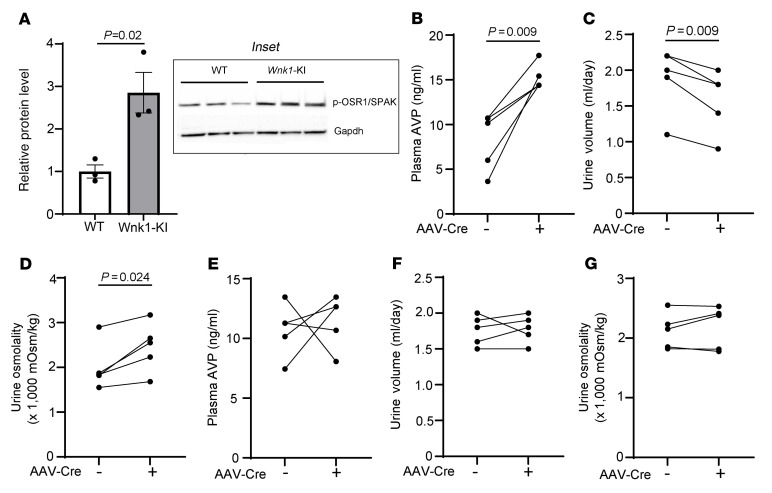
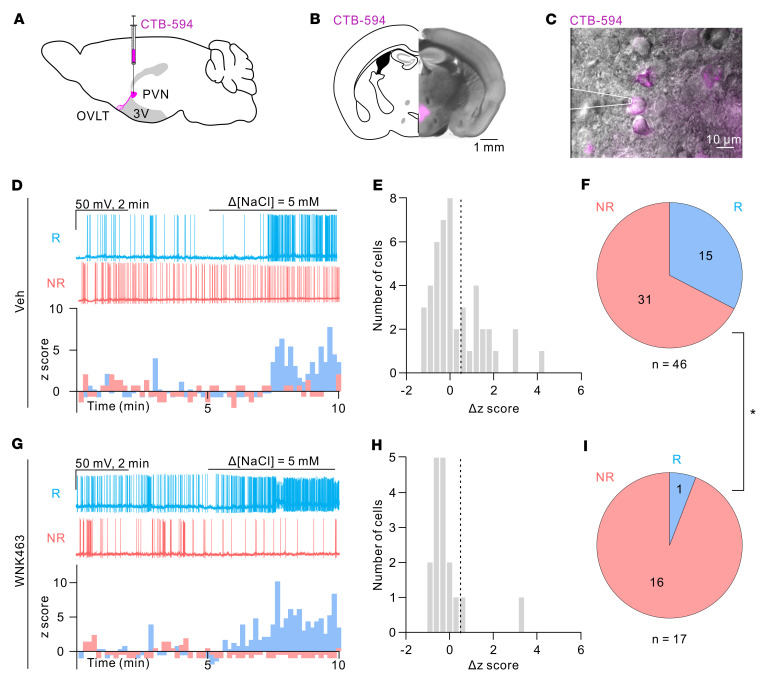
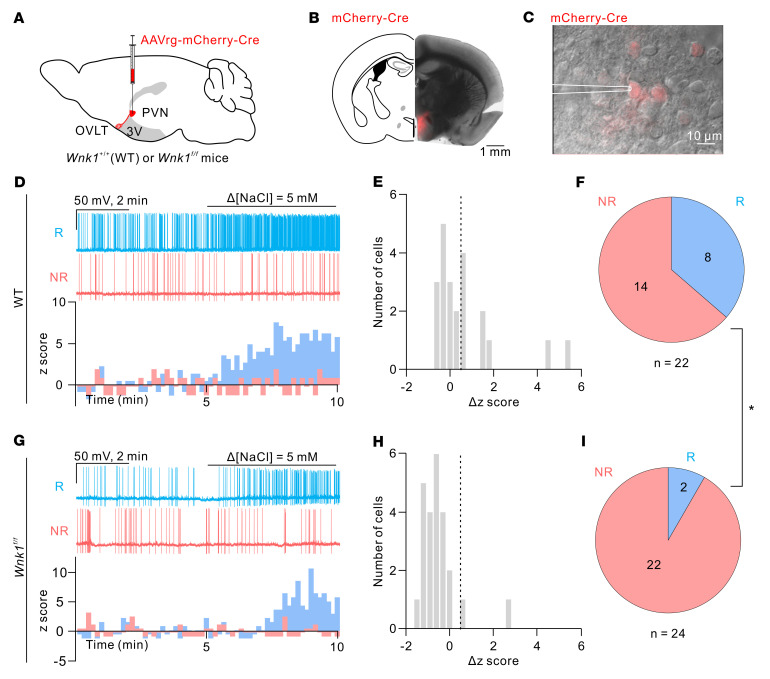
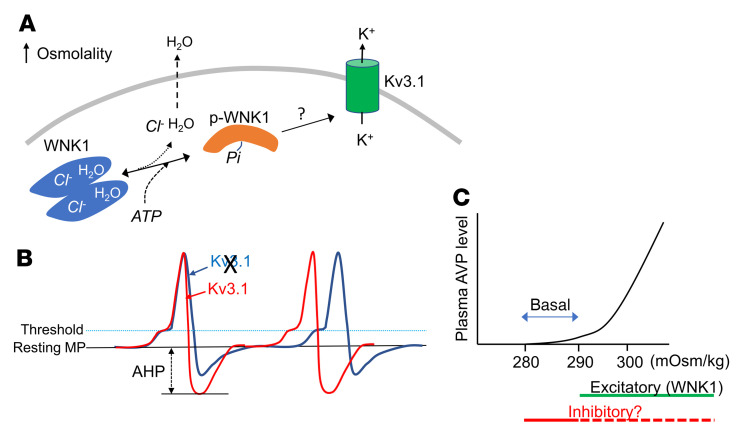
Maintaining internal osmolality constancy is essential for life. Release of arginine vasopressin (AVP) in response to hyperosmolality is critical. Current hypotheses for osmolality sensors in circumventricular organs (CVOs) of the brain focus on mechanosensitive membrane proteins. The present study demonstrated that intracellular protein kinase WNK1 was involved. Focusing on vascular-organ-of-lamina-terminalis (OVLT) nuclei, we showed that WNK1 kinase was activated by water restriction. Neuron-specific conditional KO (cKO) of Wnk1 caused polyuria with decreased urine osmolality that persisted in water restriction and blunted water restriction-induced AVP release. Wnk1 cKO also blunted mannitol-induced AVP release but had no effect on osmotic thirst response. The role of WNK1 in the osmosensory neurons in CVOs was supported by neuronal pathway tracing. Hyperosmolality-induced increases in action potential firing in OVLT neurons was blunted by Wnk1 deletion or pharmacological WNK inhibitors. Knockdown of Kv3.1 channel in OVLT by shRNA reproduced the phenotypes. Thus, WNK1 in osmosensory neurons in CVOs detects extracellular hypertonicity and mediates the increase in AVP release by activating Kv3.1 and increasing action potential firing from osmosensory neurons.

Keywords: Endocrinology; Epithelial transport of ions and water; Ion channels; Nephrology; Transport.


Conflict of interest statement

Conflict of interest: The authors have declared that no conflict of interest exists.

Figures

Figure 1
Figure 1. Neuron-specific conditional KO of Wnk1 markedly reduces WNK1 in brain regions, including OVLT.
(A) Genotyping of Wnk1-cKO mice mediated by neuron-specific Syn1-Cre. Genomic tail-clip DNA was used for analysis. Lane 1, Wnk1fl/+;Syn1-Cre; lane 2, Wnk1fl/fl; lane 3, Wnk1fl/fl;Syn1-Cre. PCR is shown to detect WT vs. Wnk1fl/fl locus (exon 2 and neo cassette are floxed). PCR forward primer F is located at exon 2. Reverse primers R1 and R2 are located at intron 2 and neo cassette, respectively. Note that Syn1-Cre is only active in neurons, so unexcised Wnk1fl/fl locus is detected in tail-clip DNA. With large size neo cassette in the floxed locus, the F/R1 primer set does not amplify under the condition of PCR reaction. Additionally, PCR is shown to detect Syn1-Cre using Cre-specific primers. (B) Representative Western blot of WNK1 protein in WT and cKO brain regions shown relative to the kidney. Hippo, hippocampus. Cortex, cerebral cortex. (C) Quantitation (mean ± SEM) of 4 separate experiments, as shown in B. One WT and cKO mouse for each experiment. WNK1 was normalized to Gapdh and compared with the WT kidney (set as “1”). *P < 0.05, #P < 0.01, KO vs. WT by unpaired t test. (D) Atlas of brain section for immunofluorescent staining, as in E and F. OVLT (also known as vascular-organ-of-lamina-terminalis [VOLT]) is marked by a red line. 3V, third ventricle; MnPO, median preoptic nucleus; MPA, medial preoptic area. (E and F) Immunofluorescent staining of WNK1 in OVLT neurons colocalized with neuronal marker β-3 tubulin in WT (E) and cKO (F) mice. Scale bar: 100 μm.
Figure 2
Figure 2. Wnk1-cKO mice exhibit partial central diabetes insipidus with impaired AVP and copeptin release in response to water restriction.
(A) Water intake, (B) urine volume, (C) plasma osmolality, (D) urine osmolality, (E) plasma AVP level, and (F) copeptin level of control (Ctrl) and cKO mice at either ad libitum water intake or after 24-hour water restriction (WR). The inset in A shows Western blotting analysis of abundance of total and phospho-WNK1 (p-WNK1) using antibody against total WNK1 and against S382 phospho-WNK1. Arrowheads indicate molecular size 250 kDa. Lysates from WT OVLT tissue at ad libitum water intake and after 24-hour water restriction were immunoprecipitated by anti-WNK1 antibody and probed by anti-WNK1 and anti-p-WNK1 antibody. Representative of 4 separate experiments. Each experiment consists of 1 mouse ad libitum and 1 mouse on water restriction. For statistical analysis was performed with 2-way repeated ANOVA with Šidák post hoc analysis; for statistical analysis of the inset in A, unpaired 2-tailed t test was performed. For bar graphs, n = 6–8 mice, as indicated in scatter plots.
Figure 3
Figure 3. Wnk1 deletion impairs hyperosmolality-induced AVP release but not osmotic thirst.
(A) Plasma osmolality, (B) [Na+], (C) relative p-WNK1/WNK1 ratio in OVLT, (D) plasma AVP, (E) urine volume, (F) urine osmolality, and (G) water intake in WT and Wnk1-cKO mice after mannitol or vehicle injection. Urine volume and water intake were measured 120 minutes after injection. Other measurements were taken 30 minutes after injection in separate mice from those in which urine and water intake were measured. The inset in C is representative of 3 experiments. Each experiment consists of 1 mouse injected with vehicle and 1 mouse injected with mannitol. Statistical analysis in A, B, and D was performed with 2-way repeated ANOVA with Šidák post hoc analysis; otherwise, unpaired t test was used. For bar graphs in A, B, DG, n = 5 mice for each experimental condition, as indicated in scatter plot.
Figure 4
Figure 4. Hypertonicity induces membrane potential oscillation in freshly isolated OVLT neurons mediated by WNK1.
(A) Ruptured whole-cell current-clamp recording for membrane potentials. Pipette and bath solution are indicated. (B and C) Membrane potentials of freshly isolated OVLT neurons at baseline, after incubation with 5 mM NaCl for 3 minutes and 5 minutes after washout of 5 mM NaCl hypertonicity. 600 pA currents were injected to depolarize membrane potential from the resting potential –55 mV to +150 mV. B and C represent examples of NaCl-responsive and nonresponsive neurons, respectively. (D) Treatment with pan-WNK kinase inhibitor (WNK463). Green and cyan bars indicate responsive (R) and nonresponsive (NR), respectively. WNK463 treatment significantly decreased the percentage distribution of responsive neurons vs. vehicle (Veh) treatment. P < 0.01, WNK463 vs. Veh, by 2-tailed Fisher’s exact test. (E) Wnk1-cKO eliminated NaCl responsiveness. P < 0.01, cKO vs. WT, by 2-tailed Fisher’s exact test. In D and E, OVLT neurons were isolated form 4–5 mice for vehicle-treated, WNK463-treated, WT, and cKO groups.
Figure 5
Figure 5. Effects of removal of intracellular ATP or substitution by ATP analogs on hypertonicity-induced membrane potential oscillation.
Whole-cell patch-clamp recordings were performed as in Figure 3, with the exception that ATP in the pipette was removed or replaced as indicated. [Mg2+] was kept constant. (A) Control experiments with 2 mM ATP in the patch pipette. (B) Zero ATP in the patch pipette. (C) Patch pipette contained 2 mM AMP-PNP. (D) Patch pipette contained 2 mM ATPγS. (E) With ATPγS in the pipette, in 7 of 10 cells that responded to hypertonicity stimulation, membrane potential oscillation persisted after hypertonic NaCl was washed out. Shown is a representative example of persistent oscillation after washout. Note that ATPγS is a substrate for kinase but not for phosphatase due to thio-linkage between sulfur and oxygen atom. Pie charts in AD show distribution of responsive and nonresponsive neurons. B and C are statistically significantly different from A, P < 0.05 by 2-tailed Fisher’s exact test. OVLT neurons were isolated from 4–6 mice for each experimental setting.
Figure 6
Figure 6. Deletion of Wnk1 in PVN-projecting OVLT neurons is responsible for the partial CDI phenotype.
(A) Injection of AAV-retro-Cre virus into PVN of tdTomato-EGFP reporter mice resulted in green fluorescence in neurons of OVLT nuclei, which otherwise exhibited tomato red fluorescence. Scale bar: 200 μm. (B) PVN injection of AAV-retro-Cre virus into Wnk1fl/fl mice resulted in deletion of Wnk1 in OVLT compared with control experiments with injection of AAV-retro-Cre virus into PVN of WT mice. Scale bar: 100 μm. (C) Urine volume, (D) urine osmolality, and (E) plasma osmolality of Wnk1fl/fl mice before and after injection with AAV-retro-Cre virus during at libitum and after water restriction (WR). (F) Urine volume, (G) urine osmolality, and (H) plasma osmolality of WT mice before and after injection with AAV-retro-Cre virus. Data shown are mean ± SEM from before injection (labeled retro-AAV –) and after injection (labeled retro-AAV +). Statistical analysis by 2-way repeated ANOVA with Šidák post hoc analysis. n = 4–6 mice as indicated by scatter plots.
Figure 7
Figure 7. Deletion of Wnk1 in PVN-projecting OVLT neurons eliminates hypertonicity-induced membrane potential oscillation and blunts copeptin release in response to water restriction.
(A and B) Cooopeptin release in Wnk1fl/fl and control WT mice with PVN injected with AAV-retro-Cre virus. Statistical comparison was made by paired t test between ad libitum and WR. (C and D) In separate groups of experimental (Wnk1fl/fl) and control (WT) mice, OVLT neurons were isolated for recording of membrane potential oscillation. Pie charts show distribution of neurons that exhibit membrane potential oscillation responsive and nonresponsive to HTS (5 mM NaCl). P < 0.01 between pie chart in C and D by 2-tailed Fisher’s exact test. In A and B, n = 5 Wnk1fl/fl and WT mice per experiment, as indicated in scatter plots.
Figure 8
Figure 8. Knockdown of Kv3.1 by shRNA in OVLT causes partial central diabetes insipidus and impairs copeptin release in response to water restriction.
(A) OVLT tissues from mice with direct injection scrambled RNA (Ctrl) or shRNA against Kv3.1 were probed by antibody against Kv3.1b. Note that the Kv3.1 shRNA targets both alternatively spliced Kv3.1a and Kv3.1b isoforms. (B) Mean ± SEM of Kv3.1b protein abundance from 3 separate experiments as shown in A (data from each experiment is the average of triplicate samples). Statistical analysis by unpaired t test. (C) Urine volume, (D) urine osmolality, (E) plasma osmolality, and (F) copeptin levels of mice injected with control scrambled RNA (labeled –) or shRNA against Kv3.1b (labeled +) into OVLT and at either ad libitum water intake or after 24-hour water restriction (WR). Unpaired t test for comparison between control scrambled RNA and Kv3.1 shRNA in B. In CF, n = 5 mice per group injected with control scrambled or with Kv3.1b shRNA as indicated in scatter plots. Statistical analysis was performed with by 2-way repeated ANOVA with Šidák post hoc analysis.
Figure 9
Figure 9. Activation of WNK1 in OVLT increases AVP release.
WT mice or mice heterozygous for GOF Cl-insensitive Wnk1-knockin (Wnk1-KI) allele received AAV-Cre virus injection in OVLT. (A) Relative abundance of phospho-OSR/SPAK (p-OSR/SPAK) in KI mice before (–) and after (+) injection, as measured by Western blotting analysis of OVLT using antibody against S373-phospho-SPAK/S325-phospho-OSR1. The inset shows representative Western blotting of 3 separate experiments. Each experiment consists of 3 replicates of WT and 3 Wnk1-KI mice. Each data point in the bar graph represents the average of 3 replicates. Statistical analysis by unpaired t test. (B) Plasma AVP level, (C) urine volume, (D) urine osmolality in heterozygous Wnk1-KI mice in which OVLT was injected with AAV-Cre virus, (E) plasma AVP level, (F) urine volume, and (G) urine osmolality of WT mice in which OVLT was injected with AAV-Cre virus. In BG, n = 5 mice, as indicated in line plots. Statistical analysis by paired t test.
Figure 10
Figure 10. Pharmacological inhibition of WNK1 abolishes hypertonicity-induced spike generation in PVN-projecting OVLT neurons.
(A) Schematic of the retrograde tracer CTB-594 (Alexa Fluor 594–conjugated recombinant cholera toxin subunit B) injection at the PVN for labeling of PVN-projecting OVLT cells. (B) Representative coronal section of the mouse brain injected with CTB-594 at the PVN region. Scale bar: 1 mm. (C) Overlay of epifluorescence and IR-DIC images showing CTB-expressing neurons in the OVLT region. Scale bar: 10 μm. A recording pipette attached to a CTB-expressing cell is illustrated. (D) Top: Representative traces of the spontaneous firing recorded from a NaCl-responsive (R; cyan trace) neuron and a NaCl-nonresponsive (NR; red trace) neuron. Slices were incubated in the vehicle-containing solution before recording. Bottom: Histogram of z score from the representative NaCl-R and NaCl-NR cells. (E) Distribution of the z score change (Δz score) in response to 5 mM NaCl stimulation of all recorded cells in the vehicle group. The dashed line indicates 0.5. (F) Pie chart showing distribution of NaCl-R (Δz score > 0.5) and NaCl-NR (Δz score < 0.5) PVN-projecting OVLT neurons in the vehicle group. (G) Top: Representative traces of the spontaneous firing recorded from a NaCl-R neuron and a NaCl-NR neuron. Slices were incubated in the WNK463-containing solution before recording. Bottom: Histogram of z score from the representative NaCl-R and NaCl-NR cells. (H) Distribution of the Δz score in response to 5 mM NaCl stimulation of all recorded cells in the WNK463 group. The dashed line indicates 0.5. (I) Pie chart showing distribution of NaCl-R and NaCl-NR PVN-projecting OVLT neurons in the WNK463 group. *P = 0.048, between F and I, 2-tailed Fisher’s exact test. The vehicle group consists of recordings of 46 cells from 34 mice. WNK463 consists of 17 cells from 9 mice.
Figure 11
Figure 11. Wnk1 deletion reduces hypertonicity-induced spike generation in PVN-projecting OVLT neurons.
(A) Schematic of the virus-mediated KO of Wnk1 in PVN-projecting OVLT neurons via injection of Cre-expressing retrograde virus at the PVN region. (B) Representative coronal section of the mouse brain injected with Cre-expressing virus at the PVN region. Scale bar: 1 mm. (C) Overlay of epifluorescence and IR-DIC images showing Cre-expressing neurons in the OVLT region. Scale bar: 10 μm. A recording pipette attached to a Cre-expressing cell was illustrated. (D) Top: Representative traces of spontaneous firing recorded from a NaCl-R neuron (R; cyan trace) and a NaCl-NR neuron (NR; red trace) in the WT mice. Bottom: Histogram of z score from the representative NaCl-R and NaCl-NR cells. (E) Distribution of the Δz score in response to 5 mM NaCl stimulation of all recorded neurons in WT mice. The dashed line indicates 0.5. (F) Pie chart showing distribution of NaCl-R and NaCl-NR PVN-projecting OVLT neurons in WT mice. (G) Top: Representative traces of spontaneous firing recorded from a NaCl-R neuron and a NaCl-NR neuron in the Wnk1–conditional KO (cKO) mice. Bottom: Histogram of z score from the representative NaCl-R and NaCl-NR cells. (H) Distribution of the Δz score in response to 5 mM NaCl stimulation of all recorded neurons in Wnk1-cKO mice. The dashed line indicates 0.5. (I) Pie chart showing distribution of NaCl-R and NaCl-NR PVN-projecting OVLT neurons in Wnk1-cKO mice. *P = 0.032, between F and I, 2-tailed Fisher’s exact test. The WT group consists of recordings of 22 cells from 13 mice; the cKO group consists of 24 cells from 11 mice.
Figure 12
Figure 12. Working model illustrating WNK1 in CVOs as an osmosensor to regulate AVP release via Kv3.1.
(A) WNK1 exists in conformational equilibrium between chloride-bound autoinhibited dimer and chloride-free activation-competent monomer. Hyperosmolality extracts water from the cell and from the catalytic core of WNK1, which facilitates chloride unbinding, allowing autophosphorylation at S382 and be activated (–40). WNK1 may activate Kv3.1 directly or indirectly through other intermediaries such as OSR1/SPAK. (B) Kv3.1 is a high-threshold voltage-gated K+ channel activated by membrane depolarization to –20 mV or above (24, 25). Activation of Kv3.1 shortens action potential duration, increases after hyperpolarization (AHP), and thus increases firing frequency (illustrated by red trace). Conversely, inhibition of Kv3.1 decreases firing frequency (blue trace). In support of this notion, we have found that TEA increased the action potential half-width (data not shown). (C) Exponential curvilinear relationship between AVP release and plasma osmolality begins at the threshold of approximately 280 mOsm/kg. WNK1 activation by cellular dehydration (Excitatory pathway; thick green line) plays an important role in AVP release by hyperosmolality. Additional mechanism(s) may be involved, at least for secretion at the basal state, which may include tonic inhibition of osmosensory neurons (Inhibitory pathway; thick solid red line). Loss of hypotonicity-mediated inhibitory pathway (thick dotted red line) may also contribute to hyperosmolality-induced AVP release. Compensation by the additional pathways may account for apparent similar AVP release defects in OVLT-selective deletion of WNK1 (by direct shRNA injection) versus neuronal deletion of WNK1. Extracellular hypertonicity may also activate WNK1 signaling cascade through molecular crowding of the protein (ref. 46) (data not shown).

Similar articles

Cited by

  • Molecular Crowding: Physiologic Sensing and Control.
    Subramanya AR, Boyd-Shiwarski CR. Subramanya AR, et al. Annu Rev Physiol. 2024 Feb 12;86:429-452. doi: 10.1146/annurev-physiol-042222-025920. Epub 2023 Nov 6. Annu Rev Physiol. 2024. PMID: 37931170 Free PMC article. Review.
  • Hydrostatic Pressure Sensing by WNK kinases.
    Humphreys JM, Teixeira LR, Akella R, He H, Kannangara AR, Sekulski K, Pleinis J, Liwocha J, Jiou J, Servage KA, Orth K, Joachimiak L, Rizo J, Cobb MH, Brautigam CA, Rodan AR, Goldsmith EJ. Humphreys JM, et al. Mol Biol Cell. 2023 Oct 1;34(11):ar109. doi: 10.1091/mbc.E23-03-0113. Epub 2023 Aug 16. Mol Biol Cell. 2023. PMID: 37585288 Free PMC article.
  • The biology of water homeostasis.
    D'Acierno M, Fenton RA, Hoorn EJ. D'Acierno M, et al. Nephrol Dial Transplant. 2025 Apr 1;40(4):632-640. doi: 10.1093/ndt/gfae235. Nephrol Dial Transplant. 2025. PMID: 39435642 Free PMC article. Review.

References

    1. Johnson AK, Gross PM. Sensory circumventricular organs and brain homeostatic pathways. FASEB J. 1993;7(8):678–686. doi: 10.1096/fasebj.7.8.8500693. - DOI - PubMed
    1. Shi P, et al. Intra-carotid hyperosmotic stimulation increases Fos staining in forebrain organum vasculosum laminae terminalis neurones that project to the hypothalamic paraventricular nucleus. J Physiol. 2008;586(21):5231–5245. doi: 10.1113/jphysiol.2008.159665. - DOI - PMC - PubMed
    1. Thrasher TN, et al. Lesions of the organum vasculosum of the lamina terminalis (OVLT) attenuate osmotically-induced drinking and vasopressin secretion in the dog. Endocrinology. 1982;110(5):1837–1839. doi: 10.1210/endo-110-5-1837. - DOI - PubMed
    1. Ding JM, et al. Proto-oncogene c-fos and the regulation of vasopressin gene expression during dehydration. Brain Res Mol Brain Res. 1994;21(3-4):247–255. doi: 10.1016/0169-328X(94)90255-0. - DOI - PubMed
    1. Matsuda T, et al. Distinct neural mechanisms for the control of thirst and salt appetite in the subfornical organ. Nat Neurosci. 2017;20(2):230–241. doi: 10.1038/nn.4463. - DOI - PubMed

Publication types