

Dynamics of Sequence and Structural Cell-Free DNA Landscapes in Small-Cell Lung Cancer
- PMID: 37071497
- PMCID: PMC10261918
- DOI: 10.1158/1078-0432.CCR-22-2242
Dynamics of Sequence and Structural Cell-Free DNA Landscapes in Small-Cell Lung Cancer
Abstract
Purpose: Patients with small-cell lung cancer (SCLC) have an exceptionally poor prognosis, calling for improved real-time noninvasive biomarkers of therapeutic response.
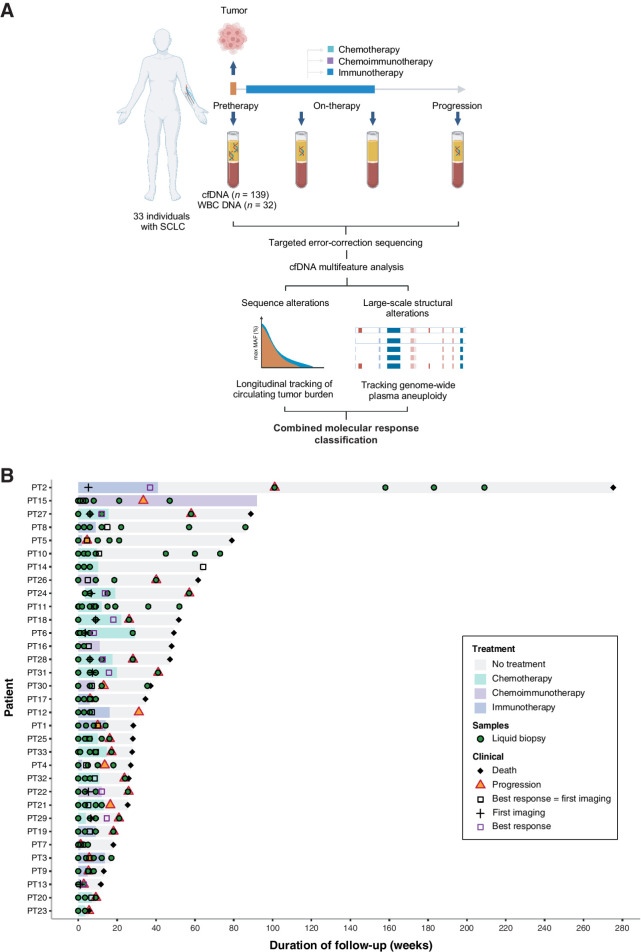
Experimental design: We performed targeted error-correction sequencing on 171 serial plasmas and matched white blood cell (WBC) DNA from 33 patients with metastatic SCLC who received treatment with chemotherapy (n = 16) or immunotherapy-containing (n = 17) regimens. Tumor-derived sequence alterations and plasma aneuploidy were evaluated serially and combined to assess changes in total cell-free tumor load (cfTL). Longitudinal dynamic changes in cfTL were monitored to determine circulating cell-free tumor DNA (ctDNA) molecular response during therapy.
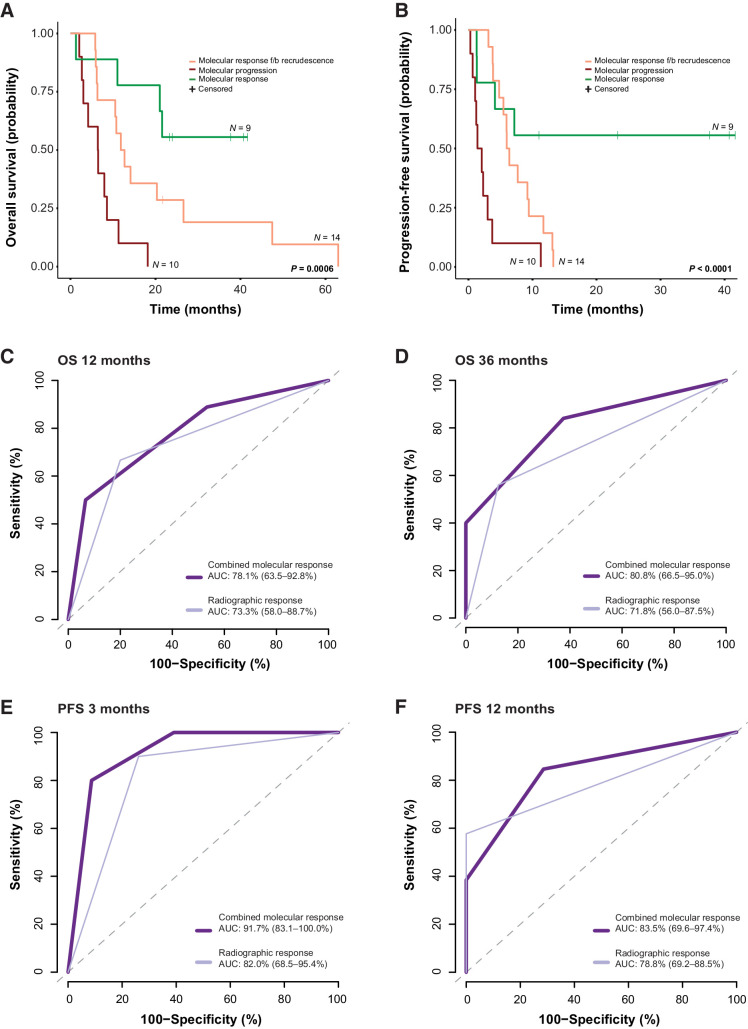
Results: Combined tiered analyses of tumor-derived sequence alterations and plasma aneuploidy allowed for the assessment of ctDNA molecular response in all patients. Patients classified as molecular responders (n = 9) displayed sustained elimination of cfTL to undetectable levels. For 14 patients, we observed initial molecular responses, followed by ctDNA recrudescence. A subset of patients (n = 10) displayed a clear pattern of molecular progression, with persistence of cfTL across all time points. Molecular responses captured the therapeutic effect and long-term clinical outcomes in a more accurate and rapid manner compared with radiographic imaging. Patients with sustained molecular responses had longer overall (log-rank P = 0.0006) and progression-free (log-rank P < 0.0001) survival, with molecular responses detected on average 4 weeks earlier than imaging.
Conclusions: ctDNA analyses provide a precise approach for the assessment of early on-therapy molecular responses and have important implications for the management of patients with SCLC, including the development of improved strategies for real-time tumor burden monitoring. See related commentary by Pellini and Chaudhuri, p. 2176.
©2023 The Authors; Published by the American Association for Cancer Research.
Figures
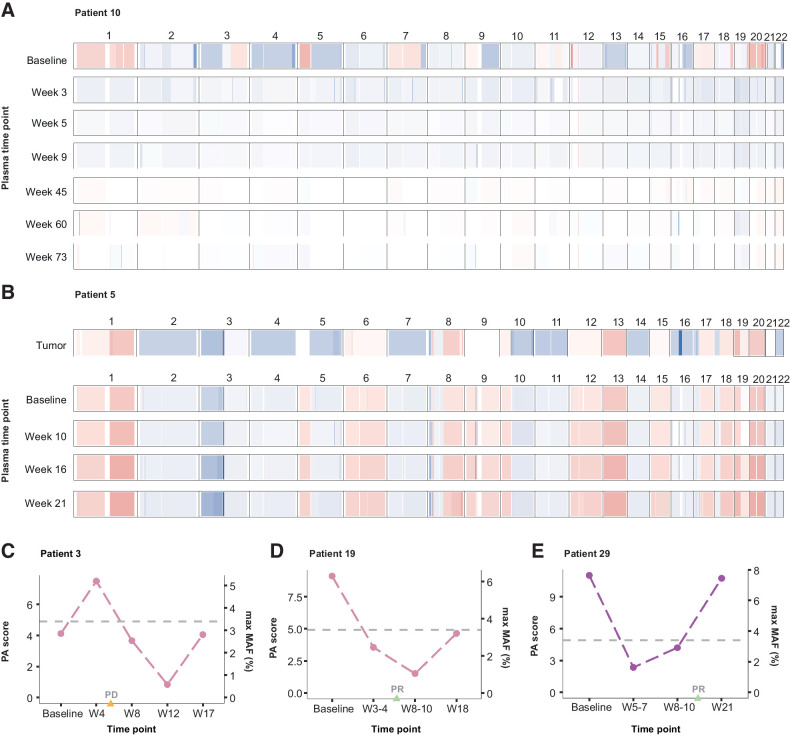
![Figure 4. Dynamic changes in cfTL during therapy. Longitudinal changes in cfTL across plasma time points analyzed for each patient were used to assign a combined molecular response classification. Representative examples are shown of patients who were assigned to each of the 3 classifications. A, Patient 10 was classified as a molecular responder based on the complete elimination of cfTL, assessed using tumor-derived sequence alterations, between baseline and week 5 sampling during cisplatin/etoposide chemotherapy treatment (indicated by the green shaded area). A reduction in PA scores to undetectable levels from baseline was also observed in this patient. B and C, Patients 26 and 21 were assigned a classification of molecular response followed by recrudescence based on the elimination of cfTL between baseline and intermediate time points [during atezolizumab/etoposide/carboplatin (purple) and carboplatin/etoposide (green) treatment, respectively], after which an increase in cfTL was observed at the final time points analyzed. C, In patient 21, a shift in mutation profiles defined by the presence of tumor-derived RET (p.Y314F) and TP53 (p.V173E) mutations at recrudescence, which were not present at the baseline timepoint, was observed. D, Patient 1 was classified as a molecular progressor based on the persistence of cfTL, defined by a tumor-derived TP53 (p.C135S) sequence alteration, across all time points analyzed during treatment with nivolumab (blue). E, Combined molecular responses were significantly associated with clinical evaluations of best radiographic response (P = 0.003, Fisher exact test). F, A broader comparison between the elimination of cfTL at any timepoint analyzed for the study and radiographic assessments further revealed concordance (P = 0.001, Fisher exact test) between each variable. G, Molecular responses were determined on average 4 weeks prior to best radiographic response assessments in 28 patients with comparable ctDNA and imaging assessments in this cohort (mean 5.61 weeks vs. 10.21 weeks; P = 0.01 Mann–Whitney U test). Patients without baseline plasma samples available (n = 2) and cases with discordant molecular and radiographic responses (n = 3) were excluded from analyses. Mean times to response assessment are shown alongside standard error for each modality.](https://cdn.ncbi.nlm.nih.gov/pmc/blobs/0fd3/10261918/b4ec9a226dc4/2310fig4.jpg)
Comment in
-
ctDNA Monitoring for Small Cell Lung Cancer: Ready for Prime Time?Clin Cancer Res. 2023 Jun 13;29(12):2176-2178. doi: 10.1158/1078-0432.CCR-23-0420. Clin Cancer Res. 2023. PMID: 37097069 Free PMC article.
-
Can liquid biopsy dynamics stratify patients with small cell lung cancer?Transl Lung Cancer Res. 2023 Dec 26;12(12):2565-2569. doi: 10.21037/tlcr-23-665. Epub 2023 Dec 20. Transl Lung Cancer Res. 2023. PMID: 38205208 Free PMC article. No abstract available.
Comment on
-
ctDNA Monitoring for Small Cell Lung Cancer: Ready for Prime Time?Clin Cancer Res. 2023 Jun 13;29(12):2176-2178. doi: 10.1158/1078-0432.CCR-23-0420. Clin Cancer Res. 2023. PMID: 37097069 Free PMC article.
References
-
- Torre LA, Siegel RL, Jemal A. Lung cancer statistics. Adv Exp Med Biol 2016;893:1–19. - PubMed
-
- van Meerbeeck JP, Fennell DA, De Ruysscher DKM. Small-cell lung cancer. Lancet 2011;378:1741–55. - PubMed
-
- Rudin CM, Ismaila N, Hann CL, Malhotra N, Movsas B, Norris K, et al. Treatment of small-cell lung cancer: American Society of Clinical Oncology endorsement of The American College of Chest Physicians guideline. J Clin Oncol 2015;33:4106–11. - PubMed
-
- Goldman JW, Dvorkin M, Chen Y, Reinmuth N, Hotta K, Trukhin D, et al. Durvalumab, with or without tremelimumab, plus platinum-etoposide versus platinum-etoposide alone in first-line treatment of extensive-stage small-cell lung cancer (CASPIAN): updated results from a randomised, controlled, open-label, phase 3 trial. Lancet Oncol 2021;22:51–65. - PubMed
Publication types
MeSH terms
Substances
Grants and funding
LinkOut - more resources
Full Text Sources
Medical
