Compensatory Kinetics During the Side-Hop Test in Individuals With Chronic Ankle Instability
- PMID: 37071526
- PMCID: PMC10784892
- DOI: 10.4085/1062-6050-0592.22
Compensatory Kinetics During the Side-Hop Test in Individuals With Chronic Ankle Instability
Abstract
Context: Individuals with chronic ankle instability (CAI) exhibit altered movement strategies during side-cutting tasks. However, no researchers have assessed how altered movement strategies affect cutting performance.
Objective: To investigate compensatory strategies in the side-hop test (SHT), with a focus on the entire lower extremity, among individuals with CAI.
Design: Cross-sectional study.
Setting: Laboratory.
Patients or other participants: A total of 40 male soccer players comprising a CAI group (n = 20; age = 20.35 ± 1.15 years, height = 173.95 ± 6.07 cm, mass = 68.09 ± 6.73 kg) and a control group (n = 20; age = 20.45 ± 1.50 years, height = 172.39 ± 4.39 cm, mass = 67.16 ± 4.87 kg).
Intervention(s): Participants performed 3 successful SHT trials.
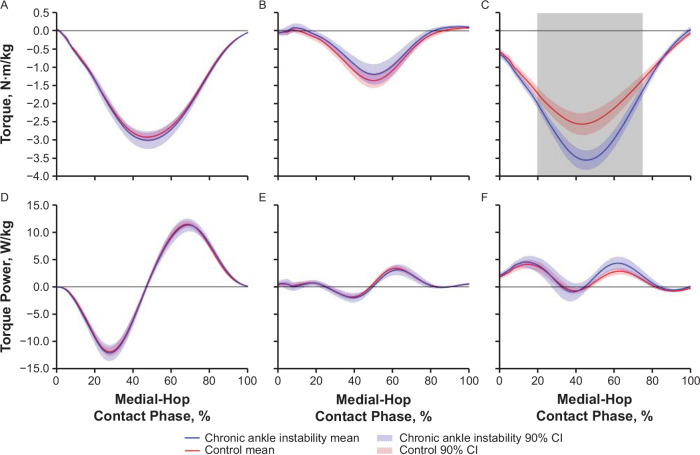
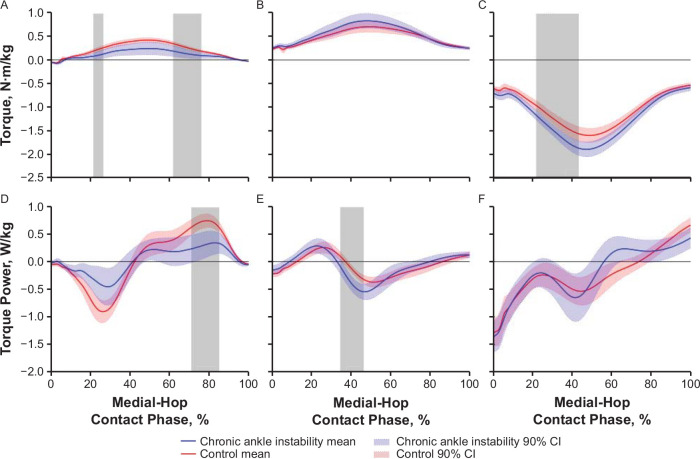
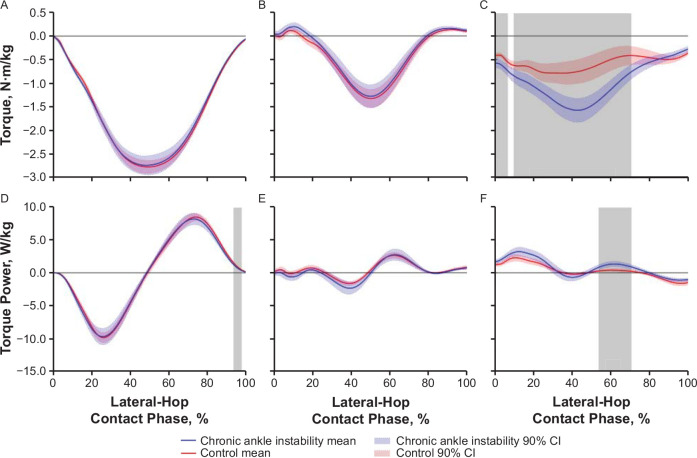
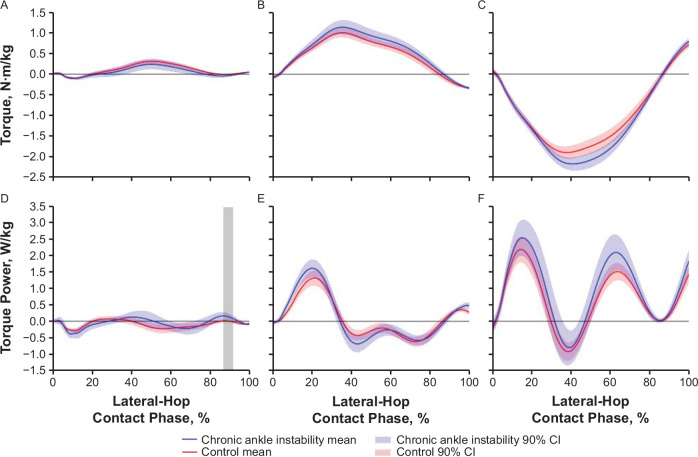
Main outcome measure(s): We calculated SHT time, torque, and torque power in the ankle, knee, and hip joints during the SHT using motion-capture cameras and force plates. Confidence intervals for each group that did not overlap by >3 points consecutively in the time series data indicated a difference between groups.
Results: Compared with the control group, the CAI group showed (1) no delayed SHT time; (2) lower ankle-inversion torque (range = 0.11-0.13 N·m/kg) and higher hip-extension (range = 0.18-0.72 N·m/kg) and -abduction torque (0.26 N·m/kg); (3) less concentric power in ankle dorsiflexion-plantar flexion (0.18 W/kg) and inversion-eversion (0.40 W/kg), more concentric power in hip flexion-extension (0.73 W/kg), and more eccentric power in knee varus-valgus (0.27 W/kg).
Conclusions: Individuals with CAI were likely to rely on hip-joint function to compensate for ankle instability and demonstrated no differences in SHT time compared with the control group. Therefore, the movement strategies of individuals with CAI could differ from those of individuals without CAI, even if SHT time is not different.
Keywords: ankle sprains; functional performance test; injury prevention; return to sport.
© by the National Athletic Trainers’ Association, Inc.
Figures
Similar articles
-
Altered Movement Biomechanics in Chronic Ankle Instability, Coper, and Control Groups: Energy Absorption and Distribution Implications.J Athl Train. 2019 Jun;54(6):708-717. doi: 10.4085/1062-6050-483-17. Epub 2019 Jun 11. J Athl Train. 2019. PMID: 31184955 Free PMC article.
-
Lower Limb Joint Kinetics During a Side-Cutting Task in Participants With or Without Chronic Ankle Instability.J Athl Train. 2020 Feb;55(2):169-175. doi: 10.4085/1062-6050-334-18. Epub 2020 Jan 2. J Athl Train. 2020. PMID: 31895591 Free PMC article.
-
Altered Walking Neuromechanics in Patients With Chronic Ankle Instability.J Athl Train. 2019 Jun;54(6):684-697. doi: 10.4085/1062-6050-478-17. Epub 2019 Jun 4. J Athl Train. 2019. PMID: 31162941 Free PMC article. Clinical Trial.
-
Is chronic ankle instability associated with impaired muscle strength? Ankle, knee and hip muscle strength in individuals with chronic ankle instability: a systematic review with meta-analysis.Br J Sports Med. 2020 Jul;54(14):839-847. doi: 10.1136/bjsports-2018-100070. Epub 2020 Jan 14. Br J Sports Med. 2020. PMID: 31937576
-
Chronic Ankle Instability Leads to Lower Extremity Kinematic Changes During Landing Tasks: A Systematic Review.Int J Exerc Sci. 2019 Jan 1;12(1):24-33. doi: 10.70252/DTNP3988. eCollection 2019. Int J Exerc Sci. 2019. PMID: 30761190 Free PMC article. Review.
Cited by
-
Application of Smart Insoles in Assessing Dynamic Stability in Patients with Chronic Ankle Instability: A Comparative Study.Sensors (Basel). 2025 Jan 22;25(3):646. doi: 10.3390/s25030646. Sensors (Basel). 2025. PMID: 39943285 Free PMC article.
-
Impact of Quadriceps Muscle Fatigue on Ankle Joint Compensation Strategies During Single-Leg Vertical Jump Landing.Sensors (Basel). 2024 Oct 18;24(20):6712. doi: 10.3390/s24206712. Sensors (Basel). 2024. PMID: 39460191 Free PMC article.
References
MeSH terms
LinkOut - more resources
Full Text Sources
Medical