. 2023 May 4;13(5):1144-1163.
doi: 10.1158/2159-8290.CD-22-0998.

Patterns of Oncogene Coexpression at Single-Cell Resolution Influence Survival in Lymphoma

Affiliations

Patterns of Oncogene Coexpression at Single-Cell Resolution Influence Survival in Lymphoma

Michal Marek Hoppe et al. Cancer Discov. .

Abstract

Cancers often overexpress multiple clinically relevant oncogenes, but it is not known if combinations of oncogenes in cellular subpopulations within a cancer influence clinical outcomes. Using quantitative multispectral imaging of the prognostically relevant oncogenes MYC, BCL2, and BCL6 in diffuse large B-cell lymphoma (DLBCL), we show that the percentage of cells with a unique combination MYC+BCL2+BCL6- (M+2+6-) consistently predicts survival across four independent cohorts (n = 449), an effect not observed with other combinations including M+2+6+. We show that the M+2+6- percentage can be mathematically derived from quantitative measurements of the individual oncogenes and correlates with survival in IHC (n = 316) and gene expression (n = 2,521) datasets. Comparative bulk/single-cell transcriptomic analyses of DLBCL samples and MYC/BCL2/BCL6-transformed primary B cells identify molecular features, including cyclin D2 and PI3K/AKT as candidate regulators of M+2+6- unfavorable biology. Similar analyses evaluating oncogenic combinations at single-cell resolution in other cancers may facilitate an understanding of cancer evolution and therapy resistance.

Significance: Using single-cell-resolved multiplexed imaging, we show that selected subpopulations of cells expressing specific combinations of oncogenes influence clinical outcomes in lymphoma. We describe a probabilistic metric for the estimation of cellular oncogenic coexpression from IHC or bulk transcriptomes, with possible implications for prognostication and therapeutic target discovery in cancer. This article is highlighted in the In This Issue feature, p. 1027.


Figures

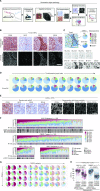
Figure 1. Quantitative single-cell analysis of MYC, BCL2, and BCL6 protein expression in B cells in nonmalignant tissues and diffuse large B-cell lymphoma. A, Schematic workflow of a quantitative digital pathology experiment. B, Spectrally unmixed multiplexed fluorescent images for CD20, MYC, BCL2, and BCL6 and nuclear counterstaining in tonsil tissue. The germinal center (GC) and extragerminal center (extra-GC) zones are indicated. C, Spatial map of MYC/BCL2/BCL6 subpopulations, i.e., possible permutations of MYC/BCL2/BCL6-positivity and -negativity within the CD20-positive cell population in a tonsil image. D, Quantitation of subpopulation extent within CD20-positive cells in tonsils and reactive lymph nodes resolved spatially between the GC and extra-GC zones. E, Example of pseudocolored MYC/BCL2/BCL6/CD20 mfIHC staining in diffuse large B-cell lymphoma (DLBCL; left). Cell segmentation and single oncogene positivity masks are shown within the CD20-positive cell population (right). F, Summary of percentage extent of subpopulations across patients from National University Hospital (NUH), Chi-Mei Medical Center (CMMC), MD Anderson (MDA), and Singapore General Hospital (SGH). Relevant clinicopathologic features are indicated; see also Supplementary Fig. S3. Patients were ordered arbitrarily according to extent of the triple-positive M+2+6+ subpopulation extent. IPI Risk Group, International Prognostic Index Risk Group; FISH, fluorescence in situ hybridization. G, Intrapatient spatial stability of subpopulations – proportion of subpopulations measured across four spatially distinct biopsies from the same patient (rows). Biopsy comparison overview is shown across 11 representative example DLBCL patients (columns). See also Supplementary Fig. S4A and S4B for a correlation analysis for all patients with multiple biopsies available. H, Proliferation analysis (i.e., Ki-67-positivity) among subpopulations in DLBCL samples. Proliferative BCL6-positive subpopulations are grouped. Median with interquartile range, whiskers denote 10th and 90th percentile. Mann–Whitney test (BCL6-positive vs. -negative subpopulations). All scale bars, 100 μm.
Figure 1.
Quantitative single-cell analysis of MYC, BCL2, and BCL6 protein expression in B cells in nonmalignant tissues and diffuse large B-cell lymphoma. A, Schematic workflow of a quantitative digital pathology experiment. B, Spectrally unmixed multiplexed fluorescent images for CD20, MYC, BCL2, and BCL6 and nuclear counterstaining in tonsil tissue. The germinal center (GC) and extragerminal center (extra-GC) zones are indicated. C, Spatial map of MYC/BCL2/BCL6 subpopulations, i.e., possible permutations of MYC/BCL2/BCL6-positivity and -negativity within the CD20-positive cell population in a tonsil image. D, Quantitation of subpopulation extent within CD20-positive cells in tonsils and reactive lymph nodes resolved spatially between the GC and extra-GC zones. E, Example of pseudocolored MYC/BCL2/BCL6/CD20 mfIHC staining in diffuse large B-cell lymphoma (DLBCL; left). Cell segmentation and single oncogene positivity masks are shown within the CD20-positive cell population (right). F, Summary of percentage extent of subpopulations across patients from National University Hospital (NUH), Chi-Mei Medical Center (CMMC), MD Anderson (MDA), and Singapore General Hospital (SGH). Relevant clinicopathologic features are indicated; see also Supplementary Fig. S3. Patients were ordered arbitrarily according to extent of the triple-positive M+2+6+ subpopulation extent. IPI Risk Group, International Prognostic Index Risk Group; FISH, fluorescence in situ hybridization. G, Intrapatient spatial stability of subpopulations – proportion of subpopulations measured across four spatially distinct biopsies from the same patient (rows). Biopsy comparison overview is shown across 11 representative example DLBCL patients (columns). See also Supplementary Fig. S4A and S4B for a correlation analysis for all patients with multiple biopsies available. H, Proliferation analysis (i.e., Ki-67-positivity) among subpopulations in DLBCL samples. Proliferative BCL6-positive subpopulations are grouped. Median with interquartile range, whiskers denote 10th and 90th percentile. Mann–Whitney test (BCL6-positive vs. -negative subpopulations). All scale bars, 100 μm.
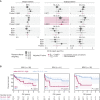
Figure 2. Prognostic significance of subpopulations after R-CHOP therapy. A, Pooled univariate Cox PH model analysis for MYC, BCL2, and BCL6 single oncogene and subpopulations percentage extent as predictors of OS across multiple DLBCL cohorts. Percentage extent was used as a continuous variable in the model at 5% increments (see Survival analysis) for an unbiased comparison between the variables. Pooled P values were Bonferroni corrected for single oncogenes and subpopulations independently to adjust for multiple testing and are shown for each variable. Hazard ratio (HR) with 95% confidence interval (CI) per 5%-positivity increment is shown (see also Supplementary table S4). B, Kaplan–Meier OS analysis of dichotomized into M+2+6− high and low groups. Log-rank test, shading denotes 95% CI. An optimal dichotomization cutoff was used for stratification; total patient numbers in each group are shown.
Figure 2.
Prognostic significance of subpopulations after R-CHOP therapy. A, Pooled univariate Cox PH model analysis for MYC, BCL2, and BCL6 single oncogene and subpopulations percentage extent as predictors of OS across multiple DLBCL cohorts. Percentage extent was used as a continuous variable in the model at 5% increments (see Survival Analysis) for an unbiased comparison between the variables. Pooled P values were Bonferroni corrected for single oncogenes and subpopulations independently to adjust for multiple testing and are shown for each variable. Hazard ratio (HR) with 95% confidence interval (CI) per 5%-positivity increment is shown (see also Supplementary Table S4). B, Kaplan–Meier OS analysis of dichotomized into M+2+6− high and low groups. Log-rank test, shading denotes 95% CI. An optimal dichotomization cutoff was used for stratification; total patient numbers in each group are shown.
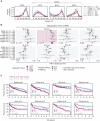
Figure 3. MYC, BCL2, and BCL6 protein coexpression in DLBCL can be inferred from individual marker data. A, Schematic of possible relationships between expression of three oncogenes in a population of cells. The distribution of these oncogenes can either reflect interdependent expression, independent/stochastic expression, or mutually exclusive expression. These relationships result in the percentage extent of oncogenes in the tumor being either strongly positively correlated, not correlated, or strongly negatively correlated, respectively. Created with BioRender.com. B, Correlation of MYC, BCL2, and BCL6 percentage extent across patients in DLBCL cohorts. Spearman correlation; axes are equivalent in all panels. C, Good correlation between probabilistically predicted subpopulation percentage extent based on single oncogene positivity and observed percentage extent in the NUH cohort. Cases of double-hit lymphoma (DHL, MYC+BCL2+ translocations or MYC+BCL6+ translocations) or triple-hit lymphoma (THL) are highlighted. Spearman rho for each correlation is shown; axes are equivalent in all panels. Correlation for other cohorts can be found in Supplementary Fig. S7. D, Prospective evaluation of an optimal dichotomization cutoff for M+2+6− percentage extent in the British Columbia Cancer Agency (BCA) cohort. Univariate Cox PH model at 1% extent positivity increment, HR for death with 95% CI. HR scale is exponential. Optimal dichotomization cutoff is highlighted in blue. E, Kaplan–Meier OS analysis of the chromogenic IHC BCA cohort evaluation stratified into M+2+6− metric high and low groups across an absolute value of 15% M+2+6−metric. Log-rank test, shading denotes 95% confidence interval.
Figure 3.
MYC, BCL2, and BCL6 protein coexpression in DLBCL can be inferred from individual marker data. A, Schematic of possible relationships between expression of three oncogenes in a population of cells. The distribution of these oncogenes can either reflect interdependent expression, independent/stochastic expression, or mutually exclusive expression. These relationships result in the percentage extent of oncogenes in the tumor being either strongly positively correlated, not correlated, or strongly negatively correlated, respectively. Created with BioRender.com. B, Correlation of MYC, BCL2, and BCL6 percentage extent across patients in DLBCL cohorts. Spearman correlation; axes are equivalent in all panels. C, Good correlation between probabilistically predicted subpopulation percentage extent based on single oncogene positivity and observed percentage extent in the NUH cohort. Cases of double-hit lymphoma (DHL, MYC+BCL2+ translocations or MYC+BCL6+ translocations) or triple-hit lymphoma (THL) are highlighted. Spearman rho for each correlation is shown; axes are equivalent in all panels. Correlation for other cohorts can be found in Supplementary Fig. S7. D, Prospective evaluation of an optimal dichotomization cutoff for M+2+6− percentage extent in the BCA cohort. Univariate Cox PH model at 1% extent positivity increment, HR for death with 95% CI. HR scale is exponential. Optimal dichotomization cutoff is highlighted in blue. E, Kaplan–Meier OS analysis of the chromogenic IHC BCA cohort evaluation stratified into M+2+6− metric high and low groups across an absolute value of 15% M+2+6−metric. Log-rank test, shading denotes 95% confidence interval. CMMC, Chi-Mei Medical Center.
Figure 4. Validation of prognostic significance of the M+2+6− subpopulation metric in gene-expression data sets. A, Distribution of single oncogene positivity in DLBCL cohorts as assessed by mfIHC (see Supplementary Fig. S9A and S9B). B, Impact of subpopulation metrics in GEP data sets on OS. Pooled univariate Cox PH model analysis; metric was used as a continuous variable in the model at 5% increments. HR per 5% increment with 95% CI is shown; CI are proportional on both tails but are capped at the graph's edges. Pooled P values were Bonferroni corrected to adjust for multiple testing and are shown for each subpopulation. C, Kaplan–Meier OS analysis of GEP cohorts stratified uniformly across absolute 15% M+2+6− metric into -high and -low groups. Log-rank test, shading denotes 95% CI. Total patient numbers in each group are shown.
Figure 4.
Validation of prognostic significance of the M+2+6− subpopulation metric in gene-expression datasets. A, Distribution of single oncogene positivity in DLBCL cohorts as assessed by mfIHC (see Supplementary Fig. S9A and S9B). B, Impact of subpopulation metrics in GEP datasets on OS. Pooled univariate Cox PH model analysis; metric was used as a continuous variable in the model at 5% increments. HR per 5% increment with 95% CI is shown; CI are proportional on both tails but are capped at the graph's edges. Pooled P values were Bonferroni corrected to adjust for multiple testing and are shown for each subpopulation. C, Kaplan–Meier OS analysis of GEP cohorts stratified uniformly across absolute 15% M+2+6− metric into -high and -low groups. Log-rank test, shading denotes 95% CI. Total patient numbers in each group are shown. CMMC, Chi-Mei Medical Center.
Figure 5. Transcriptomic analysis of M+2+6− high cases and potential role of CCND2. A, Correlation of observed M+2+6− percentage extent in the BCA cohort with the cell-of-origin (COO) DLBCL90-COO signature. Bonferroni corrected Kruskal–Wallis test for ABC vs. others. B, Correlation of M+2+6− metric in GEP cohorts with COO signatures. Mean M+2+6− metric value per group per cohort is shown. Bonferroni corrected paired-samples t test. C, Correlation of the M+2+6− percentage extent and metric evaluated by mfIHC and mRNA inference, respectively, with genetic subtypes (LymphGen classification). D, Sankey plot of M+2+6− dichotomized grouping matched with molecular features. E, Volcano plot of pooled direct correlation of gene mRNA expression and M+2+6− metric across seven GEP cohorts. Genes highly correlated with M+2+6− metric across data sets at absolute Spearman rho ≥0.2 and FDR≤0.001 are shown (see also Supplementary Table S11). The abscissa is scaled exponentially. F, Differential gene expression between primary GC B cells overexpressing M+2+ and M+2+6+ (see also Supplementary Table S12). Analysis is generated from 4 biological replicates from each condition, from cells of independent donors. G, Genes highly enriched in M+2+6− cells: correlation of results from E and F. H, CCDN2 gene expression in GEP cohorts in patients dichotomized by M+2+6− 15% metric (left) and in primary B cells (right). Paired t test (left); mean with standard deviation and FDR (FDR as per Supplementary Table S12) for t test (right). I, Single-cell RNA-seq of GC primary B cells transduced either with BCL2 and MYC (MYC-transduced) or BCL2 and BCL6 (BCL6-transduced). Untransduced GC primary B cells are also included. Expression of CCND2 is indicated in color. J, Proliferation analysis of M+2+6+ primary GC B cells overexpressing cyclin D2 (CCND2) compared with M+2+6+ primary GC B cells transduced with an empty vector (EV). Analysis performed with 3 biological replicates for each condition, using cells from 3 independent patients; mean with standard deviation; t test.
Figure 5.
Transcriptomic analysis of M+2+6− high cases and potential role of CCND2. A, Correlation of observed M+2+6− percentage extent in the BCA cohort with the cell-of-origin (COO) DLBCL90-COO signature. Bonferroni corrected Kruskal–Wallis test for ABC vs. others. B, Correlation of M+2+6− metric in GEP cohorts with COO signatures. Mean M+2+6− metric value per group per cohort is shown. Bonferroni corrected paired-samples t test. C, Correlation of the M+2+6− percentage extent and metric evaluated by mfIHC and mRNA inference, respectively, with genetic subtypes (LymphGen classification). D, Sankey plot of M+2+6− dichotomized grouping matched with molecular features. E, Volcano plot of pooled direct correlation of gene mRNA expression and M+2+6− metric across seven GEP cohorts. Genes highly correlated with M+2+6− metric across datasets at absolute Spearman rho ≥0.2 and FDR≤0.001 are shown (see also Supplementary Table S11). The abscissa is scaled exponentially. F, Differential gene expression between primary GC B cells overexpressing M+2+ and M+2+6+ (see also Supplementary Table S12). Analysis is generated from 4 biological replicates from each condition, from cells of independent donors. G, Genes highly enriched in M+2+6− cells: correlation of results from E and F. H,CCDN2 gene expression in GEP cohorts in patients dichotomized by M+2+6− 15% metric (left) and in primary B cells (right). Paired t test (left); mean with standard deviation and FDR (FDR as per Supplementary Table S12) for t test (right). I, Single-cell RNA-seq of GC primary B cells transduced either with BCL2 and MYC (MYC-transduced) or BCL2 and BCL6 (BCL6-transduced). Untransduced GC primary B cells are also included. Expression of CCND2 is indicated in color. J, Proliferation analysis of M+2+6+ primary GC B cells overexpressing cyclin D2 (CCND2) compared with M+2+6+ primary GC B cells transduced with an empty vector (EV). Analysis performed with 3 biological replicates for each condition, using cells from 3 independent patients; mean with standard deviation; t test. UMAP, Uniform Manifold Approximation and Projection.
Figure 6. Evaluation of M+2+6− cells in scRNA-seq data sets of DLBCL. A, Uniform manifold approximation and projection (UMAP) of malignant B cells from the Roider and Steen cohorts. B, Proportion of subpopulations across samples and annotation of M+2+6− cells in UMAP. C, Correlation of genes enriched in the M+2+6− subpopulation as evaluated by scRNA-seq with hits from the bulk GEP cohorts (Fig. 5E). CCND2 is highlighted and is among the concordant hits (see also Supplementary Table S13). D, WikiPathways terms enrichment among genes positively associated with M+2+6− cells. Both axes in C and D are scaled exponentially for clarity (see also Supplementary Table S14).
Figure 6.
Evaluation of M+2+6− cells in scRNA-seq datasets of DLBCL. A, Uniform Manifold Approximation and Projection (UMAP) of malignant B cells from the Roider and Steen cohorts. B, Proportion of subpopulations across samples and annotation of M+2+6− cells in UMAP. C, Correlation of genes enriched in the M+2+6− subpopulation as evaluated by scRNA-seq with hits from the bulk GEP cohorts (Fig. 5E). CCND2 is highlighted and is among the concordant hits (see also Supplementary Table S13). D, WikiPathways terms enrichment among genes positively associated with M+2+6− cells. Both axes in C and D are scaled exponentially for clarity (see also Supplementary Table S14).

Comment in

  • 2159-8274. doi: 10.1158/2159-8290.CD-13-5-ITI

References

    1. Marusyk A, Janiszewska M, Polyak K. Intratumor heterogeneity: The rosetta stone of therapy resistance. Cancer Cell 2020;37:471–84. - PMC - PubMed
    1. Maley CC, Aktipis A, Graham TA, Sottoriva A, Boddy AM, Janiszewska M, et al. . Classifying the evolutionary and ecological features of neoplasms. Nat Rev Cancer 2017;17:605–19. - PMC - PubMed
    1. Miao Y, Medeiros LJ, Li Y, Li J, Young KH. Genetic alterations and their clinical implications in DLBCL. Nat Rev Clin Oncol 2019;16:634–52. - PubMed
    1. Casey SC, Baylot V, Felsher DW. The MYC oncogene is a global regulator of the immune response. Blood 2018;131:2007–15. - PMC - PubMed
    1. Vaux DL, Cory S, Adams JM. Bcl-2 gene promotes haemopoietic cell survival and cooperates with c-myc to immortalize pre-B cells. Nature 1988;335:440–2. - PubMed

Publication types

MeSH terms

Substances