Mapping the timescale of suicidal thinking
- PMID: 37071683
- PMCID: PMC10151607
- DOI: 10.1073/pnas.2215434120
Mapping the timescale of suicidal thinking
Abstract
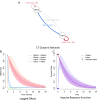
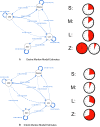
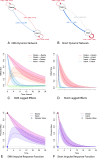
This study aims to identify the timescale of suicidal thinking, leveraging real-time monitoring data and a number of different analytic approaches. Participants were 105 adults with past week suicidal thoughts who completed a 42-d real-time monitoring study (total number of observations = 20,255). Participants completed two forms of real-time assessments: traditional real-time assessments (spaced hours apart each day) and high-frequency assessments (spaced 10 min apart over 1 h). We found that suicidal thinking changes rapidly. Both descriptive statistics and Markov-switching models indicated that elevated states of suicidal thinking lasted on average 1 to 3 h. Individuals exhibited heterogeneity in how often and for how long they reported elevated suicidal thinking, and our analyses suggest that different aspects of suicidal thinking operated on different timescales. Continuous-time autoregressive models suggest that current suicidal intent is predictive of future intent levels for 2 to 3 h, while current suicidal desire is predictive of future suicidal desire levels for 20 h. Multiple models found that elevated suicidal intent has on average shorter duration than elevated suicidal desire. Finally, inferences about the within-person dynamics of suicidal thinking on the basis of statistical modeling were shown to depend on the frequency at which data was sampled. For example, traditional real-time assessments estimated the duration of severe suicidal states of suicidal desire as 9.5 h, whereas the high-frequency assessments shifted the estimated duration to 1.4 h.
Keywords: ecological momentary assessment; suicidal thinking; suicide.
Conflict of interest statement
M.K.N. receives publication royalties from Macmillan, Pearson, and UpToDate. He has been a paid consultant in the past year for Cerebral, Compass Pathfinder, and for a legal case regarding a death by suicide. He is an unpaid scientific advisor for Empatica, Koko, and TalkLife. These roles are not perceived as creating conflicts of interests but are reported for transparency.
Figures


Similar articles
-
Daily and Cumulative Sleep Duration as Predictors of Suicidal Desire and Intent: An Ecological Momentary Assessment Study.J Clin Psychiatry. 2024 Jun 3;85(2):23m15164. doi: 10.4088/JCP.23m15164. J Clin Psychiatry. 2024. PMID: 38836860
-
A Pilot Study Using Frequent Inpatient Assessments of Suicidal Thinking to Predict Short-Term Postdischarge Suicidal Behavior.JAMA Netw Open. 2021 Mar 1;4(3):e210591. doi: 10.1001/jamanetworkopen.2021.0591. JAMA Netw Open. 2021. PMID: 33687442 Free PMC article.
-
Effect of frequent assessment of suicidal thinking on its incidence and severity: high-resolution real-time monitoring study.Br J Psychiatry. 2022 Jan;220(1):41-43. doi: 10.1192/bjp.2021.97. Br J Psychiatry. 2022. PMID: 35045901
-
Digital phenotyping of suicidal thoughts.Depress Anxiety. 2018 Jul;35(7):601-608. doi: 10.1002/da.22730. Epub 2018 Apr 10. Depress Anxiety. 2018. PMID: 29637663
-
Don't Miss the Moment: A Systematic Review of Ecological Momentary Assessment in Suicide Research.Front Digit Health. 2022 May 6;4:876595. doi: 10.3389/fdgth.2022.876595. eCollection 2022. Front Digit Health. 2022. PMID: 35601888 Free PMC article.
Cited by
-
Assessment of suicidal thoughts and behaviors in adults: A systematic review of measure psychometric properties and implications for clinical and research utility.Clin Psychol Rev. 2024 Aug;112:102464. doi: 10.1016/j.cpr.2024.102464. Epub 2024 Jul 8. Clin Psychol Rev. 2024. PMID: 39106741 Free PMC article.
-
Examining Passively Collected Smartphone-Based Data in the Days Prior to Psychiatric Hospitalization for a Suicidal Crisis: Comparative Case Analysis.JMIR Form Res. 2024 Mar 20;8:e55999. doi: 10.2196/55999. JMIR Form Res. 2024. PMID: 38506916 Free PMC article.
-
Identifying factors impacting missingness within smartphone-based research: Implications for intensive longitudinal studies of adolescent suicidal thoughts and behaviors.J Psychopathol Clin Sci. 2024 Oct;133(7):577-597. doi: 10.1037/abn0000930. Epub 2024 Jul 18. J Psychopathol Clin Sci. 2024. PMID: 39023923
-
Identifying therapeutic characteristics of digital social media narratives about suicide: a mixed methods investigation.Npj Ment Health Res. 2025 Sep 3;4(1):41. doi: 10.1038/s44184-025-00155-5. Npj Ment Health Res. 2025. PMID: 40903487 Free PMC article.
-
"I'd Rather Be Alone." Examining the Interactive Effects of Social Proximity and Social Preference on Suicidal Thinking.Suicide Life Threat Behav. 2025 Feb;55(1):e70006. doi: 10.1111/sltb.70006. Suicide Life Threat Behav. 2025. PMID: 39953820 Free PMC article.
References
Publication types
MeSH terms
Grants and funding
LinkOut - more resources
Full Text Sources
Medical
Miscellaneous

