. 2023 May 23;17(10):9388-9404.
doi: 10.1021/acsnano.3c01340. Epub 2023 Apr 18.

A Scalable High-Throughput Isoelectric Fractionation Platform for Extracellular Nanocarriers: Comprehensive and Bias-Free Isolation of Ribonucleoproteins from Plasma, Urine, and Saliva

Affiliations

A Scalable High-Throughput Isoelectric Fractionation Platform for Extracellular Nanocarriers: Comprehensive and Bias-Free Isolation of Ribonucleoproteins from Plasma, Urine, and Saliva

Himani Sharma et al. ACS Nano. .

Abstract

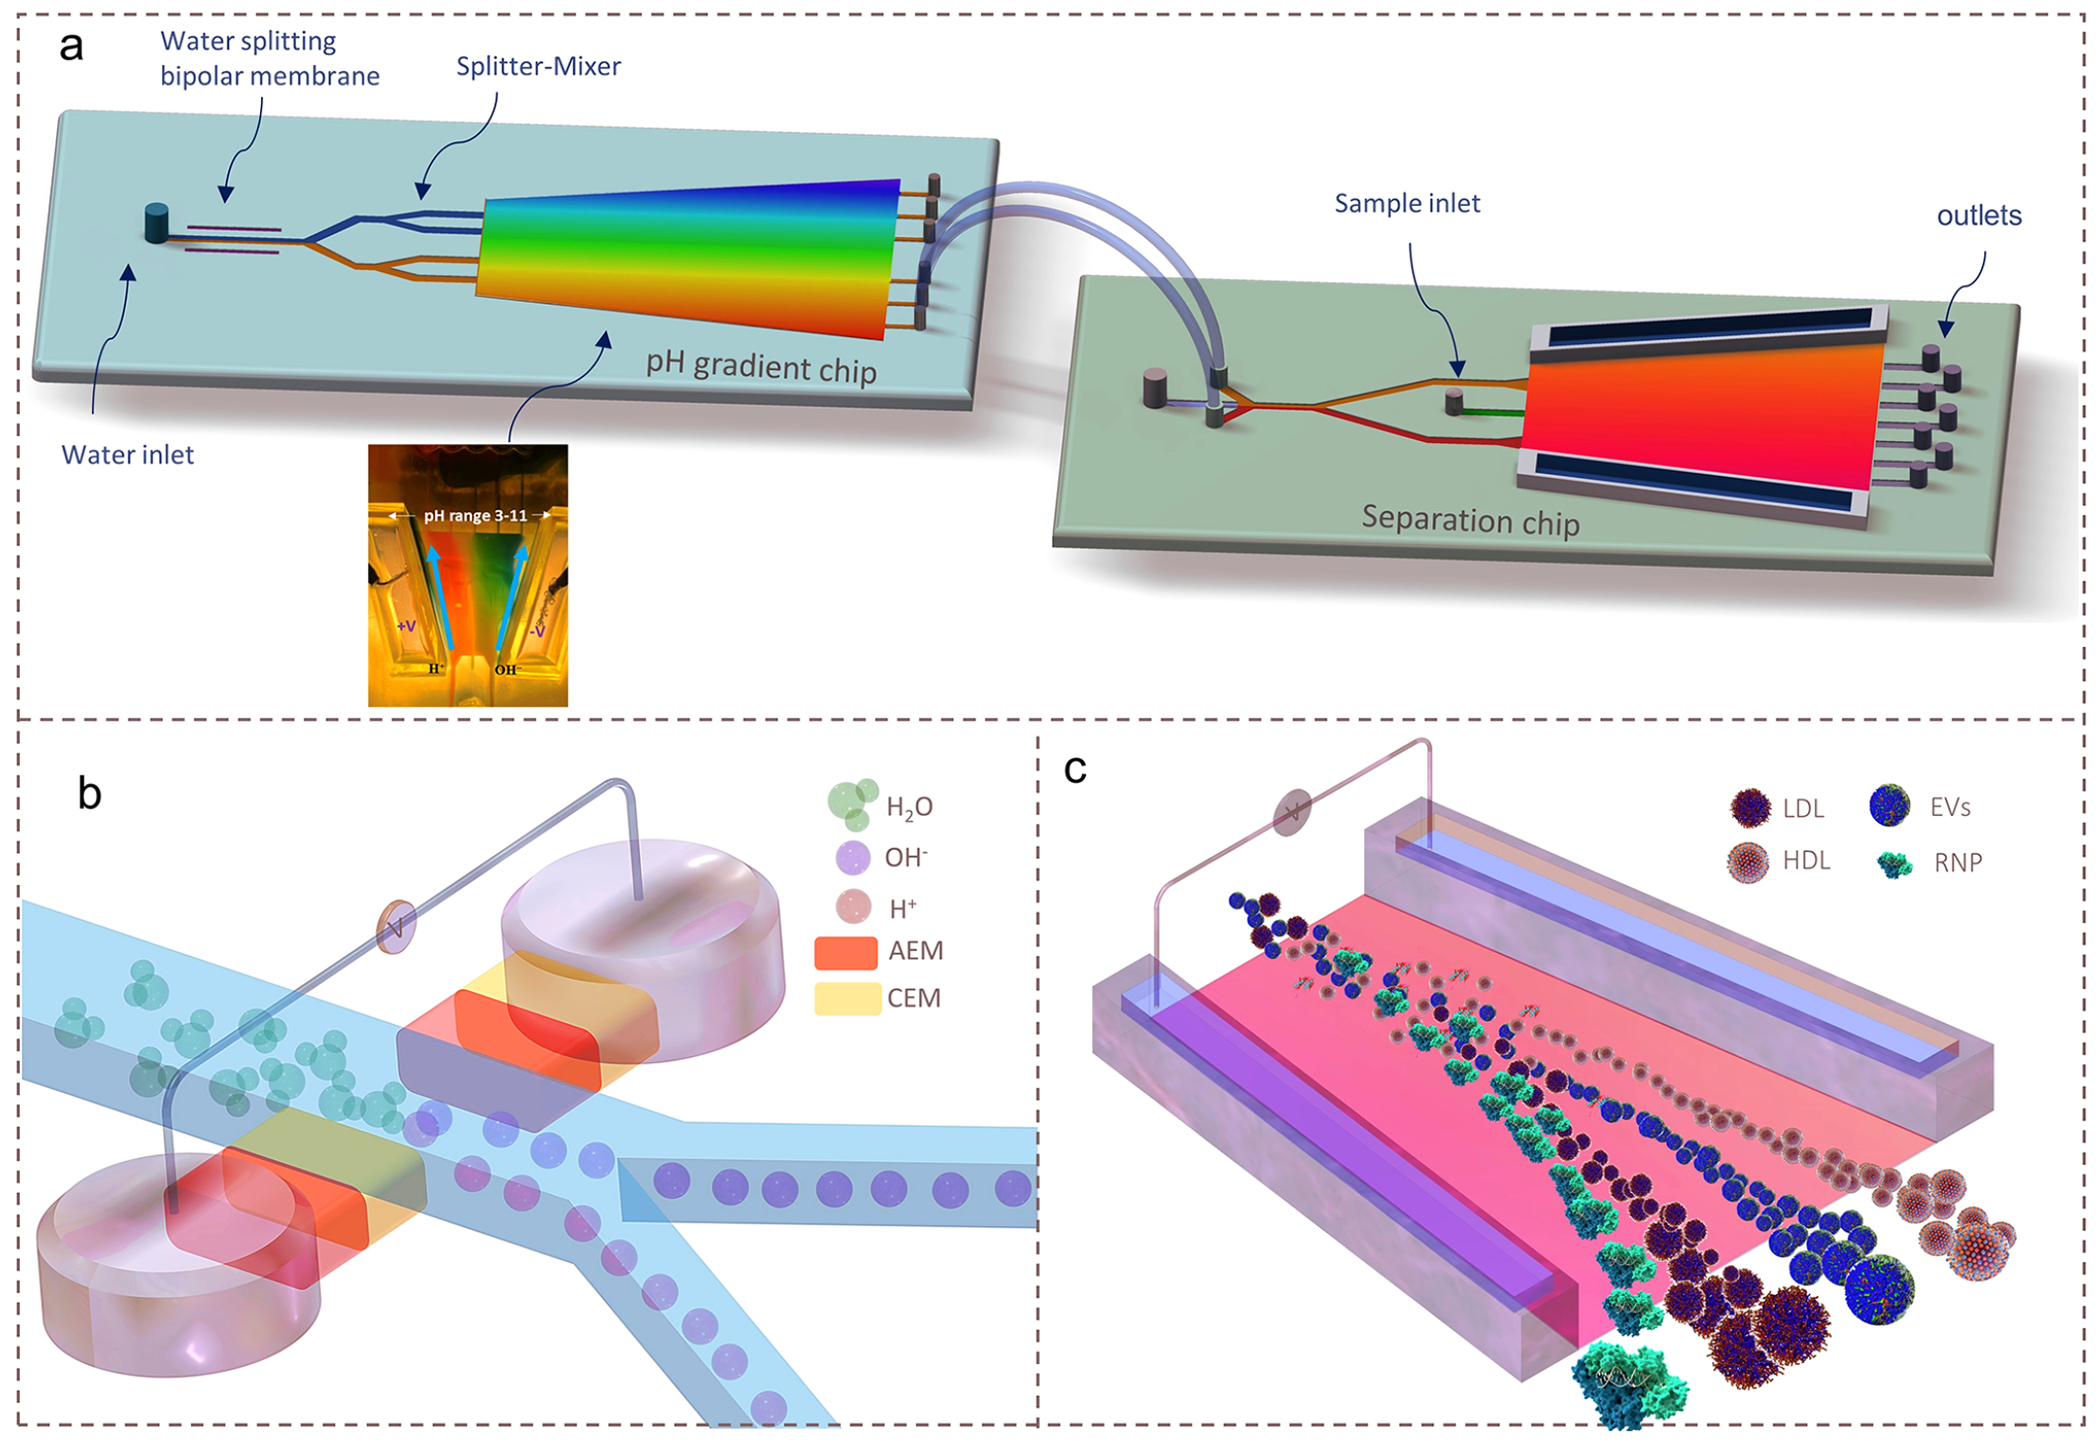
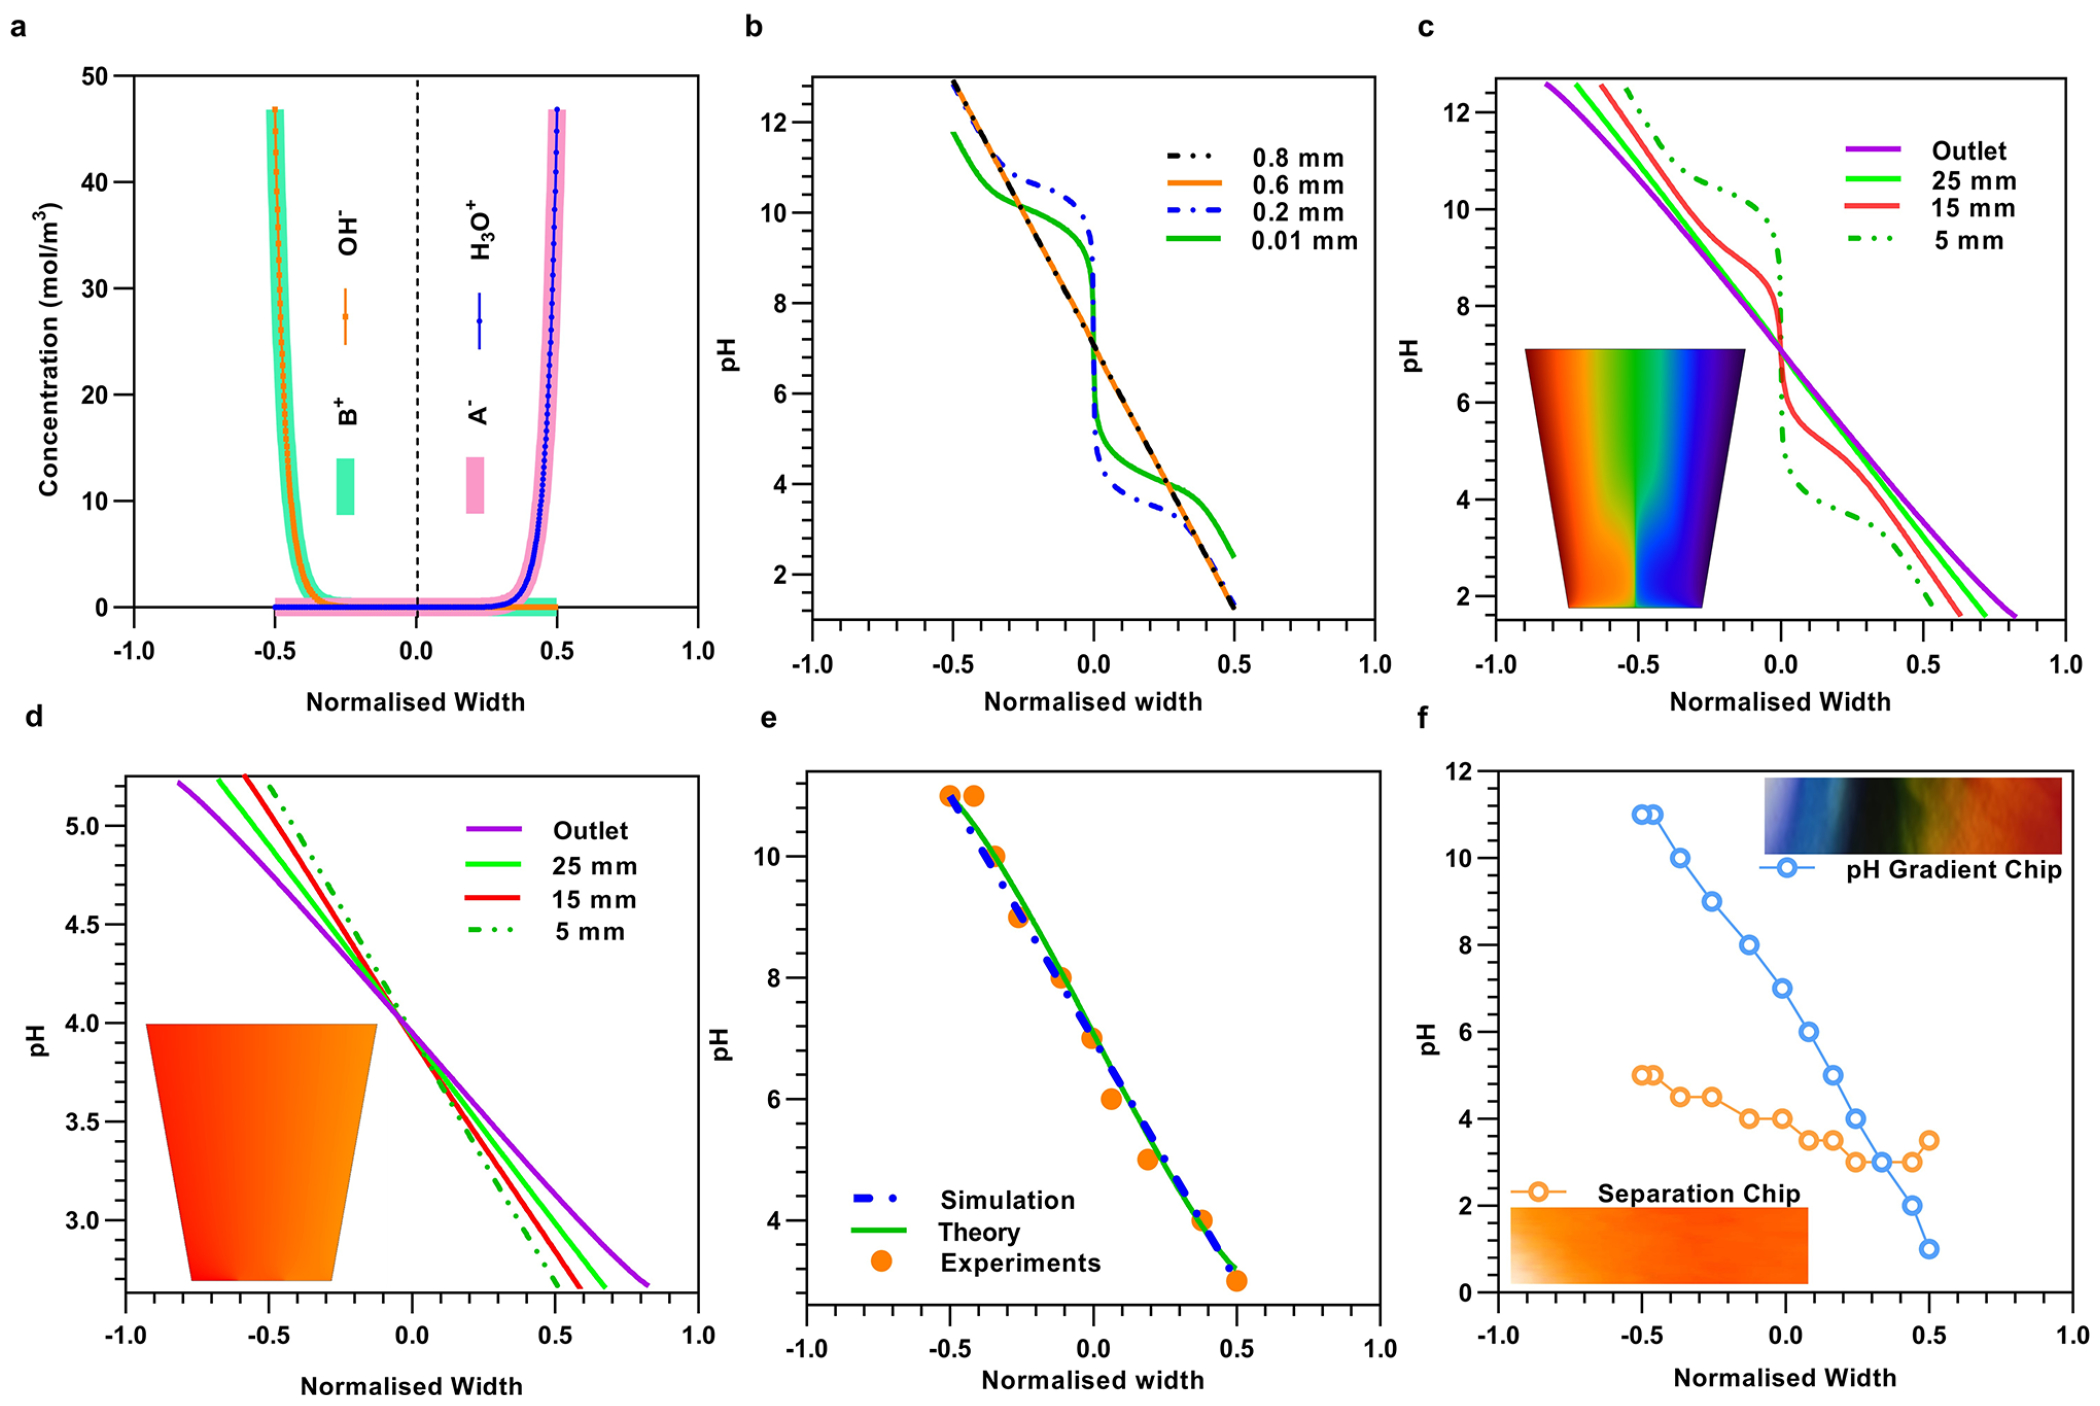
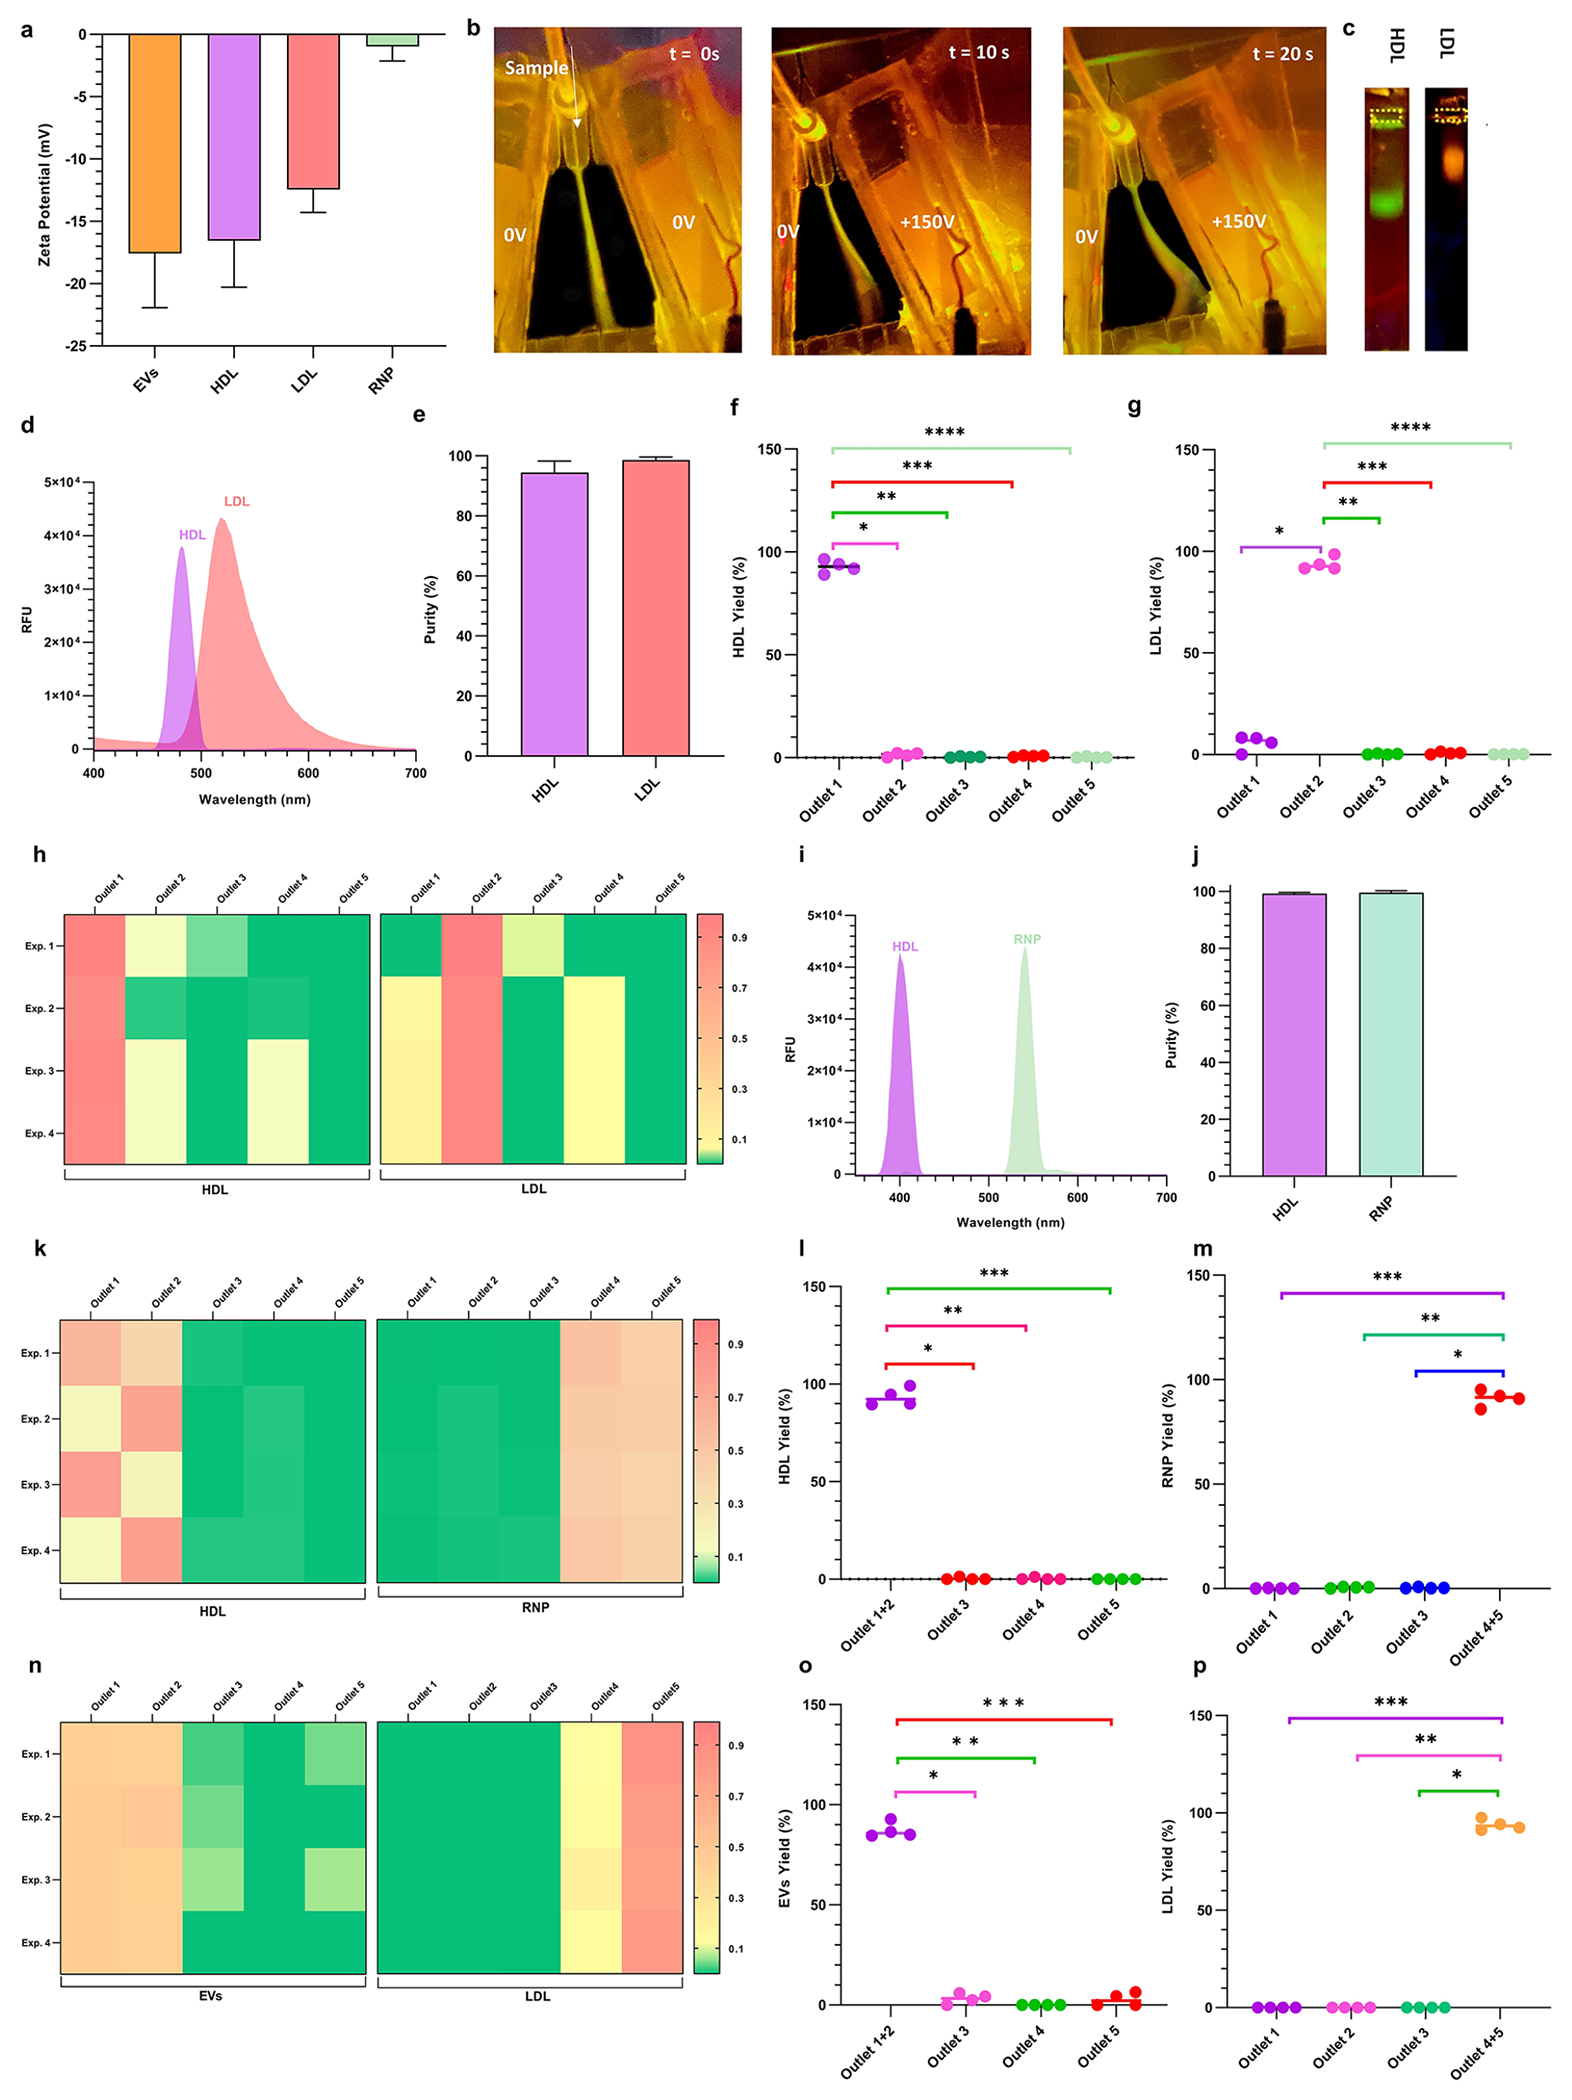
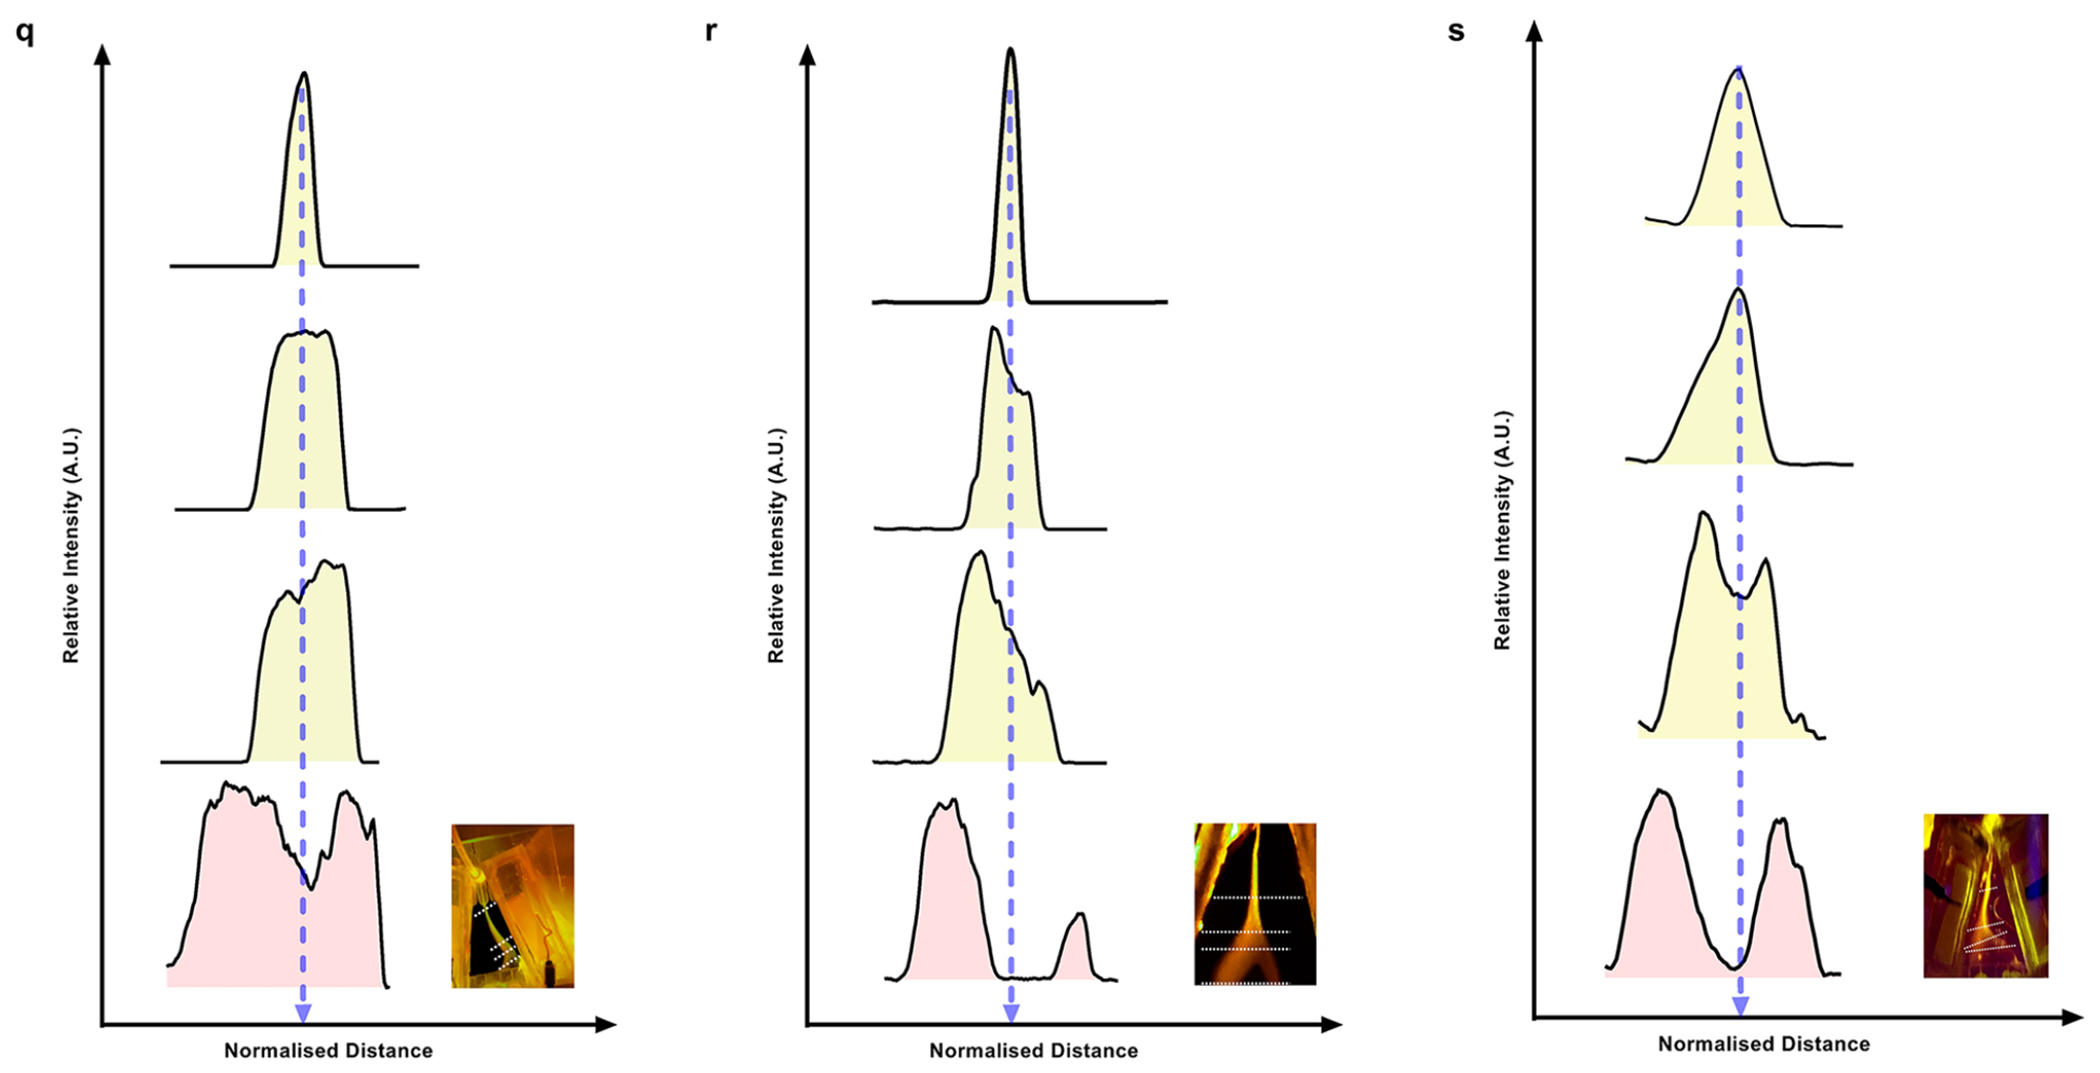
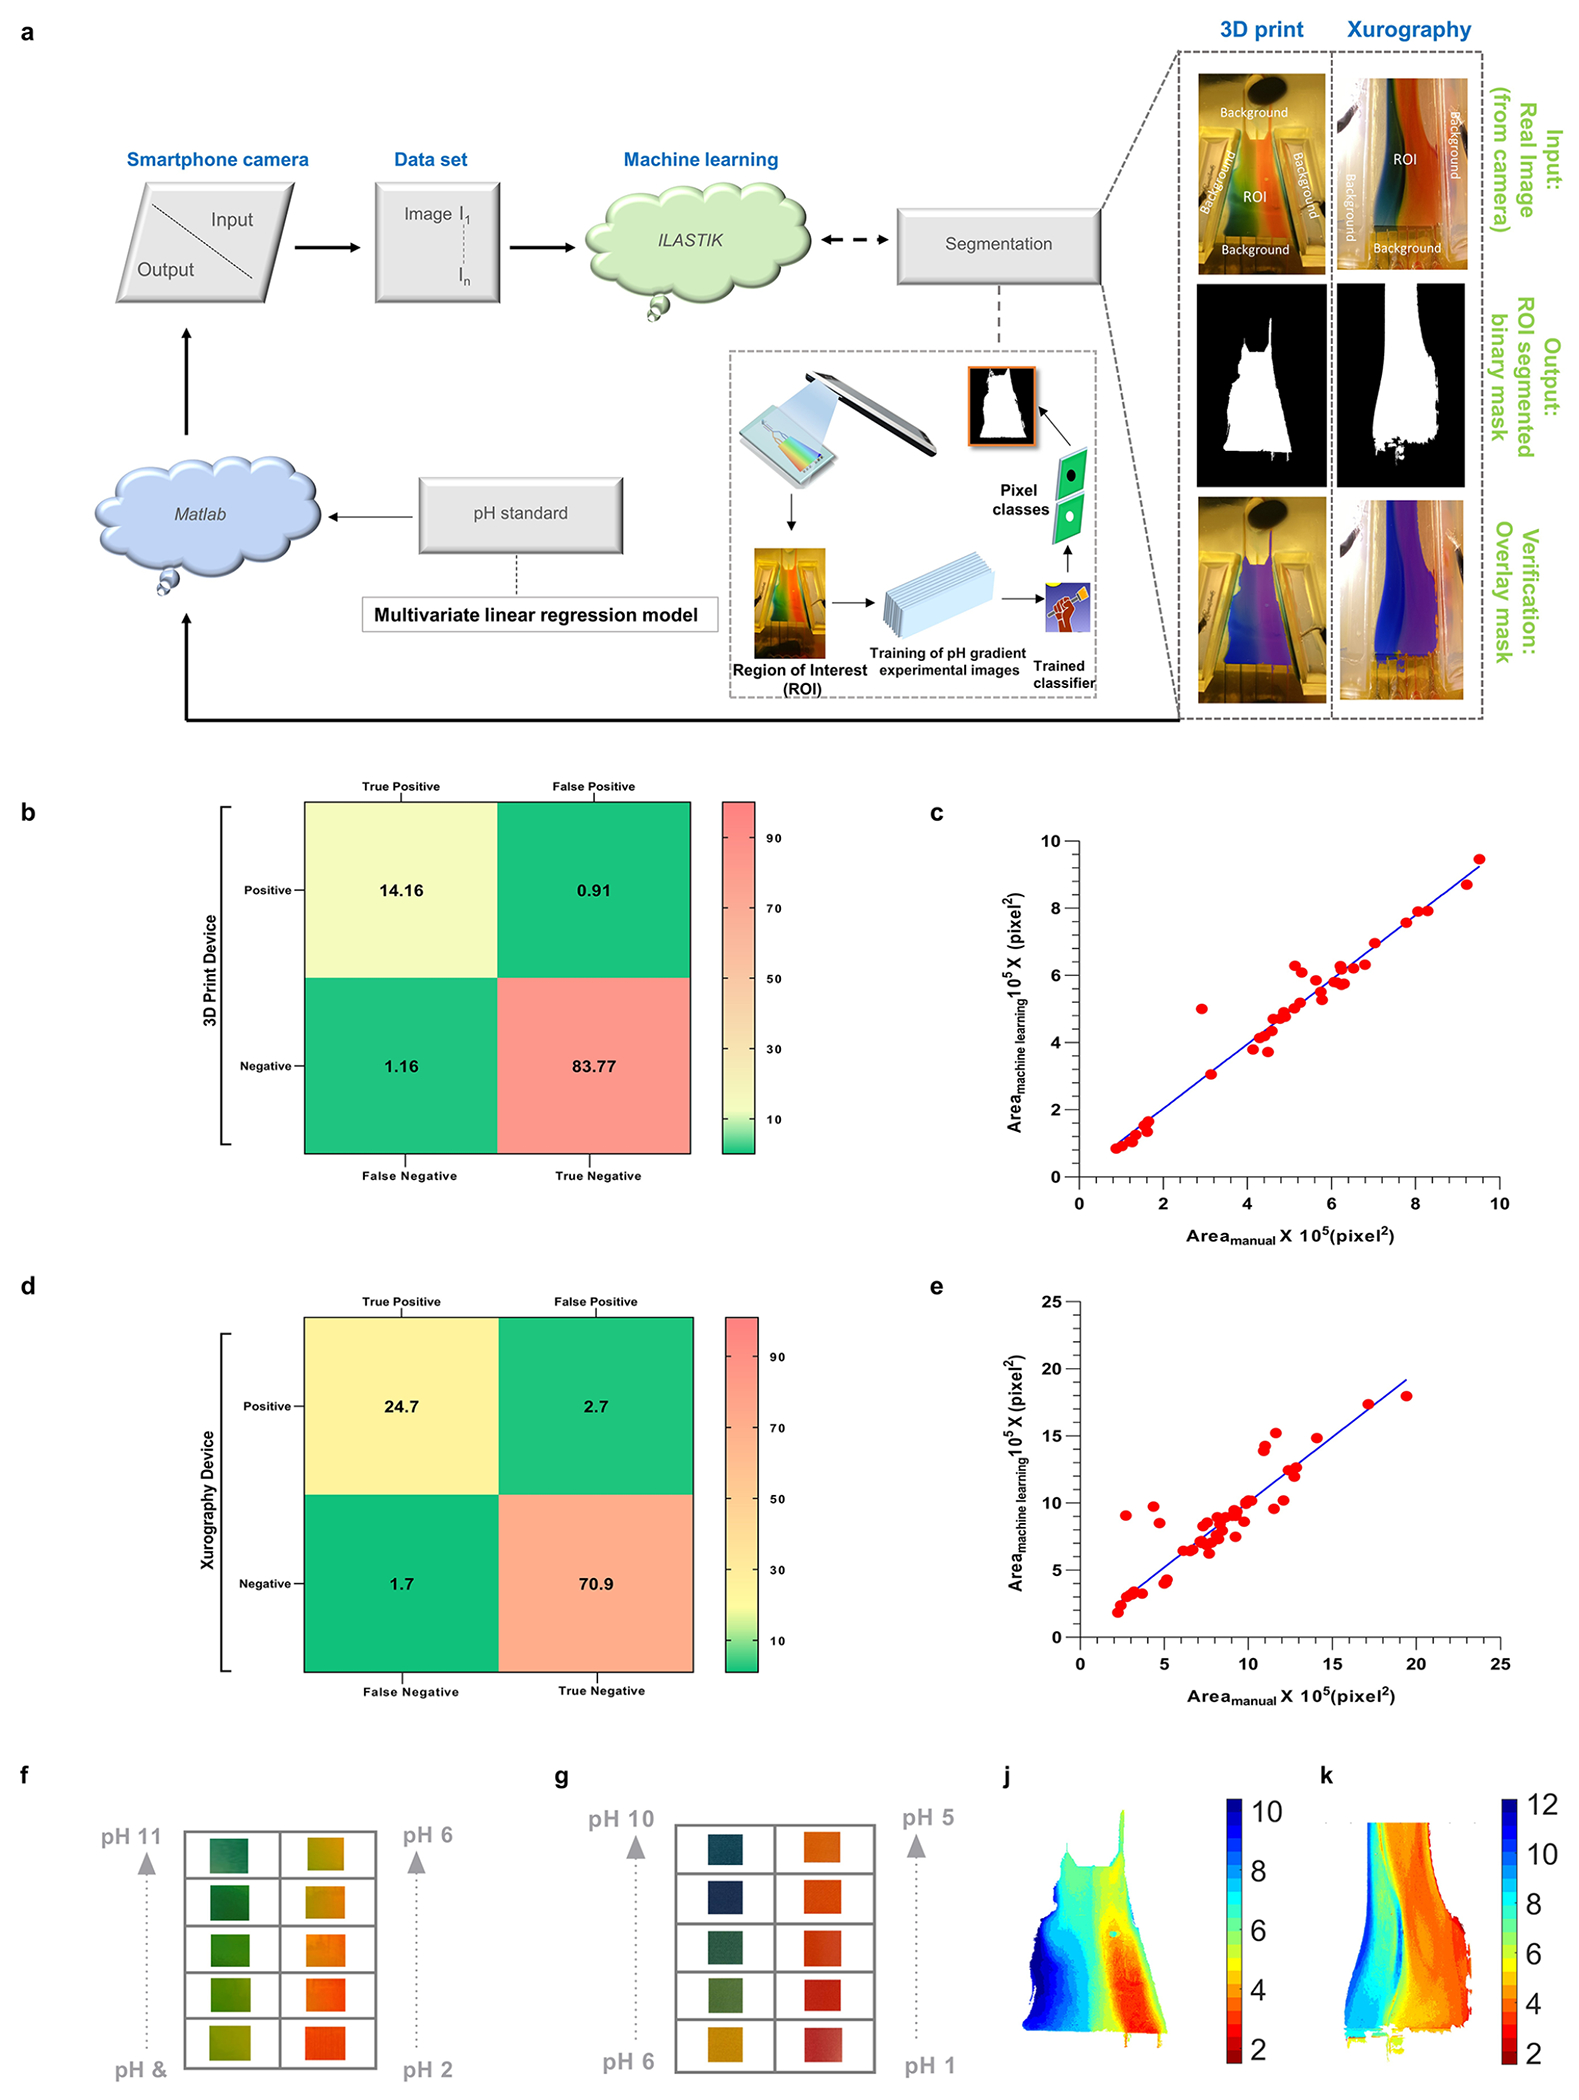
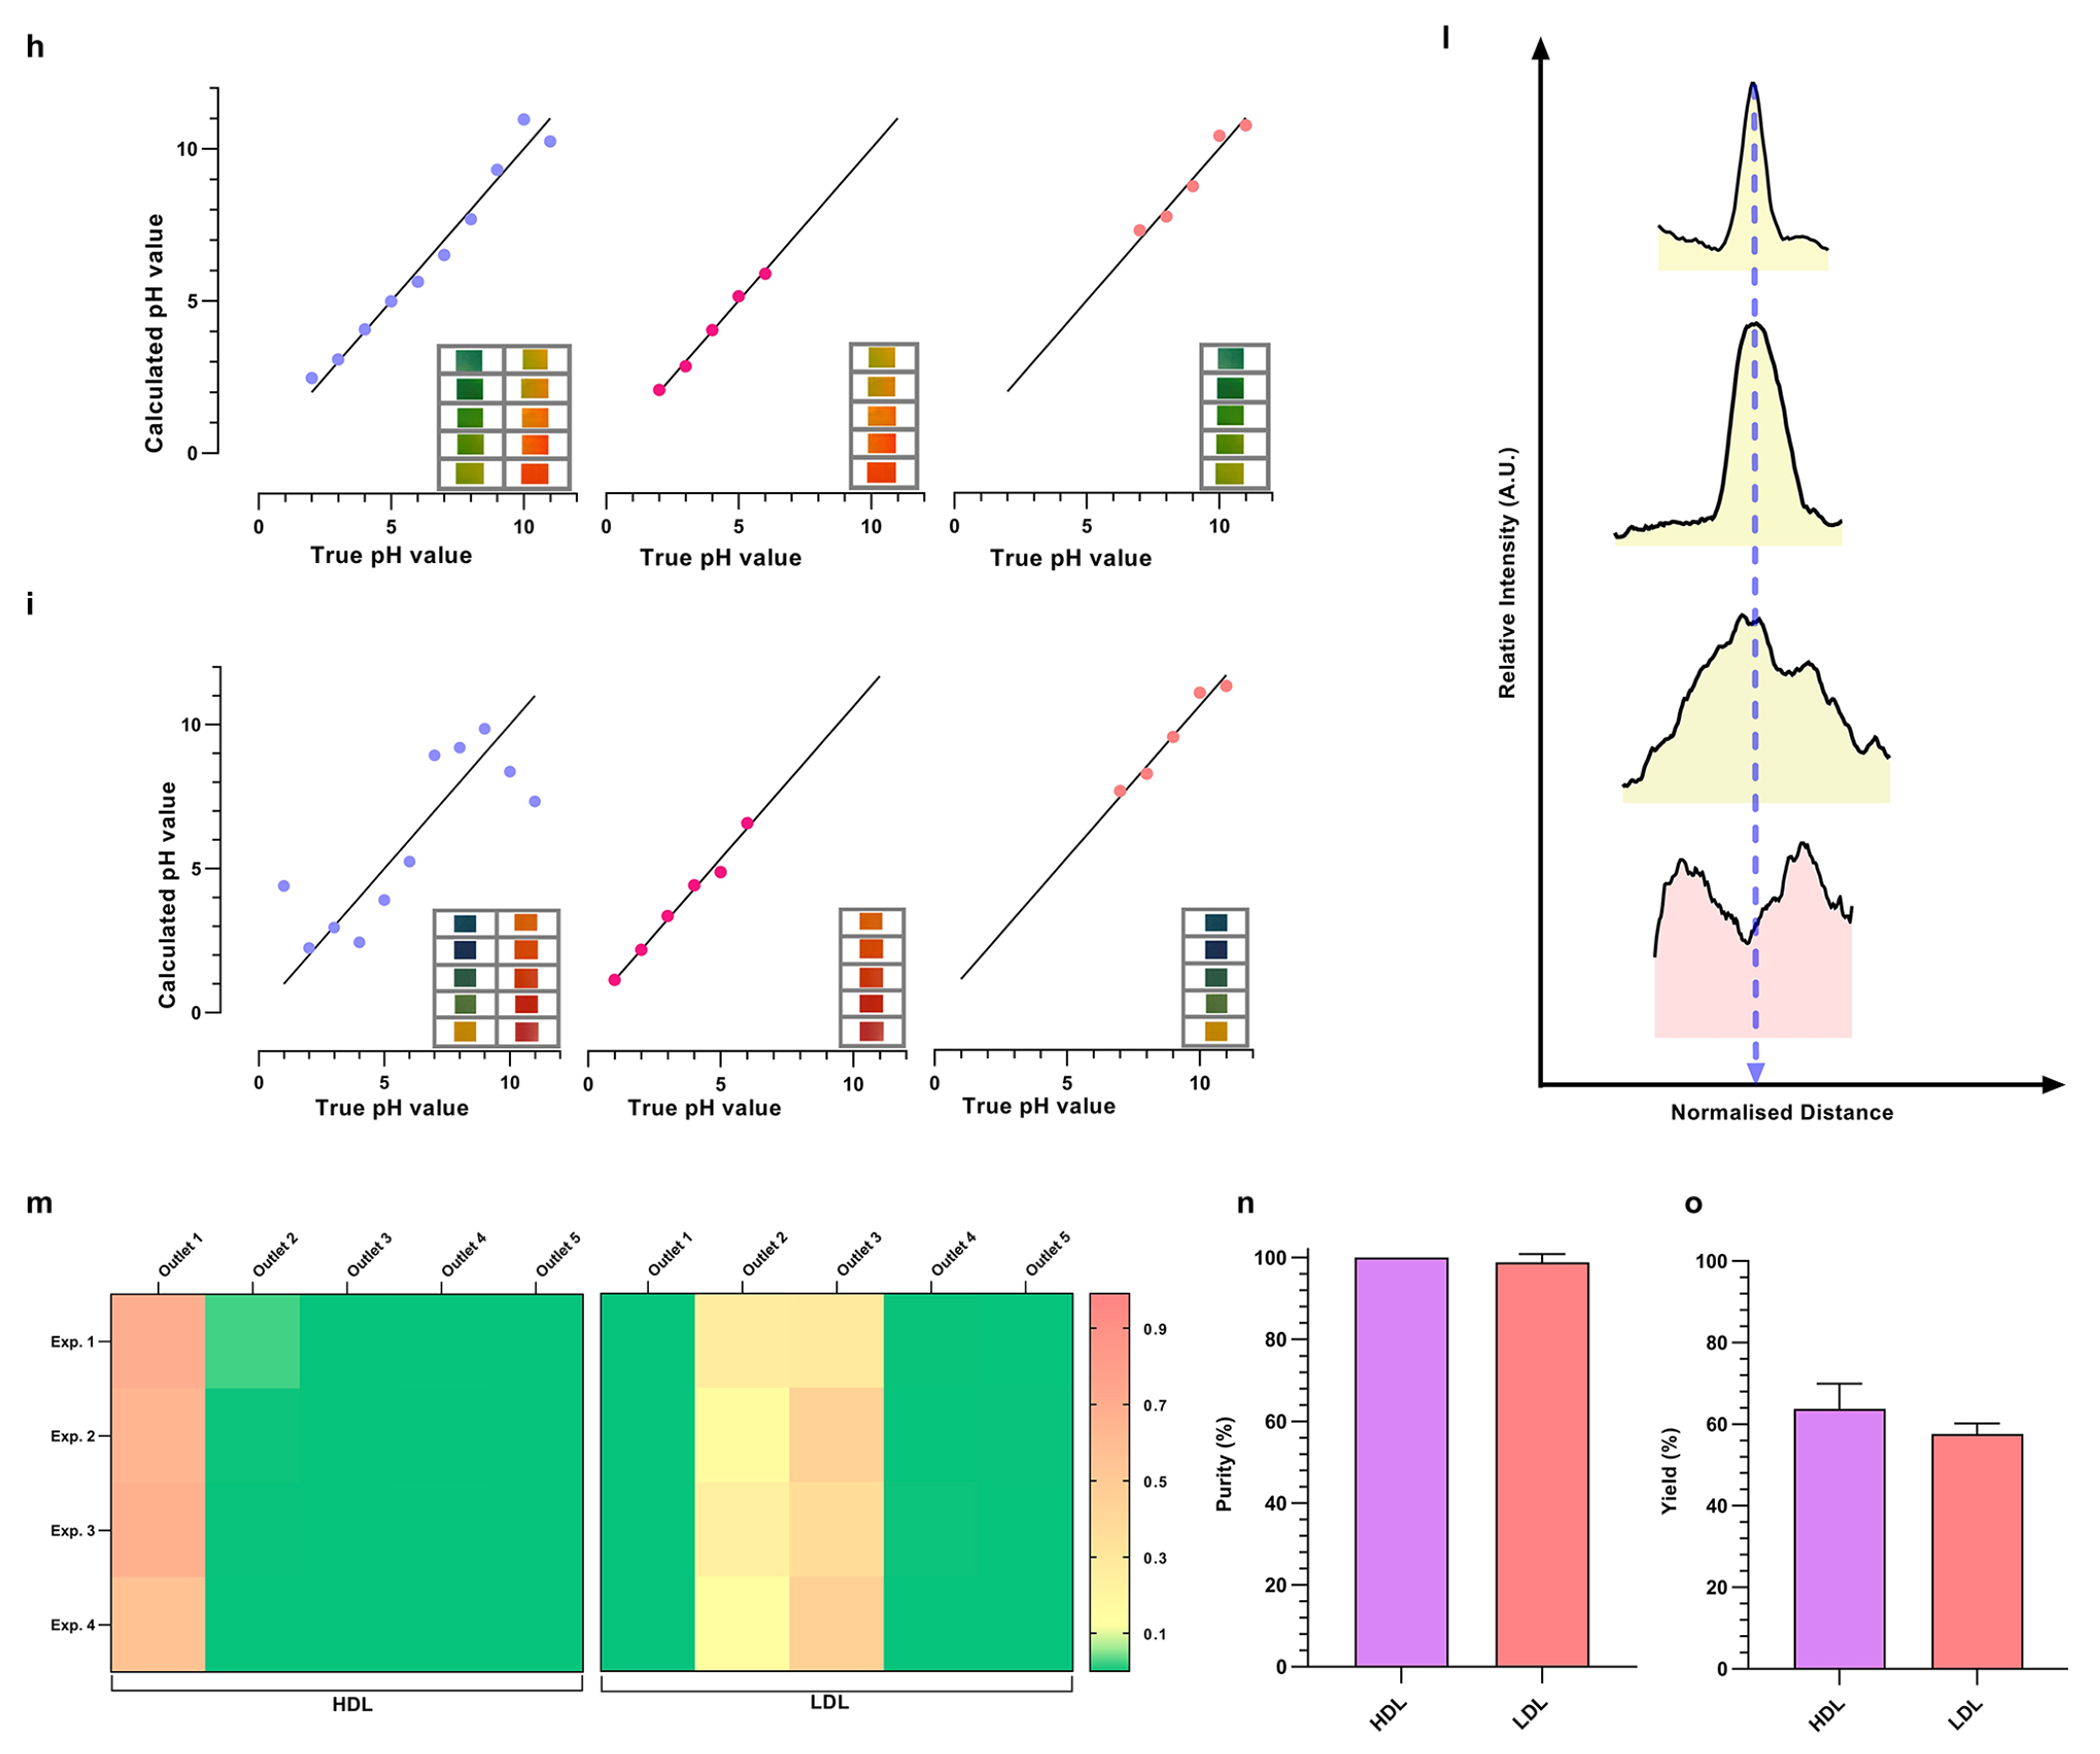
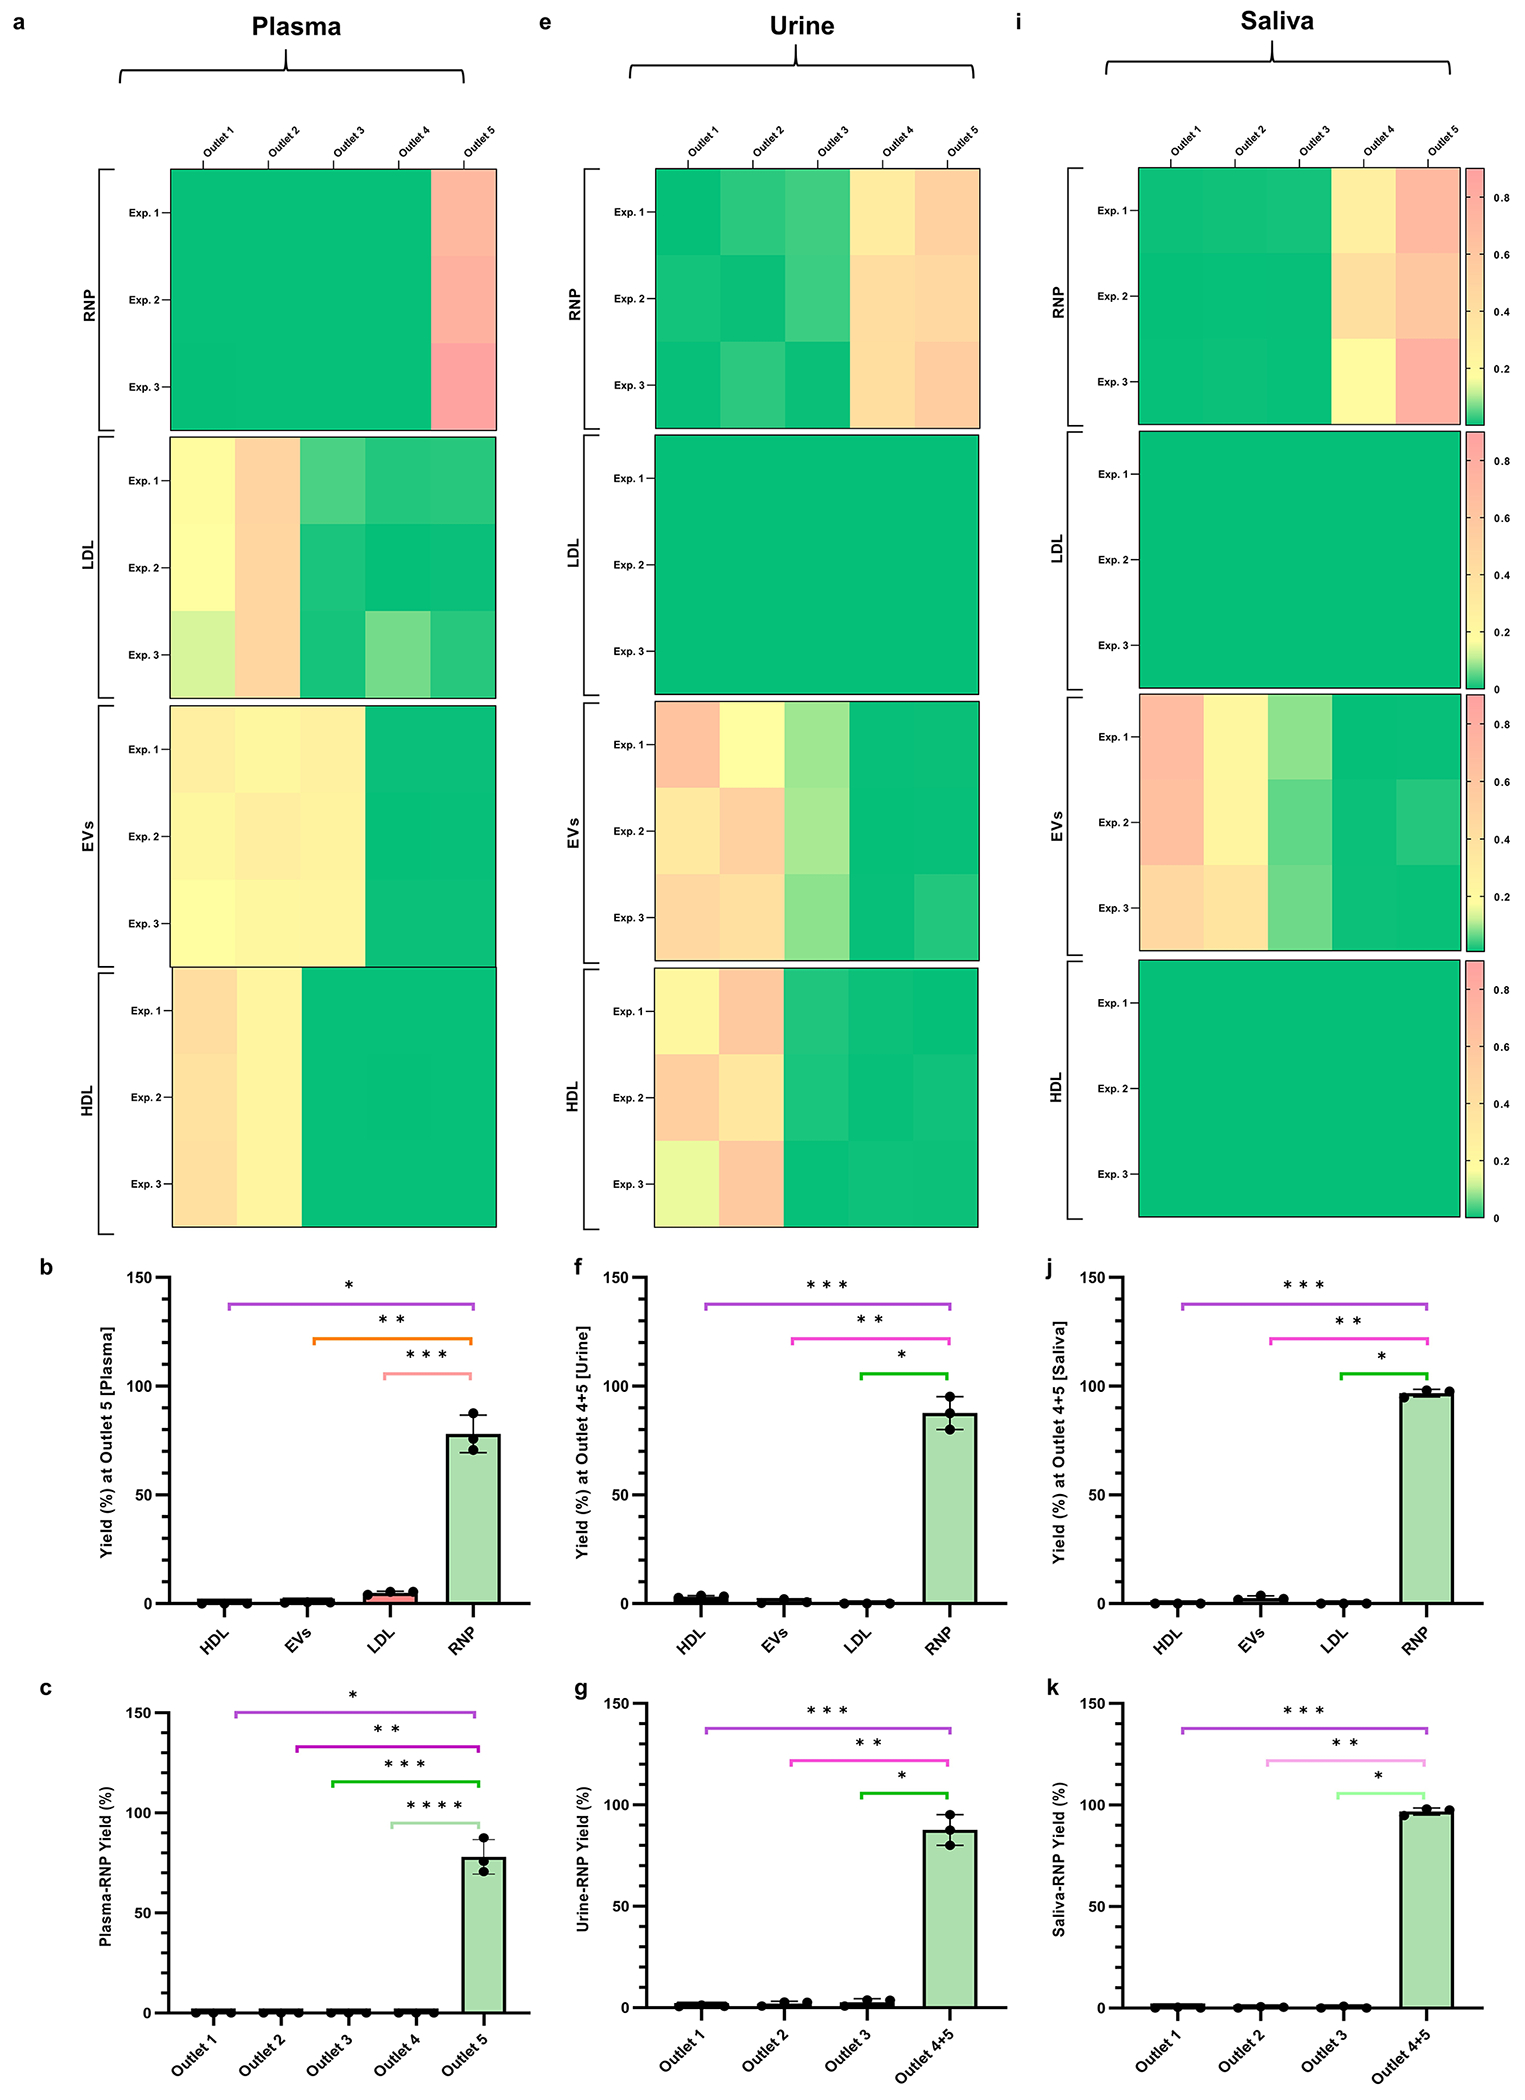
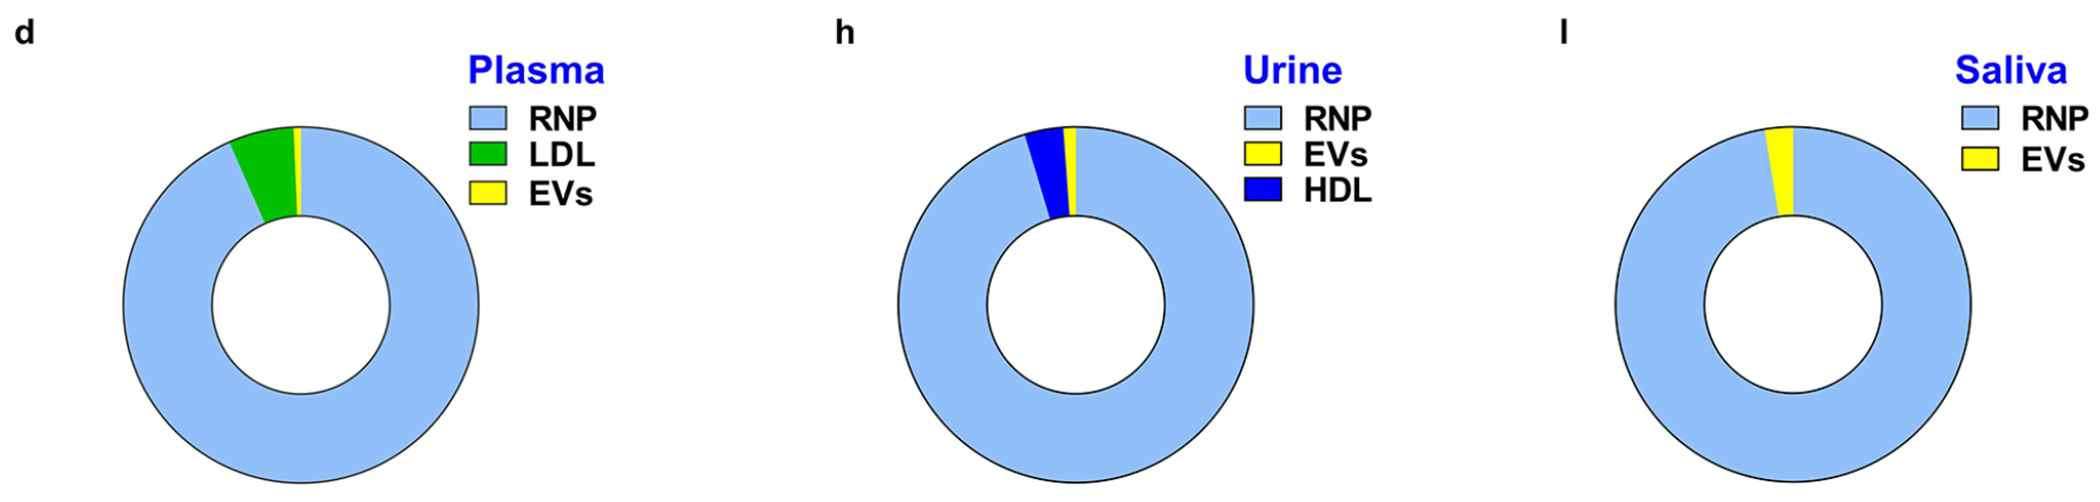
Extracellular nanocarriers (extracellular vesicles (EVs), lipoproteins, and ribonucleoproteins) of protein and nucleic acids mediate intercellular communication and are clinically adaptable as distinct circulating biomarkers. However, the overlapping size and density of the nanocarriers have so far prevented their efficient physical fractionation, thus impeding independent downstream molecular assays. Here, we report a bias-free high-throughput and high-yield continuous isoelectric fractionation nanocarrier fractionation technique based on their distinct isoelectric points. This nanocarrier fractionation platform is enabled by a robust and tunable linear pH profile provided by water-splitting at a bipolar membrane and stabilized by flow without ampholytes. The linear pH profile that allows easy tuning is a result of rapid equilibration of the water dissociation reaction and stabilization by flow. The platform is automated with a machine learning procedure to allow recalibration for different physiological fluids and nanocarriers. The optimized technique has a resolution of 0.3 ΔpI, sufficient to separate all nanocarriers and even subclasses of nanocarriers. Its performance is then evaluated with several biofluids, including plasma, urine, and saliva samples. Comprehensive, high-purity (plasma: >93%, urine: >95% and saliva: >97%), high-yield (plasma: >78%, urine: >87% and saliva: >96%), and probe-free isolation of ribonucleoproteins in 0.75 mL samples of various biofluids in 30 min is demonstrated, significantly outperforming affinity-based and highly biased gold standards having low yield and day-long protocols. Binary fractionation of EVs and different lipoproteins is also achieved with similar performance.

Keywords: exRNA nanocarriers; fractionation; isoelectric point; lipoproteins; pH; plasma; ribonucleoproteins.


Conflict of interest statement

The authors declare no competing financial interest.

Figures

Figure 1.
Figure 1.
Design and operation of the CIF microfluidic device. (a) Schematics of the integrated CIF microfluidic platform consisting of a pH gradient chip and a separation chip connected by transfer tubes. Inset shows a photograph of an experimentally generated pH profile in the pH gradient chip. (b) Illustration of the water-splitting module of the pH gradient chip which utilizes two bipolar membranes (AEM-CEM sandwiched together; AEM: anion-exchange membrane and CEM: cation-exchange membrane) to dissociate water into H3O+ and OH ions and subsequently transport them through splitter-mixer microchannels to obtain a stable and high-resolution pH gradient. (c) Illustration of the fractionation of RNP, HDL, LDL, and EVs based on their distinct pIs in the high-resolution pH gradient in the separation chip.
Figure 2.
Figure 2.
Theoretical, FEM simulations and experimental results of pH gradient generation and separation chip. (a) Simulated concentration profiles of monovalent buffer cation (A) and anion (B+) in Boltzmann equilibrium and H3O+ and OH in negative Boltzmann equilibrium along the normalized width of a straight channel. (b) Plot of the simulated pH profile at different downstream locations until stabilizing into a linear pH profile (Supplementary Figure 2c). (c) Inset: pH gradient surface plot obtained by finite element simulation (FEM) of the pH gradient chip. Line plots of the pH profiles at various downstream locations in the trapezoidal geometry, depicting stretching of linear pH profile by 2l × tan(θ)/w as compared to the straight channel (Supplementary Note 3, Supplementary Figure 2a,b). (d) Inset: pH gradient surface plot of the separation chip obtained by FEM with the same geometry parameters as the experimental device. Line plots of the pH profiles at various downstream locations of the trapezoidal geometry of the separation chip depict a high-resolution pH gradient. (e) Collapsed data of the pH profile at the normalized outlet location were obtained experimentally (Supplementary Figure 2d), theoretically, and by FEM numerical simulations of a trapezoidal geometry. (f) Top right inset: An experimental image snapshot of the trapezoidal chamber in the pH gradient chip whose colors are produced by pH indicator dye. The extracted pH profile (blue color) with respect to the normalized width of the trapezoidal chamber. Bottom left inset: Experimental image snapshot of the high-resolution pH gradient obtained in the separation chip by transferring a pH range of 3–5 from the pH gradient generation chip. The extracted pH profile in the separation chip (orange color) is shown with the normalized width of the trapezoidal chamber.
Figure 3.
Figure 3.
Demonstration of the separation of a binary equimolar mixture in 1× PBS buffer solution of HDL and LDL, HDL and RNP, and LDL and EVs. (a) Bar graphs of the ζ potential of EVs, HDL, LDL, and RNP measured in PBS buffer at pH = 7.4 (n = 7). (b) Sequential images of CFSE dye-tagged HDL (green) and Atto dye-tagged LDL (orange) mixture illustrating isoelectric focusing in the separation chip. When no voltage is applied, the mixture sample follows the injection streamline. At 150 V, the LLPs are deflected toward their respective isoelectric points, and eventually, two distinct streams are observed which are directed to two different outlets. (c) On-chip gel electrophoresis of samples collected from the HDL outlet (outlet 1) and LDL outlet (outlet 2) showing negligible cross-contamination during CIF separation. The outlet numbering starts from right to left. (d) Fluorescence spectrophotometer data of collected from the respective sample outlets 1 and 2 show a high fraction of HDL and LDL, respectively, with very little cross-contamination. (e) Purities of HDL and LDL are 94.43 ± 3.82% and 98.59 ± 1.01% for n = 4. (f) Box plots showing yield (obtained by Apo A1 ELISA) of HDL (n = 4) obtained at different outlets with statistically significant difference between HDL outlet (outlet 1) as compared to all other outlets (* indicates p = 2.51 × 10⁻⁶, ** indicates p = 9.37 × 10⁻⁶, *** indicates p = 8.94 × 10⁻⁶, **** indicates p = 9.01 × 10⁻⁶). (g) Box plots showing yield (obtained by ApoB ELISA) of LDL (n = 4) obtained at different outlets with statistically significant difference between the primary LDL outlet (outlet 2) as compared to all other outlets (* indicates p = 5.40 × 10⁻⁸, ** indicates p = 9.90 × 10⁻⁶, *** indicates p = 6.68 × 10⁻⁶, **** indicates p = 1.09 × 10⁻⁵). (h) Heatmaps of the yield for the separation of HDL and LDL across 4 different experiments for all 5 outlets of the separation chip. (i) Fluorescence spectrophotometer data of the sample collected at HDL outlet (outlet 1 + outlet 2) and RNP outlet (outlet 4 + outlet 5) show a pure separation of a binary mixture of HDL and RNP with very small cross-contamination. (j) Purities of HDL and RNP are 99.28 ± 0.37% and 99.61 ± 0.63%, respectively for n = 4. (k) Heatmaps of the yield for the separation of HDL (obtained by Apo A1 ELISA) and RNP (obtained by cas9 ELISA) across 4 different experiments for all 5 outlets of the separation chip. The HDL primarily exits outlet 1 and outlet 2, whereas RNP is coming out from the outlets 4 and 5. (l) Box plots showing a yield of HDL (n = 4) obtained at different outlets with statistically significant difference between HDL outlet (outlet 1 + outlet 2) as compared to all other outlets (* indicates p = 2.35 × 10⁻⁵, ** indicates p = 2.44 × 10⁻⁵, *** indicates p = 3.12 × 10⁻⁵). (m) Box plots showing the yield of RNP (n = 4) obtained at different outlets with statistically significant difference between RNP outlet (outlet 4 + outlet 5) as compared to all other outlets (* indicates p = 1.85 × 10⁻⁵, ** indicates p = 1.87 × 10⁻⁵, *** indicates p = 2.03 × 10⁻⁵). (n) Heatmaps of yield for the separation of LDL (obtained by ApoB ELISA) and commercial EVs (obtained by CD63 ELISA) across 4 different experiments for all 5 outlets of the separation chip. The LDL primarily exits outlets 4 and outlet 5, whereas EVs exit outlets 1 and 2. (o) Box plots showing the yield of commercial EVs (n = 4) obtained at different outlets with statistically significant differences between EVs outlet (outlet 1 + outlet 2) as compared to all other outlets (* indicates p = 1.63 × 10⁻⁷, ** indicates p = 6.33 × 10⁻⁸, *** indicates p = 2.30 × 10⁻⁵). (p) Box plots showing the yield of commercial EVs (n = 4) obtained at different outlets with statistically significant differences between LDL outlet (outlet 4 + outlet 5) as compared to all other outlets (* indicates p = 7.01 × 10⁻⁶, ** indicates p = 7.01 × 10⁻⁶, *** indicates p = 7.01 × 10⁻⁶). Line intensity plots were obtained from the fluorescence image of the separation chip for the fractionation of binary mixtures of (q) HDL and LDL, (r) HDL and RNP, and (s) LDL and EVs, respectively. All data in bar plots are shown as mean α standard deviation. For statistical significance, a two-tailed Student’s t test was used with Welch’s correction, and a p-value <0.05 is considered significant.
Figure 3.
Figure 3.
Demonstration of the separation of a binary equimolar mixture in 1× PBS buffer solution of HDL and LDL, HDL and RNP, and LDL and EVs. (a) Bar graphs of the ζ potential of EVs, HDL, LDL, and RNP measured in PBS buffer at pH = 7.4 (n = 7). (b) Sequential images of CFSE dye-tagged HDL (green) and Atto dye-tagged LDL (orange) mixture illustrating isoelectric focusing in the separation chip. When no voltage is applied, the mixture sample follows the injection streamline. At 150 V, the LLPs are deflected toward their respective isoelectric points, and eventually, two distinct streams are observed which are directed to two different outlets. (c) On-chip gel electrophoresis of samples collected from the HDL outlet (outlet 1) and LDL outlet (outlet 2) showing negligible cross-contamination during CIF separation. The outlet numbering starts from right to left. (d) Fluorescence spectrophotometer data of collected from the respective sample outlets 1 and 2 show a high fraction of HDL and LDL, respectively, with very little cross-contamination. (e) Purities of HDL and LDL are 94.43 ± 3.82% and 98.59 ± 1.01% for n = 4. (f) Box plots showing yield (obtained by Apo A1 ELISA) of HDL (n = 4) obtained at different outlets with statistically significant difference between HDL outlet (outlet 1) as compared to all other outlets (* indicates p = 2.51 × 10⁻⁶, ** indicates p = 9.37 × 10⁻⁶, *** indicates p = 8.94 × 10⁻⁶, **** indicates p = 9.01 × 10⁻⁶). (g) Box plots showing yield (obtained by ApoB ELISA) of LDL (n = 4) obtained at different outlets with statistically significant difference between the primary LDL outlet (outlet 2) as compared to all other outlets (* indicates p = 5.40 × 10⁻⁸, ** indicates p = 9.90 × 10⁻⁶, *** indicates p = 6.68 × 10⁻⁶, **** indicates p = 1.09 × 10⁻⁵). (h) Heatmaps of the yield for the separation of HDL and LDL across 4 different experiments for all 5 outlets of the separation chip. (i) Fluorescence spectrophotometer data of the sample collected at HDL outlet (outlet 1 + outlet 2) and RNP outlet (outlet 4 + outlet 5) show a pure separation of a binary mixture of HDL and RNP with very small cross-contamination. (j) Purities of HDL and RNP are 99.28 ± 0.37% and 99.61 ± 0.63%, respectively for n = 4. (k) Heatmaps of the yield for the separation of HDL (obtained by Apo A1 ELISA) and RNP (obtained by cas9 ELISA) across 4 different experiments for all 5 outlets of the separation chip. The HDL primarily exits outlet 1 and outlet 2, whereas RNP is coming out from the outlets 4 and 5. (l) Box plots showing a yield of HDL (n = 4) obtained at different outlets with statistically significant difference between HDL outlet (outlet 1 + outlet 2) as compared to all other outlets (* indicates p = 2.35 × 10⁻⁵, ** indicates p = 2.44 × 10⁻⁵, *** indicates p = 3.12 × 10⁻⁵). (m) Box plots showing the yield of RNP (n = 4) obtained at different outlets with statistically significant difference between RNP outlet (outlet 4 + outlet 5) as compared to all other outlets (* indicates p = 1.85 × 10⁻⁵, ** indicates p = 1.87 × 10⁻⁵, *** indicates p = 2.03 × 10⁻⁵). (n) Heatmaps of yield for the separation of LDL (obtained by ApoB ELISA) and commercial EVs (obtained by CD63 ELISA) across 4 different experiments for all 5 outlets of the separation chip. The LDL primarily exits outlets 4 and outlet 5, whereas EVs exit outlets 1 and 2. (o) Box plots showing the yield of commercial EVs (n = 4) obtained at different outlets with statistically significant differences between EVs outlet (outlet 1 + outlet 2) as compared to all other outlets (* indicates p = 1.63 × 10⁻⁷, ** indicates p = 6.33 × 10⁻⁸, *** indicates p = 2.30 × 10⁻⁵). (p) Box plots showing the yield of commercial EVs (n = 4) obtained at different outlets with statistically significant differences between LDL outlet (outlet 4 + outlet 5) as compared to all other outlets (* indicates p = 7.01 × 10⁻⁶, ** indicates p = 7.01 × 10⁻⁶, *** indicates p = 7.01 × 10⁻⁶). Line intensity plots were obtained from the fluorescence image of the separation chip for the fractionation of binary mixtures of (q) HDL and LDL, (r) HDL and RNP, and (s) LDL and EVs, respectively. All data in bar plots are shown as mean α standard deviation. For statistical significance, a two-tailed Student’s t test was used with Welch’s correction, and a p-value <0.05 is considered significant.
Figure 4.
Figure 4.
Machine learning based auto-CIF analyzer platform for improved pH judgment and experimental tunability. (a) Complete workflow of the auto-CIF analyzer with image analysis pipeline of xurography and 3D printed chips. (b) Confusion matrix generated for the 3D printed device shows excellent pixel-wise classification accuracy for ilastik classifier trained to identify the ROI. The numbers shown in the boxes represent the percentage prediction accuracy in which a pixel is classified in vertical labels as compared to its true class shown horizontally. (c) ROI area of test images for 3D printed chip predicted by auto-CIF versus measurement performed manually. The slope (0.96) and R2 value (0.96) indicate an excellent performance of the semantic segmentation module. (d) Confusion matrix generated for xurography-based chip also shows excellent pixel-wise classification accuracy for the ilastik classifier trained to identify the ROI. Similarly, as described above, the numbers shown in the boxes represent the percentage prediction accuracy in which a pixel is classified in vertical labels as compared to its true class shown horizontally. (e) Measurements of ROI area of test images for xurography-based chip predicted by auto-CIF versus measurement of ROI area performed manually. The slope (0.97) and R2 value (0.91) indicate excellent performance of the semantic segmentation module. (f) Array of images captured in the 3D printed device corresponding to different pH. (g) Series of images taken from a pH reference chart (Hydrion One Drop Indicator Solution Kit 1–11). (h) Graph of the calculated pH value versus the true pH value for a 3D printed chip obtained by multivariate linear regression using all the normalized mean RGB values as independent variable vectors (MSE = 0.573), only acidic (pH = [2–6]) normalized mean RGB values as independent variables (MSE = 0.175) and only basic (pH = [7–11]) normalized mean RGB values as independent variables (MSE = 0.468). (i) Graph of the calculated pH value versus the true pH value for xurography-based chip obtained by multivariate linear regression using all the normalized mean RGB values as independent variable vectors (MSE = 2.17), only acidic (pH = [1–6]) normalized mean RGB values as independent variables (MSE = 0.29) and only basic (pH = [7–11]) normalized mean RGB values as independent variables (MSE = 0.448). (j–k) pH heatmap of a representative 3D printed and xurography based chip after ROI detection using the image segmentation module, respectively. (l) The line intensity plots at different downstream locations are shown confirming the separation of HDL and LDL nanocarriers with auto-CIF analyzer. (m) Heatmaps of yield for the separation of HDL and LDL across 4 different plasma experiments (n = 4) in all 5 outlets of the separation chip. The HDL is coming primarily from outlet 1, whereas LDL is coming out from outlets 2 and 3. (n) Purities of HDL and LDL from human plasma are 99.99904 ± 0.00126% and 98.83900 ± 1.99225% respectively. (o) Yield of HDL and LDL from human plasma are 63.82 ± 6.1% and 57.67 ± 2.53% respectively.
Figure 4.
Figure 4.
Machine learning based auto-CIF analyzer platform for improved pH judgment and experimental tunability. (a) Complete workflow of the auto-CIF analyzer with image analysis pipeline of xurography and 3D printed chips. (b) Confusion matrix generated for the 3D printed device shows excellent pixel-wise classification accuracy for ilastik classifier trained to identify the ROI. The numbers shown in the boxes represent the percentage prediction accuracy in which a pixel is classified in vertical labels as compared to its true class shown horizontally. (c) ROI area of test images for 3D printed chip predicted by auto-CIF versus measurement performed manually. The slope (0.96) and R2 value (0.96) indicate an excellent performance of the semantic segmentation module. (d) Confusion matrix generated for xurography-based chip also shows excellent pixel-wise classification accuracy for the ilastik classifier trained to identify the ROI. Similarly, as described above, the numbers shown in the boxes represent the percentage prediction accuracy in which a pixel is classified in vertical labels as compared to its true class shown horizontally. (e) Measurements of ROI area of test images for xurography-based chip predicted by auto-CIF versus measurement of ROI area performed manually. The slope (0.97) and R2 value (0.91) indicate excellent performance of the semantic segmentation module. (f) Array of images captured in the 3D printed device corresponding to different pH. (g) Series of images taken from a pH reference chart (Hydrion One Drop Indicator Solution Kit 1–11). (h) Graph of the calculated pH value versus the true pH value for a 3D printed chip obtained by multivariate linear regression using all the normalized mean RGB values as independent variable vectors (MSE = 0.573), only acidic (pH = [2–6]) normalized mean RGB values as independent variables (MSE = 0.175) and only basic (pH = [7–11]) normalized mean RGB values as independent variables (MSE = 0.468). (i) Graph of the calculated pH value versus the true pH value for xurography-based chip obtained by multivariate linear regression using all the normalized mean RGB values as independent variable vectors (MSE = 2.17), only acidic (pH = [1–6]) normalized mean RGB values as independent variables (MSE = 0.29) and only basic (pH = [7–11]) normalized mean RGB values as independent variables (MSE = 0.448). (j–k) pH heatmap of a representative 3D printed and xurography based chip after ROI detection using the image segmentation module, respectively. (l) The line intensity plots at different downstream locations are shown confirming the separation of HDL and LDL nanocarriers with auto-CIF analyzer. (m) Heatmaps of yield for the separation of HDL and LDL across 4 different plasma experiments (n = 4) in all 5 outlets of the separation chip. The HDL is coming primarily from outlet 1, whereas LDL is coming out from outlets 2 and 3. (n) Purities of HDL and LDL from human plasma are 99.99904 ± 0.00126% and 98.83900 ± 1.99225% respectively. (o) Yield of HDL and LDL from human plasma are 63.82 ± 6.1% and 57.67 ± 2.53% respectively.
Figure 5.
Figure 5.
Fractionation of RNP from HDL, LDL and EVs from human plasma, urine and saliva samples. (a) Heatmaps of the yield of RNP, LDL, EVs, and HDL for all 5 outlets of the separation chip (n = 3) for plasma. (b) Column plots showing the yield of RNP, LDL, EVs, and HDL obtained at RNP outlet (outlet 5) (* indicates p = 4.08 × 10⁻³, ** indicates p = 4.13 × 10⁻³, and *** indicates p = 4.83 × 10⁻³). (c) Yield at RNP outlet (outlet 5) as compared with other outlets (* indicates p = 4.08 × 10⁻³, ** indicates p = 4.08 × 10⁻³, *** indicates p = 4.08 × 10⁻³, and **** indicates p = 4.08 × 10⁻³). (d) Pie chart depicting the purity (93.39 ± 0.88%) of RNP isolation from plasma (n = 3). (e) Heatmaps of the yield of RNP, LDL, EVs, and HDL for all 5 outlets of the separation chip (n = 3) for urine. (f) Column plots showing the yield of RNP, LDL, EVs and HDL obtained at RNP outlet (outlet 4 + 5) (* indicates p < 1 × 10⁻⁹, ** indicates p = 2.23 × 10⁻³, and *** indicates p = 2.55 × 10⁻³). (g) Yield at RNP outlet (outlet 4 + 5) as compared with other outlets (* indicates p = 1.73 × 10⁻³, ** indicates p = 2.15 × 10⁻³, and *** indicates p = 2.43 × 10⁻³). (h) Pie chart depicting the purity (95.38 ± 0.79%) of RNP isolation from urine (n = 3). (i) Heatmaps of the yield of RNP, LDL, EVs and HDL for all 5 outlets of the separation chip (n = 3) for saliva. (j) Column plots showing the yield of RNP, LDL, EVs and HDL obtained at RNP outlet (outlet 5) (* indicates p < 1 × 10⁻⁹, ** indicates p = 1.81 × 10⁻⁶, and *** indicates p = < 1 × 10⁻⁹). (k) Yield at RNP outlet (outlet 4 + 5) as compared with other outlets (* indicates p = 3.58 × 10⁻⁵, ** indicates p = 7.06 × 10⁻⁵, *** indicates p = 8.35 × 10⁻⁵). (l) Pie chart depicting the purity (97.43 ± 0.79%) of RNP isolation from saliva (n = 3).
Figure 5.
Figure 5.
Fractionation of RNP from HDL, LDL and EVs from human plasma, urine and saliva samples. (a) Heatmaps of the yield of RNP, LDL, EVs, and HDL for all 5 outlets of the separation chip (n = 3) for plasma. (b) Column plots showing the yield of RNP, LDL, EVs, and HDL obtained at RNP outlet (outlet 5) (* indicates p = 4.08 × 10⁻³, ** indicates p = 4.13 × 10⁻³, and *** indicates p = 4.83 × 10⁻³). (c) Yield at RNP outlet (outlet 5) as compared with other outlets (* indicates p = 4.08 × 10⁻³, ** indicates p = 4.08 × 10⁻³, *** indicates p = 4.08 × 10⁻³, and **** indicates p = 4.08 × 10⁻³). (d) Pie chart depicting the purity (93.39 ± 0.88%) of RNP isolation from plasma (n = 3). (e) Heatmaps of the yield of RNP, LDL, EVs, and HDL for all 5 outlets of the separation chip (n = 3) for urine. (f) Column plots showing the yield of RNP, LDL, EVs and HDL obtained at RNP outlet (outlet 4 + 5) (* indicates p < 1 × 10⁻⁹, ** indicates p = 2.23 × 10⁻³, and *** indicates p = 2.55 × 10⁻³). (g) Yield at RNP outlet (outlet 4 + 5) as compared with other outlets (* indicates p = 1.73 × 10⁻³, ** indicates p = 2.15 × 10⁻³, and *** indicates p = 2.43 × 10⁻³). (h) Pie chart depicting the purity (95.38 ± 0.79%) of RNP isolation from urine (n = 3). (i) Heatmaps of the yield of RNP, LDL, EVs and HDL for all 5 outlets of the separation chip (n = 3) for saliva. (j) Column plots showing the yield of RNP, LDL, EVs and HDL obtained at RNP outlet (outlet 5) (* indicates p < 1 × 10⁻⁹, ** indicates p = 1.81 × 10⁻⁶, and *** indicates p = < 1 × 10⁻⁹). (k) Yield at RNP outlet (outlet 4 + 5) as compared with other outlets (* indicates p = 3.58 × 10⁻⁵, ** indicates p = 7.06 × 10⁻⁵, *** indicates p = 8.35 × 10⁻⁵). (l) Pie chart depicting the purity (97.43 ± 0.79%) of RNP isolation from saliva (n = 3).

Similar articles

Cited by

References

    1. Mathieu M; Martin-Jaular L; Lavieu G; Théry C Specificities of Secretion and Uptake of Exosomes and Other Extracellular Vesicles for Cell-to-Cell Communication. Nat. Cell Biol 2019, 21 (1), 9–17. - PubMed
    1. Gruner HN; McManus MT Examining the Evidence for Extracellular RNA Function in Mammals. Nat. Rev. Genet 2021, 22 (7), 448–458. - PubMed
    1. Das S; Ansel KM; et al. The Extracellular RNA Communication Consortium: Establishing Foundational Knowledge and Technologies for Extracellular RNA Research. Cell 2019, 177 (2), 231–242. - PMC - PubMed
    1. Ainsztein AM; Brooks PJ; Dugan VG; Ganguly A; Guo M; Howcroft TK; Kelley CA; Kuo LS; Labosky PA; Lenzi R; et al. The NIH Extracellular RNA Communication Consortium. J. Extracell. Vesicles 2015, 4 (1), 27493. - PMC - PubMed
    1. Skog J; Würdinger T; Van Rijn S; Meijer DH; Gainche L; Curry WT; Carter BS; Krichevsky AM; Breakefield XO Glioblastoma Microvesicles Transport RNA and Proteins That Promote Tumour Growth and Provide Diagnostic Biomarkers. Nat. Cell Biol 2008, 10 (12), 1470–1476. - PMC - PubMed

Publication types