Review
. 2023 May 24;123(10):6612-6667.
doi: 10.1021/acs.chemrev.2c00649. Epub 2023 Apr 18.

Next Generation Gold Drugs and Probes: Chemistry and Biomedical Applications

Affiliations
Review

Next Generation Gold Drugs and Probes: Chemistry and Biomedical Applications

R Tyler Mertens et al. Chem Rev. .

Abstract

The gold drugs, gold sodium thiomalate (Myocrisin), aurothioglucose (Solganal), and the orally administered auranofin (Ridaura), are utilized in modern medicine for the treatment of inflammatory arthritis including rheumatoid and juvenile arthritis; however, new gold agents have been slow to enter the clinic. Repurposing of auranofin in different disease indications such as cancer, parasitic, and microbial infections in the clinic has provided impetus for the development of new gold complexes for biomedical applications based on unique mechanistic insights differentiated from auranofin. Various chemical methods for the preparation of physiologically stable gold complexes and associated mechanisms have been explored in biomedicine such as therapeutics or chemical probes. In this Review, we discuss the chemistry of next generation gold drugs, which encompasses oxidation states, geometry, ligands, coordination, and organometallic compounds for infectious diseases, cancer, inflammation, and as tools for chemical biology via gold-protein interactions. We will focus on the development of gold agents in biomedicine within the past decade. The Review provides readers with an accessible overview of the utility, development, and mechanism of action of gold-based small molecules to establish context and basis for the thriving resurgence of gold in medicine.


Conflict of interest statement

The authors declare the following competing financial interest(s): Samuel G. Awuah has patents pending to University of Kentucky Research Foundation.

Figures

Figure 1.
Figure 1.
Timeline of gold in medicine highlighting key steps toward the development of gold in the clinical setting.
Figure 2.
Figure 2.
Global map of auranofin clinical trial sites.
Figure 3.
Figure 3.
Crystal structure of Au(I)–protein adduct: (a) Au(I)–EhTrxR adduct (PDB code: 4A65, gold source: AuCN), (b) Au(I)–EhTrxR adduct (PDB code: 4CBQ, gold source: auranofin).
Figure 4.
Figure 4.
X-ray crystal structure of RAPTA-T/auranofin-nucleosome core particle (NCP). Structure reveals auranofin and RAPTA-T adduct sites. NCP is depicted on the left and zoomed adduct site displayed on the right. Gold atom (gold) bearing triethylphosphine (PEt3) bound to His113 (PDB: 5DNN, gold source: auranofin).
Figure 5.
Figure 5.
Crystal structure of the active site of Au-NDM-1 (PDB ID: 6LHE, gold source: auranofin) displaying Au ions as yellow spheres and omitting water molecules that contribute to a tetrahedral geometry. Annotated amino acid side chains within the protein active site are depicted in cyan with distinctly colored heteroatoms (N, blue; O, red; S, yellow).
Figure 6.
Figure 6.
Crystal structure of the active site of Au-MCR-1 (PDB ID: 6LI6, gold source: PEt3AuCl) displaying Au ions as yellow spheres. Annotated amino acid side chains within the protein active site is depicted in cyan with distinctly colored heteroatoms (N, blue; O, red; S, yellow). Triethylphosphine ligand is shown as green (C atoms) and orange (P atom).
Figure 7.
Figure 7.
(A) Schematic representation showing the important events in the catalytic cycle of the human Topoisomerase IB (TOP1) enzyme. Detailed step by step description of the catalytic process is given in ref . (B) General chemical structure and derivatives of Au(III) macrocycles. Reproduced from ref . Copyright 2014 American Chemical Society.
Figure 8.
Figure 8.
General schemes for affinity-based target identification and activity-based protein profiling.
Figure 9.
Figure 9.
Classical proteomics strategy to study drug action by gel electrophoresis, mass spectrometry, bioinformatics, and validation of the organometallic Au(III), Aubipyc. Reproduced from ref . Copyright 2015 Royal Society of Chemistry.
Figure 10.
Figure 10.
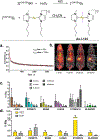
(a) P-chirogenic Au(III) molecule (AuPhos-19) and the alkyne functionalized probe (AuPhos-19-AP). (b) Assessment of cell viability in MDA-468 cells treated with parent molecule (AuPhos-19) versus AuPhos-19-AP. (c) Representation and result of biorthogonal Cu(I)-catalyzed azide–alkyne cycloaddition (CuAAC) reaction using an azide-tagged FITC fluorophore. Reproduced with permission from ref . Copyright 2022 Elsevier.
Figure 11.
Figure 11.
(a) Mechanism of cystine arylation via Au(III) complex reductive elimination. (b) Workflow of isotopically labeled destiobiotin activity based protein profiling (isoDTB-ABPP). Figure reproduced from ref . Copyright 2022 Royal Society of Chemistry.
Figure 12.
Figure 12.
(a) Structure of JHK-21. (b) Diagram illustrating the combined CRISPR-Cas9 screening method to identify JHK-21 cellular target and mode of action. Reproduced from ref . Copyright 2022 American Chemical Society.
Figure 13.
Figure 13.
Au(I) fluorescent alkynyl-naphthalimide complexes for cell imaging. Reproduced from ref . Copyright 2015 American Chemical Society.
Figure 14.
Figure 14.
Images of MCF-7 cells incubated with [L2-Au-PPh3] (100 μg/mL, 4 °C, 30 min). Excited at 405 nm, acquired 530–580 nm. Reproduced from ref . Copyright 2012 American Chemical Society.
Figure 15.
Figure 15.
(a) Recently reported NIR aza-BODIPY dinuclear Au(I) complexes, (b) azaBDP-Au-1 localization in 4T1 cells visualized by confocal microscopy. 4T1 cells were incubated with azaBDP–Au-Cl (red) for 45 min at 5 μM, nuclei counterstain with blue, fluorescent dye (Hoesct 33342, and mitochondria labeling was done with mito-tracker green, (c) azaBDP-Au1 distribution in tumor bearing mice. (d) An intravenous injection was administered, and images were collected at the indicated times. Accumulation of the compound in the tumor area was observed as shown with arrow. Reproduced with permission from ref . Copyright 2021 Elsevier.
Figure 16.
Figure 16.
(a) Synthetic scheme of Au-Avidin, (b) confocal imaging of HeLa cells treated with conjugate Au-Avidin for 4 h followed by a fluorescently tagged biotin. Reproduced from ref . Copyright 2015 Royal Society of Chemistry. (c) Synthesis of Au-AM self-assembled micelles. (D) Confocal microscopy images of A549 cells treated with Au-AM (33 μg/mL) (upper panel) for 4 h and without Au-AM (lower panel) under bright field or fluorescence field excitation at 405 nm. Reproduced from ref . Copyright 2016 Royal Society of Chemistry.
Figure 17.
Figure 17.
(a) Chemical structure of Au(III)-complexes Au-IPI and Au-BPB. (b) Fluorescence images of Au-BPB derivative (left, 365 nm excitation), mitochondria-specific Mito-tracker Red stain (middle, 546 nm excitation), and the merged image (right). Reproduced from ref . Copyright 2013 John Wiley and Sons.
Figure 18.
Figure 18.
Top. Chemical structure of [(ĈNĈ)AuH] complexes 1a–d, Bottom. (a) Emission spectrum of 1 b in dichloromethane. (b) Fluorescence microscopy image of HepG2 cells treated with 10 mm of 1 b for 1 h. (c) Bright field showing characteristics of apoptotic morphology change after irradiation. (d) Merged image. (e–h) Fluorescent images of HepG2 cells treated with 10 mm of 1b for 1 h followed by 405 nm laser irradiation at selected region (dashed box) for 2 min (e) bright field; (f) green channel; (g) red channel; (h) merged fluorescent image. Reproduced with permission from ref . Copyright 2020 John Wiley and Sons.
Figure 19.
Figure 19.
(a) Radioactivity curve of arterial blood determined by online blood sampling following the administration of Au–I-124 intravenously. (b) PET images gotten at different intervals following administration of Au–I-124 intravenously. (c) Representation of the radioactivity concentration in distinct organs at different time intervals assessed from the PET images following the administration of Au–I-124. (d) Representation of the radioactivity concentration (assessed from the PET images) and Au concentration (determined by ICP-MS) in distinct organs. Panels a–d are reproduced from ref . Copyright 2020 John Wiley and Sons.
Figure 20.
Figure 20.
(a) Inhibitory effect of auranofin on the activity of H. pylori TrxR. Reproduced from ref . Copyright 2016 Oxford University Press. (b) Combination studies of Auranofin with known H. pylori antibiotics. (c) Structures of NHC-Auranofin studied against H. pylori.
Figure 21.
Figure 21.
(A) Chemical structures of adamantane Au(I)-oxazole/thiazolidinone derivatives. (B) In vivo efficacy of Au complexes in combination with Miltefosine. Reproduced from ref . Copyright 2020 American Chemical Society.
Figure 22.
Figure 22.
(a) Chemical structures of three-coordinate Au(I), AuTri complexes. (b) Transmission electron microscopy of known cell death inducers, vehicle control, and AuTri-9 in MDA-MB-231. (c) Maximal cristae width. Data are representative of 10 cells chosen at random n = 10, where mitochondria were also chosen at random. (d) Immunoblots of OPA1, MFF, MFN1, and TOM20. Reproduced from ref . Copyright 2021 American Chemical Society.
Figure 23.
Figure 23.
(a) Au(I) complex Au-ICD induces immunogenic cell death (ICD) in a CT26 colon cancer cell. (b) Depiction of in vivo experiments carried out with Au-ICD. Reproduced from ref . Copyright 2020 American Chemical Society.
Figure 24.
Figure 24.
(a) Chemical structure of gold(I) complex bearing indomethacin moiety, identified as Au(I)-indo. (b) Assessment of the cell viability of HMLER-shEcad cells treated with Au(I)-indo only and in combination with z-VAD-FMK and PGE2 at 5 μM and 20 μM respectively. (c) In vivo efficacy of Au(I)-indo in 4T1 tumor bearing mice. Reproduced with permission from ref . Copyright 2023 Royal Society of Chemistry.
Figure 25.
Figure 25.
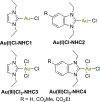
(a) Simple illustration of the life cycle of the SARS-CoV-2, golden bars represent gold drugs that target viral entry process and replication. Reproduced from ref . Copyright 2020 John Wiley and Sons. (b) Gold(I) and gold(III) benzimidazole complexes used in evaluating antiviral properties against SARS-CoV-2.
Figure 26.
Figure 26.
Diagram showing dissociation of pH sensitive gold(I)-loaded poly(β-amino ester)s micelle-like nanoparticles in the lysosomes and mechanism of synergistic induction of cell death. Reproduced from ref . Copyright 2015 American Chemical Society.
Figure 27.
Figure 27.
Formation of spherical micelles from polymeric auranofin. Reproduced from ref . Copyright 2015 American Chemical Society.
Figure 28.
Figure 28.
(A) Structure of Au(III) porphyrin–PEG conjugate [Au(TPP–COO–PEG5000–OCH3)]Cl (Au–P–P). (B) Changes in tumor volume in HCT116 xenografts tumor bearing mice after treatment with the indicated complexes. Reproduced with permission from ref . Copyright 2017 Royal Society of Chemistry.
Figure 29.
Figure 29.
(a) Structure of the trans isomer of Auoxo3. (b) An illustration showing Auoxo3 encapsulation within apoFt (Aft) nanocage. Reproduced with permission from ref . Copyright 2016 Royal Society of Chemistry.
Figure 30.
Figure 30.
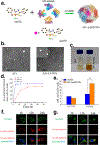
Development of the AFT-NP based Au(III) delivery system. (a) Loading of Au(III) into apoferritin. (b) Acquired SEM images of AFt nanocage and AFt-Au(III) NPs. (c) AFt and AFt-(III) NPs in glass vials. (d) Graph showing Au(III) release in vitro from the AFt-Au(III) NPs. (f) The ability of AFt-Au(III) NPs cells to target U87MG cells in vitro is assessed via ICP-MS analysis. (g) The intracellular uptake of Cy5.5-labeled AFt-Au(III) NPs by U87MG tumor cells is examined by confocal microscopy. (h) The intracellular uptake of Cy5.5-labeled AFt-Au(III) NPs by HL-7702 tumor cells is examined by confocal microscopy. Reproduced from ref . Copyright 2020 American Chemical Society.
Figure 31.
Figure 31.
Illustration of drug-loaded peptides and structures of drugs and peptides used in this study. Reproduced from ref . Copyright 2022 American Chemical Society.
Figure 32.
Figure 32.
Schematic illustration of the noncovalent self-assembled Au(III) porphyrin and the heat/acid dual responsiveness of cRGD-AuPNSs for synergistic chemo-photothermal therapy of a tumor. Reproduced from ref . Copyright 2022 American Chemical Society.
Chart 1.
Chart 1.
Clinically Used Gold Complexes
Chart 2.
Chart 2.
Schematic Reaction for Bioconjugation of meso-Unsubstituted Gold(III) Porphyrins with GSH under Physiological Conditions
Chart 3.
Chart 3.
Chemical Structure of Au(I) Thiosemicarbazones
Chart 4.
Chart 4.
Chemical Structures of DNA Interfering Substituted Au(III) Tetraphenylporphyrin
Chart 5.
Chart 5.
Chemical Structures of [Aun(R–ĈNĈ)n(NHC)]n+ as Inhibitors of TopI
Chart 6.
Chart 6.
Chemical Structures of Pyridyl and Isoquinolylamido Au(III) Complexes
Chart 7.
Chart 7.
Chemical Structures of DNA Targeting Au(III) Pincer Complexes Supported by Carbazole Bis-carbene Ligands
Chart 8.
Chart 8.
Benzophenone Photoaffinity Tag Au(III)-Porphyrin Probe
Chart 9.
Chart 9.
Chemical Structures of Some Au(III)-NHC Probes
Chart 10.
Chart 10.
Chemical Structures of BODIPY Au(I) Probes
Chart 11.
Chart 11.
Chemical Structures of Luminescent Re–Au Complexes
Chart 12.
Chart 12.
Reaction Scheme for Synthesis of Luminescent Re–Au Complexes Bearing NHC Ligands
Chart 13.
Chart 13.
Chemical Structures of Luminescent Ru–Au Complexes
Chart 14.
Chart 14.
Chemical Structure of Phosphorescent Ir–Au Complexes
Chart 15.
Chart 15.
Chemical Structures of Some Radioactive Au(III) Complexes
Chart 16.
Chart 16.
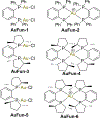
Chemical Structures of Bisphosphine-Au(I) Antifungal Complexes
Chart 17.
Chart 17.
Chemical Structures of Au(III)-Azoles
Chart 18.
Chart 18.
Chemical Structures of Au(I)-NHC Complexes Studied for Their Antibacterial Activities
Chart 19.
Chart 19.
Chemical Structures of Au(I)/(III)-NHC Complexes Studied for Their Antibacterial Activities
Chart 20.
Chart 20.
Chemical Structures of Au(I) Benzothiazoles
Chart 21.
Chart 21.
Chemical Structure of Alkynyl Au(I) Complexes and Their Antibacterial Activity
Chart 22.
Chart 22.
Chemical Structures of Au(III)-Dithiolate Studied for Their Antibacterial Activity
Chart 23.
Chart 23.
Chemical Structure of Cyclometalated Au(III) Complexes and Kanamycin with Their Bactericidal Activity
Chart 24.
Chart 24.
Chemical Structures and Antileishmanial Activity of Auranofin and Amphotericin B
Chart 25.
Chart 25.
Chemical Structures of Benzimidazole Supported Au(I)/Au(III) Antileishmanial Agents
Chart 26.
Chart 26.
Chemical Structures of Au(I)/Au(III)-NHC Antileishmanial Complexes
Chart 27.
Chart 27.
Chemical Structures of Au(I) Oxazole Complexes
Chart 28.
Chart 28.
Synthetic Scheme to Obtain a Library of Gold(III) Dithiocarbamate Complexes
Chart 29.
Chart 29.
Synthetic Scheme and SAR Depicted Library of Cyclometalated Gold(III) Phosphine Complexes
Chart 30.
Chart 30.
Cyclometalated Gold(III) Complexes Ligated to Metformin and Derivatives Thereof
Chart 31.
Chart 31.
Chemical Structures of Targeting Ligand Tethered Gold Agents
Chart 32.
Chart 32.
Synthetic Scheme and Structures of Gold Complexes Investigated for Anti-inflammatory Effects in Several Cancer Cell Lines
Chart 33.
Chart 33.
Synthetic Scheme and Depiction of Au(I) Complexes Used for Anti-inflammatory Purposes

References

    1. Shaw CF Gold-Based Therapeutic Agents. Chem. Rev. 1999, 99, 2589–2600. - PubMed
    1. Barnard PJ; Berners-Price SJ Targeting the Mitochondrial Cell Death Pathway with Gold Compounds. Coord. Chem. Rev. 2007, 251, 1889–1902.
    1. Best SL; Sadler PJ Gold Drugs: Mechanism of Action and Toxicity. Gold Bull. 1996, 29, 87–93.
    1. Dominelli B; Correia JDG; Kühn FE Medicinal Applications of Gold(I/III)-Based Complexes Bearing N-Heterocyclic Carbene and Phosphine Ligands. J. Organomet. Chem. 2018, 866, 153–164.
    1. Glišić BĐ; Djuran MI Gold Complexes as Antimicrobial Agents: An Overview of Different Biological Activities in Relation to the Oxidation State of the Gold Ion and the Ligand Structure. Dalton Trans. 2014, 43, 5950–5969. - PubMed

Publication types

MeSH terms