. 2023 May 22;58(10):898-914.e7.
doi: 10.1016/j.devcel.2023.03.020. Epub 2023 Apr 17.

Dynamic changes in P300 enhancers and enhancer-promoter contacts control mouse cardiomyocyte maturation

Affiliations

Dynamic changes in P300 enhancers and enhancer-promoter contacts control mouse cardiomyocyte maturation

Pingzhu Zhou et al. Dev Cell. .

Abstract

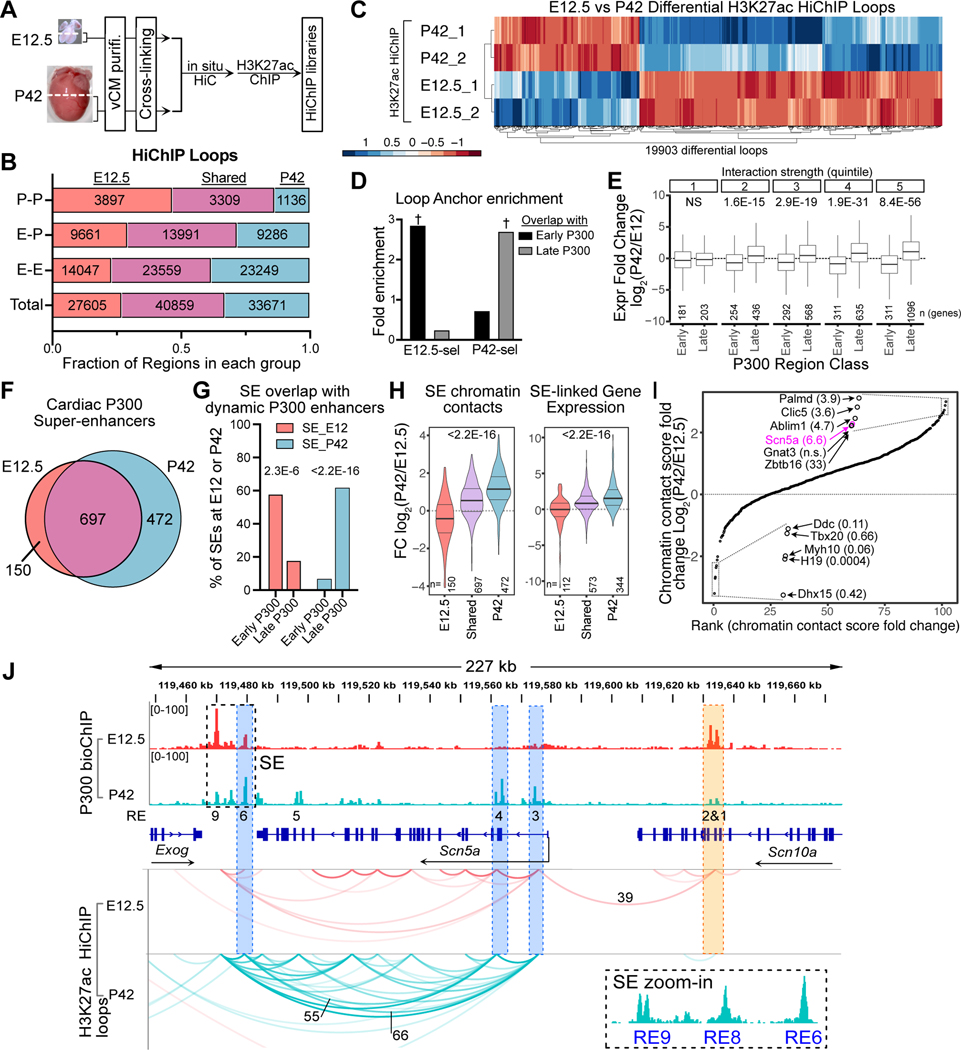
Cardiomyocyte differentiation continues throughout murine gestation and into the postnatal period, driven by temporally regulated expression changes in the transcriptome. The mechanisms that regulate these developmental changes remain incompletely defined. Here, we used cardiomyocyte-specific ChIP-seq of the activate enhancer marker P300 to identify 54,920 cardiomyocyte enhancers at seven stages of murine heart development. These data were matched to cardiomyocyte gene expression profiles at the same stages and to Hi-C and H3K27ac HiChIP chromatin conformation data at fetal, neonatal, and adult stages. Regions with dynamic P300 occupancy exhibited developmentally regulated enhancer activity, as measured by massively parallel reporter assays in cardiomyocytes in vivo, and identified key transcription factor-binding motifs. These dynamic enhancers interacted with temporal changes of the 3D genome architecture to specify developmentally regulated cardiomyocyte gene expressions. Our work provides a 3D genome-mediated enhancer activity landscape of murine cardiomyocyte development.

Keywords: Hi-C; HiChIP; cardiomyocyte maturation; enhancer; massively parallel reporter assay; nuclear receptor.


Conflict of interest statement

Declaration of interests The authors declare no competing interests.

Figures

Figure. 1.
Figure. 1.. Identification of CM P300 enhancers. See related Figure S1.
A. Cre-dependent expression of BirA enabled CM-selective biotinylation of P300. The BIO tag was knocked into the C-terminus of P300. B. P300 biotinylation was triggered by CM Cre expression. Input: heart extracts. SA, streptavidin. C. P300 data acquisition. D. Spearman correlation of P300 signal across the union of P300 regions. E. Representative images of hearts used in this study, shown at the same scale. Ventricular tissue (below the dashed lines) was used. F. P300 bioChIP-seq signal at Bmp10, Ppargc1a, and Myh6/Myh7. G. CM p300 bioChIP-seq test characteristics based on the Vista Enhancer Database. CM, E12.5 and E16.5 ventricular CMs. Heart, E12.5 ventricular tissue. FB, E12.5 forebrain. H. Heart TF bioChIP-seq signals at CM p300 regions. Average of biological duplicates.
Figure 2.
Figure 2.. Characterization of P300 dynamic enhancers during heart development. See related Figure S1.
A. Flowchart for identification of dynamic distal P300 regions. B. P300 signal in Early, Static, and Late regions. C. Top 5 GO terms enriched among Early, Static, and Late P300 regions. D. Enriched TF motifs in P300-bound regions. OR, odds ratio. NR, nuclear receptor. E. Cardiac transcription factor (TF) bioChIP-seq signal at P300 peaks. Average of biological duplicates. F. THRA ChIP-seq signal in P15 hearts (Hirose et al., 2019) centered at P300 peaks. G. Phastcons scores at Early, Static, and Late P300 regions.
Figure. 3.
Figure. 3.. Enhancer activity of dynamic P300 regions during in vivo CM development. See related Figure S2.
A. AAV vector for testing cardiac enhancer activity. B. Timeline for MPRA experiments. C. Representative images of enhancer activity of three Early P300 regions flanking Bmp10 (see Fig. 1F). Bar = 1 mm. D-E. Quantification of individual enhancer activity. Activity of −5k, +14k and +20k Bmp10 enhancers was normalized to vector lacking enhancer. t-test: **, P<0.01. F. Design of MPRA to measure Early P300 and Late P300 region activity. Synthesized 400 bp regionswere cloned into the 3’ UTR of a basal promoter-mCherry AAV reporter. G. MPRA results. Lower line plot indicates the annotation assigned to each region. H. MPRA activity of Early P300 and Late P300 regions at P0, P7, and P28. Early P300 group, 685 regions; Late P300 group, 1231 regions. n=12 biological replicates at P0; n=28 at P7 and P28. Steel-Dwass. ns, not significant. I. Activity of three selected Late P300 regions with increasing MPRA activity. Left, P300 bioChIP-signal. Middle, representative images. Right, quantification. t-test: **, P<0.01. Bar = 1 mm. J-K. Motifs enriched in regions with selective neonatal or adult MPRA activity. Non-redundant motifs with significant enrichment (Neg. log10 Pval > 10) are shown.
Fig. 4.
Fig. 4.. The nuclear receptor motif is essential for activation of Late P300 regions. See related Figure S3.
A. Cardiac enhancer activity of NR motif-containing Late P300 regions was measured with or without NR motif mutation. B. Representative mCherry reporter images and enhancer activity quantification. Bar = 1 mm. t-test: **, P<0.01. C. MPRA to probe the requirement for nuclear receptor (NR) motifs. NR motif-containing P300 regions were synthesized as wild-type and mutant pairs and inserted into the AAV-MPRA vector. D. MPRA result measured at P7. RNA/DNA ratio was normalized to the mean value of the negative control group. Activity threshold was set at the negative control 95th percentile. Line plot indicates the annotation assigned to each region. E. Effect of NR mutation on 337 WT:Mut pairs with detectable MPRA activity at P7. Paired t-test. Marker size indicates thyroid hormone receptor (THRA) ChIP-seq signal in P15 heart (GSE125414). n=14 biological replicates. F-H. Activity of Late P300 region near Mhrt promoter requires thyroid response element (TRE). F, THRA- and P300-bound TRE within the Myh6/Myh7 locus. G, P300 enhancer activity, from Fig. 3 MPRA. n=12. G'; Enhancer inhibition by TRE mutation, from panel D MPRA. n=14. H, Myh7 silencing, measured by YFP FACS in P28 Myh7YFP CMs with or without somatic mutagenesis of endogenous TRE.
Figure 5.
Figure 5.. Correlation of dynamic P300 binding to chromatin conformation. see also Related Figures S4 and S5.
A. CM samples used to generate HiC data. Scale bar: 1 mm. B. Representative Hi-C contact map and the corresponding P300 bioChIP-seq tracks. C. Interaction score of loops between Early (n=104) or Late (n=141) P300 Regions and TSS. Wilcoxon ranked sum test. D. Percentage of genome in compartments that were stable (90.2%), A→B (4.3%), or B→A (5.5%), between E12.5 and P42. E. Distribution of P300 regions in stable and switching compartments. F. Representative region (dashed box, enlarged in tracks below) that underwent B→A switch and the corresponding CM P300 bioChIP-seq tracks. G. Total number of TAD splits or mergers between E12.5, P0, and P42. H. Representative example of a TAD split and P300 bioChIP signal in daughter TADs. I. P300 signal between daughters of split TADs at E12.5 (pre-split) and P42 (post-split). n=314.
Figure. 6.
Figure. 6.. Interaction between developmental changes in P300 occupancy and 3D chromatin structure modulate CM gene expression. Related to Figure S6.
A. Differentially expressed genes (DEGs; Padj<0.01 and absolute Log2FC ≥ 3) in CMs from E12.5 to P42. Hierarchical clustering. B. Gene ontology terms enriched among Fetal and Adult DEGs. C. Expression of genes in chromatin that underwent A and B switches between E12.5 and P42. D. Expression of genes in left and right sides of split TADs at E12.5, P0, and P42. Wilcoxon ranked sum test. n=314. E. Representative example of TAD splitting and gene expression changes. F. ABC scores of Fetal (n=235) and Adult (n=265) DEGs with EP loops at E12.5 and P42. Wilcoxon ranked sum test. G. Correlation between developmental change in gene expression and change in ABC scores. Gene expression values from E12.5 and P42. Contact scores were from (i) Hi-C data, (ii) genome-wide distance-contact score relationships at E12.5 and P42 (see panel H), (iii) stage swapped distance-contact score relationships, and (iv) stage-swapped Hi-C data. H. Cumulative distribution function of the genome-wide average frequency of contacts between a region and the TSS as a function of their genomic distance. Kolmogorov–Smirnov (KS) test.
Fig. 7.
Fig. 7.. Interaction between developmental changes in P300 occupancy, 3D chromatin structure, and gene expression. Related to Figure S7.
A. H3K27ac Hi-ChIP workflow. vCMs, purified ventricular CMs B. H3K27ac Hi-ChIP loops called at E12.5 and P42. E-E, enhancer-enhancer; E-P, enhancer-promoter; P-P, promoter-promoter. C. Differential loops (Padj<0.05 and absolute Log2FC>2) between E12.5 and P42. D. Enrichment of P300 Early or Late enhancers at E12.5- or P42-selective loop anchors, compared to all other loops. †, Fisher P<2.2E-16. E. Developmental change in expression of genes linked to Early or Late P300 enhancers by E-P loops, categorized by quintile of HiChIP loop strength at E12.5 (Early P300) or P42 (Late P300). Wilcoxon ranked sum test with Holm's multiple testing correction. F. CM super-enhancers (SEs) identified at E12.5 and P42 by P300 bioChIP-seq signal. G. Enrichment of Early or Late P300 regions in E12.5 or P42 SEs. Proportions test. H. Ratio of SE chromatin contacts (left) or expression of genes (right) linked to SEs by HiChIP loops at E12.5 and P42. Kruskal-Wallis test. I. Variation in chromatin contact scores at E12.5 vs. P42 for SEs shared between E12.5 and P42. Boxed regions are magnified and labeled with SE-associated genes and their expression fold-change (P42/E12.5). Scn5a (magenta) is shown in panel J. J. SE at the Scn5a locus. Average loop scores for selected loops are labeled. Loops with scores <15 are omitted for clarity.

References

    1. Schoenfelder S, and Fraser P. (2019). Long-range enhancer–promoter contacts in gene expression control. Nat. Rev. Genet. 20, 437–455. - PubMed
    1. Stadhouders R, Filion GJ, and Graf T. (2019). Transcription factors and 3D genome conformation in cell-fate decisions. Nature 569, 345–354. - PubMed
    1. Glaser J, and Mundlos S. (2021). 3D or Not 3D: Shaping the Genome during Development. Cold Spring Harb. Perspect. Biol. 10.1101/cshperspect.a040188. - DOI - PMC - PubMed
    1. Zheng H, and Xie W. (2019). The role of 3D genome organization in development and cell differentiation. Nat. Rev. Mol. Cell Biol. 20, 535–550. - PubMed
    1. Guo Y, and Pu WT (2020). Cardiomyocyte Maturation: New Phase in Development. Circ. Res. 126, 1086–1106. - PMC - PubMed

Publication types