. 2023 Apr;13(4):220308.
doi: 10.1098/rsob.220308. Epub 2023 Apr 19.

High-resolution analysis of individual Drosophila melanogaster larvae uncovers individual variability in locomotion and its neurogenetic modulation

Affiliations

High-resolution analysis of individual Drosophila melanogaster larvae uncovers individual variability in locomotion and its neurogenetic modulation

Michael Thane et al. Open Biol. 2023 Apr.

Abstract

Neuronally orchestrated muscular movement and locomotion are defining faculties of multicellular animals. Due to its simple brain and genetic accessibility, the larva of the fruit fly Drosophila melanogaster allows one to study these processes at tractable levels of complexity. However, although the faculty of locomotion clearly pertains to the individual, most studies of locomotion in larvae use measurements aggregated across animals, or animals tested one by one, an extravagance for larger-scale analyses. This prevents grasping the inter- and intra-individual variability in locomotion and its neurogenetic determinants. Here, we present the IMBA (individual maggot behaviour analyser) for analysing the behaviour of individual larvae within groups, reliably resolving individual identity across collisions. We use the IMBA to systematically describe the inter- and intra-individual variability in locomotion of wild-type animals, and how the variability is reduced by associative learning. We then report a novel locomotion phenotype of an adhesion GPCR mutant. We further investigated the modulation of locomotion across repeated activations of dopamine neurons in individual animals, and the transient backward locomotion induced by brief optogenetic activation of the brain-descending 'mooncrawler' neurons. In summary, the IMBA is an easy-to-use toolbox allowing an unprecedentedly rich view of the behaviour and its variability of individual larvae, with utility in multiple biomedical research contexts.

Keywords: Latrophilin; dopamine; learning; locomotion; tracking; variability.


Conflict of interest statement

The authors declare no competing interests.

Figures

Figure 1.
Figure 1.
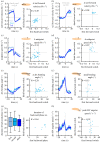
Principles of the analysis. (a) The track of the midpoint of a sample larva. Green and red dots indicate left and right HCs, respectively. The arrow head indicates the end of the track. (b) (left) 12 equidistant spine points are determined along the spine of each larva, including the back and front ‘tip’ (spine points 1 and 12, respectively). The second spine point from the front (i.e. number 11) is taken as indicative of the head, the second point from the rear as indicative of the tail (i.e. number 2). (right) A head vector (HV) is determined from spine points 9–11, and a tail vector (TV) from spine points 2–6. (c) The angular speed of the head vector of the sample larva displayed in (a). Negative values indicate movement to the left, positive values movement to the right. A HC is detected when the HV angular speed exceeds a threshold of ±35° s−1 (stippled lines). In this and the following figures, left and right HCs are indicated by green and red shadings, respectively. (d) The forward velocity of the tail, in body lengths per second (bl s−1), of the sample larva displayed in (a). During runs, the velocity oscillates regularly. Each oscillation marks one cycle of peristaltic forward movement. Therefore, we define each peak of the tail forward velocity during runs as one ‘step’, indicated by grey lines in this and analogous figures. During HCs, the regular forward movement is stopped. Therefore, 1.5 s before and after each HC, no steps are detected.
Figure 2.
Figure 2.
Variability of basic locomotor attributes of individual Drosophila larvae. Six basic locomotor attributes were determined: (a) the inter-step (IS) speed (i.e. the average speed of each larva's midpoint during runs), (b) the IS distance (i.e. the average distance travelled within one peristaltic cycle for each larva), (c) the IS interval (i.e. the average time required for one peristaltic cycle for each larva), (d) the absolute bending angle (i.e. how much each larva was bent throughout the observation period), (e) the HC rate (i.e. the number of HCs per second of each larva) and (f) the absolute HC angle, measuring the average size of each larva's HCs. Displayed are histograms of each behavioural attribute per individual, together with the coefficient of variation (CV), which indicates the standard deviation of the attribute, divided by its mean, across all individuals. (g) Three sample tracks of individuals showing different patterns of behaviour: (top) a stretch of relatively straight-forward locomotion, followed by a series of rather large HCs and turns, (middle) a stretch of curved forward locomotion, flanked by HCs, (bottom) continuous, small HCs. (h) Absolute HC angles of the top sample individual from (g) range from close to zero up to 60°. (i) The CV of each attribute within each individual animal (box plot), and across animals (blue diamonds). The median is displayed as the middle line, the 25% and 75% quantiles as boxes and the 10% and 90% quantiles as whiskers. The underlying source data can be accessed in electronic supplementary material, source data file S1. ‘bl’, individual body lengths; ‘bl s−1’, body lengths per second.
Figure 3.
Figure 3.
Basic locomotor attributes differ in how consistent they are over time. We determined each behavioural attribute for each individual independently for the first and the third minute of the video. We uncovered differences across behavioural attributes: we found moderate to strong correlations for (a) the IS speed, (b) the IS distance and (c) the IS interval, but only very weak, yet significant correlations for (d) the absolute bending angle, (e) the HC rate and (f) the absolute HC angle. Correlations are determined by SC tests. The underlying source data, as well as the results of the statistical tests, can be accessed in electronic supplementary material, source data file S1. bl, individual body lengths; bl s−1, body lengths per second.
Figure 4.
Figure 4.
Previous associative training decreases activity and the variability of locomotion. (a) We compared the basic locomotor attributes of animals tested for their odour preference either naively (innate), or after paired or unpaired training with odour and a sugar reward. (b) After paired training, the animals were attracted the most, after unpaired training they were attracted least to the odour. Compared to trained larvae, naive larvae displayed (c) a higher IS speed, (d) a higher intra-individual variability (as indicated by the coefficient of variation (CV)) of the IS speed, (e) a higher IS distance, (f), a higher CV IS distance, (g) an unchanged IS interval, (h) and a higher CV IS interval. (i) The absolute bending angle was highest in naive animals and lowest after paired training. Compared to trained larvae, naive larvae showed (j) an unchanged CV absolute bending angle, (k) a higher HC rate, (l) an unchanged absolute HC angle and (m) a higher CV absolute HC angle. The median is displayed as the middle line, the 25% and 75% quantiles as boxes and the 10% and 90% quantiles as whiskers. Asterisks indicate significant differences in MW tests. The underlying source data, as well as the results of the statistical tests, can be accessed in electronic supplementary material, source data file S1. bl, individual body lengths; bl s−1, body lengths per second.
Figure 5.
Figure 5.
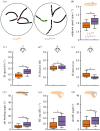
Genetic removal of Cirl reduces speed, bending and head-casting behaviour. We analysed basic locomotor properties of the CirlKO mutant and a CirlRescue control. (a) Representative sample tracks of five individual mutant and five control larvae. Green and red dots indicate left and right HCs, respectively. (b) The mutants displayed a strongly reduced midpoint speed compared to the control animals, confirming earlier results. (c) Also limited to run phases, the speed of mutants was reduced. (d) The IS distance was decreased and (e) the IS interval increased. (f) In addition, the mutants were on average bending less than the control animals, which manifested itself as a decreased (g) HC rate and (h) absolute HC angle. The median is displayed as the middle line, the 25% and 75% quantiles as boxes and the 10% and 90% quantiles as whiskers. Asterisks indicate significant differences in MW tests. The underlying source data, as well as the results of the statistical tests, can be accessed in electronic supplementary material, source data file S1. bl, individual body lengths; bl s−1, body lengths per second.
Figure 6.
Figure 6.
Discriminating CirlKO mutant and control animals by means of a random forest. We applied the random forest approach to discriminate CirlKO mutant animals from control animals. (a) Using a set of 30 behavioural attributes, the random forest was able to discriminate the two genotypes with an accuracy of 0.91. Displayed is the confusion matrix showing predicted versus actual affiliations of individual larvae to the two genotypes. The accuracy is calculated as the average of the two correct assignment rates (0.88 and 0.94). (b) The top ten most important behavioural attributes for discriminating the two genotypes with the random forest, sorted by the average importance rank across 10 repetitions of the random forest approach. (c–f) Four additional behavioural attributes found by the random forest were (c) the distance travelled by the larvae, (d) the angular speed of the head vector (HV), (e) the angular speed of the tail vector (TV), as well as (f) the coefficient of variation (CV) of the velocity of the tail in a forward direction. Displayed are the mean and the 95% confidence interval in (b), and the median as the middle line, the 25% and 75% quantiles as boxes and the 10% and 90% quantiles as whiskers in (c–f). Asterisks indicate significant differences in MW tests. The underlying source data, as well as the results of the statistical tests, can be accessed in electronic supplementary material, source data file S1. bl, individual body lengths.
Figure 7.
Figure 7.
CirlKO mutant larvae display an altered rhythmic peristaltic cycle. (a) The forward velocity of the tail in each one sample CirlRescue (top) and CirlKO larva (bottom). Periods of normal stepping are indicated by a coloured stripe on top of the curve, periods of stumble stepping by a hatched stripe. (b) Distribution of the IS interval between the normal and stumble stepping cycles for each genotype. (c) CirlKO individuals have a much lower ratio of normal stepping cycles (and thus a higher ratio of stumble stepping) than CirlRescue individuals. (d–i) Within-animal comparison of various behavioural attributes of mutant animals during normal or stumble stepping, and between-animal comparison between mutant and control animals during normal stepping. Periods of stumble stepping in control animals were omitted due to their low number. (d) IS speed, (e) IS distance, (f) IS interval, (g) absolute bending angle, (h) absolute head vector (HV) angular speed, (i) absolute tail vector (TV) angular speed. Displayed are the median as the middle line, the 25% and 75% quantiles as boxes and the 10% and 90% quantiles as whiskers. Asterisks indicate significant MW tests, hash symbols significant WS tests. The underlying source data, as well as the results of the statistical tests, can be accessed in electronic supplementary material, source data file S1. bl, individual body lengths; bl s−1, body lengths per second.
Figure 8.
Figure 8.
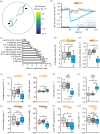
Optogenetic activation of dopamine neurons triggers stopping and bending. Larvae of the experimental genotype (TH > ChR2-XXL), the driver control (TH/+) and the effector control (+/ChR2-XXL) were recorded during free locomotion for 30 s in darkness, followed by 30 s of light stimulation and 60 s of darkness. (a) Sample tracks of three individuals, colour-coded according to the absolute bending angle. Phases of stopping and increased bending are indicated by brighter colour (arrows). (b) The absolute bending angle over time. Black and blue stripes on the x-axis indicate periods of darkness and blue light stimulation, respectively. (c) 30 behavioural attributes during light stimulation were normalized to each individual's behaviour before light activation (called Δ-values). Shown are the top ten most important Δ-values for discriminating the three genotypes by means of random forest, sorted by the average importance rank across 10 repetitions. The top ten Δ-values provided by random forest were (d) the distance each larva travelled, (e) the velocity of the tail in a forward direction, (f) the speed of the midpoint, as well as (g) its coefficient of variation (CV), (h) the bending angle, (i) the absolute bending angle, as well as (j) its CV, (k) the absolute angular speed of the head vector (HV), (l) the absolute angular speed of the tail vector (TV), as well as (m) its CV. Displayed are the mean and the 95% confidence interval in (b,c), and the median as the middle line, the 25% and 75% quantiles as boxes and the 10% and 90% quantiles as whiskers in (dm). Asterisks indicate significant differences in MW tests. The underlying source data, as well as the results of the statistical tests, can be accessed in electronic supplementary material, source data file S1. bl, individual body lengths; bl s−1, body lengths per second.
Figure 9.
Figure 9.
Individuals reduce speed consistently upon repeated optogenetic activation of dopamine neurons. Larvae of the experimental genotype (TH > ChR2-XXL) were recorded during free locomotion for 30 s in darkness, followed by three cycles of 10 s of light stimulation and 60 s of darkness. (a) The tail forward velocity over time. Black and blue stripes on the x-axis indicate periods of darkness and blue light stimulation, respectively. (b) The tail forward velocity during light stimulation was normalized to each individual's behaviour in the 10 s before light activation (called Δ-values). The Δ-velocities of the first and third activation were positively correlated. (c,d) As in (a,b), but for the midpoint speed. (e,f) As in (a,b), but for the absolute bending angle. (g,h) As in (a,b), but for the HV absolute angular speed. Displayed are the mean and the 95% confidence interval in (a,c,e,g), and the individual Δ-values in (b,d,f,h). Correlations were determined by SC tests. The underlying source data, as well as the results of the statistical tests, can be accessed in electronic supplementary material, source data file S1. bl, individual body lengths; bl s−1, body lengths per second.
Figure 10.
Figure 10.
Optogenetic activation of ‘mooncrawler’ neurons triggers backward crawling. Larvae of the experimental genotype (R53F07 > ChR2-XXL), the driver control (R53F07/+) and the effector control (+/ChR2-XXL) were recorded during free locomotion for 30 s in darkness, followed by 30 s of light stimulation and 60 s of darkness. (a) Sample tracks of two larvae, colour-coded according to their tail forward velocity. Phases of backward locomotion are indicated by darker colour (arrows). (b) The tail forward velocity over time. Black and blue stripes on the x-axis indicate periods of darkness and blue light stimulation, respectively. (c) 30 behavioural attributes during light stimulation were normalized to the individual's behaviour before light activation (called Δ-values). Shown are the top ten most important Δ-values. The top ten Δ-values were (d) the distance each larva travelled, (e) the velocity of the tail in a forward direction, (f) the speed of the midpoint, as well as (g) its coefficient of variation (CV), (h) the IS speed, (i) the IS interval, (j) the absolute bending angle, as well as (k) its CV, (l) the absolute angular speed of the head vector (HV) and (m) the HC rate. Displayed are the mean and the 95% confidence interval in (b,c), and the median as the middle line, the 25% and 75% quantiles as boxes and the 10% and 90% quantiles as whiskers in (dm). Asterisks indicate significant differences in MW tests. The underlying source data, as well as the results of the statistical tests, can be accessed in electronic supplementary material, source data file S1. bl, individual body lengths; bl s−1, body lengths per second.
Figure 11.
Figure 11.
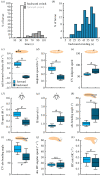
Backward locomotion is characterized by reduced yet more variable speed, and increased yet less variable bending. (a) Distribution of the switching points to backward crawling (white) and forward crawling (grey). n = 97, 64. (b) Distribution of backward crawling durations, only taking those animals into account that perform both switches, i.e. that start to crawl backward and revert to forward crawling later (n = 58). (c–k) Within-animal comparison of the backward crawling phase (i.e. between the switching points) and the forward crawling phases, regarding (c) the tail forward velocity, (d) the midpoint speed, (e) its coefficient of variation (CV), (f) the IS speed, (g) the IS interval, (h) the absolute bending angle, (i) its CV, (j) the HV absolute angular speed, and (k) the HC rate. Displayed are the median as the middle line, the 25% and 75% quantiles as boxes and the 10% and 90% quantiles as whiskers. Hash symbols indicate significant differences in WS tests. The underlying source data, as well as the results of the statistical tests, can be accessed in electronic supplementary material, source data file S1. bl, individual body lengths; bl s−1, body lengths per second.
Figure 12.
Figure 12.
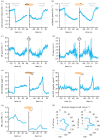
Switching between forward and backward locomotion (and vice versa) is characterized by changes in speed and peaks in bending and head casting. (a–g) The tracks of animals from the experimental genotype (R53F07 > ChR2-XXL) were aligned either to the switch from forward to backward crawling (left, ‘backward switch’), or to the switch from backward to forward crawling (right, ‘forward switch’). Only animals that performed the respective switch were considered (n = 97, 64). (a) Tail forward velocity, (b) midpoint speed, (c) IS speed, (d) IS interval, (e) absolute bending angle, (f) absolute head vector (HV) angular speed, (g) HC rate. Displayed are the mean and 95% confidence intervals of all data within each 2 s bin, except for the HC rate which was calculated within each 2 s bin by dividing all frames with a HC by all frames in the bin. (h) The orientation of the animal's body, indicated by the tail vector, was compared in the 10 s before and after a switch. Displayed is the percentage of animals that changed their orientation by the respective absolute angle, in brackets of 20°. The underlying source data can be accessed in electronic supplementary material, source data file S1. bl, individual body lengths; bl s−1, body lengths per second.
Figure 13.
Figure 13.
Individuals change speed consistently upon repeated backward, but not forward switches. Larvae of the experimental genotype (R53F07 > ChR2-XXL) were recorded during free locomotion for 30 s in darkness, followed by three cycles of 10 s of light stimulation and 60 s of darkness. Individual data were aligned either to the switch from forward to backward crawling (a,c,e), or to the switch from backward to forward crawling (b,d,f,h). (a) (left) The tail forward velocity over time, aligned to the first, second and third backward switch. (right) The tail forward velocity during the 10 s after the switch was normalized to each individual's behaviour in the 10 s before the switch (called Δ-values). The Δ-velocity of the first and third activation was positively correlated. (b) As in (a), but for the forward switches. (c,d) As in (a,b), but for the midpoint speed. (e) As in (a), but for the absolute bending angle. (f) To quantify the peak of the absolute bending angle at forward switches, we normalized the behaviour in the 10 s around the switch with the 5 s before and the 5 s after (called peak values). (g) (left) The duration of the backward crawling phases following the first, second and third neuronal activation. (right) The durations of the first and third backward phases were positively correlated, despite statistically non-significant due to the low number of larvae that completed all backward and forward switches. (h) As in (f), but for the HV absolute angular speed. As no particular change in the angular speed is seen upon backward switches, we quantify only the forward switches. Displayed are the mean and the 95% confidence interval in (a,c,e), and the individual Δ-values, or peak values, in (b,d,f,h). Correlations were determined by SC tests. The underlying source data, as well as the results of the statistical tests, can be accessed in electronic supplementary material, source data file S1. bl, individual body lengths; bl s−1, body lengths per second.
Figure 14.
Figure 14.
Overview of the tracking process. The IMBAtracker works through a sequence of three phases. (a) In the first phase, the image is processed; for example, by background subtraction, objects (blobs) are detected by thresholding, and initial assignments of individual larvae are made (before collision resolution). (b) In the second phase, the head and tail of each larva is determined, and a contour-based model of colliding larvae is applied to undertake a first round of collision resolution. (c) For collisions that could not be resolved in the second phase, the third phase adds a statistical collision resolution approach that compares attributes such as the size of the larvae to match individuals before and after the collision.

Similar articles

Cited by

References

    1. Goncalves AI, Zavatone-Veth JA, Carey MR, Clark DA. 2022. Parallel locomotor control strategies in mice and flies. Curr. Opin. Neurobiol. 73, 102516. (10.1016/j.conb.2022.01.001) - DOI - PubMed
    1. Sethi D, Bharti S, Prakash C. 2022. A comprehensive survey on gait analysis: history, parameters, approaches, pose estimation, and future work. Artif. Intell. Med. 129, 102314. (10.1016/j.artmed.2022.102314) - DOI - PubMed
    1. Manoonpong P, et al. 2021. Insect-inspired robots: bridging biological and artificial systems. Sensors 21, 7609. (10.3390/s21227609) - DOI - PMC - PubMed
    1. Hunter I, Coulson B, Zarin AA, Baines RA. 2021. The Drosophila larval locomotor circuit provides a model to understand neural circuit development and function. Front. Neural Circuits 15, 62. (10.3389/fncir.2021.684969) - DOI - PMC - PubMed
    1. Caldwell JC, Miller MM, Wing S, Soll DR, Eberl DF. 2003. Dynamic analysis of larval locomotion in Drosophila chordotonal organ mutants. Proc. Natl Acad. Sci. USA 100, 16 053-16 058. (10.1073/pnas.2535546100) - DOI - PMC - PubMed

Publication types

LinkOut - more resources