. 2023 Apr 26;290(1997):20221793.
doi: 10.1098/rspb.2022.1793. Epub 2023 Apr 19.

Morphology and niche evolution influence hummingbird speciation rates

Affiliations

Morphology and niche evolution influence hummingbird speciation rates

Elisa Barreto et al. Proc Biol Sci. .

Abstract

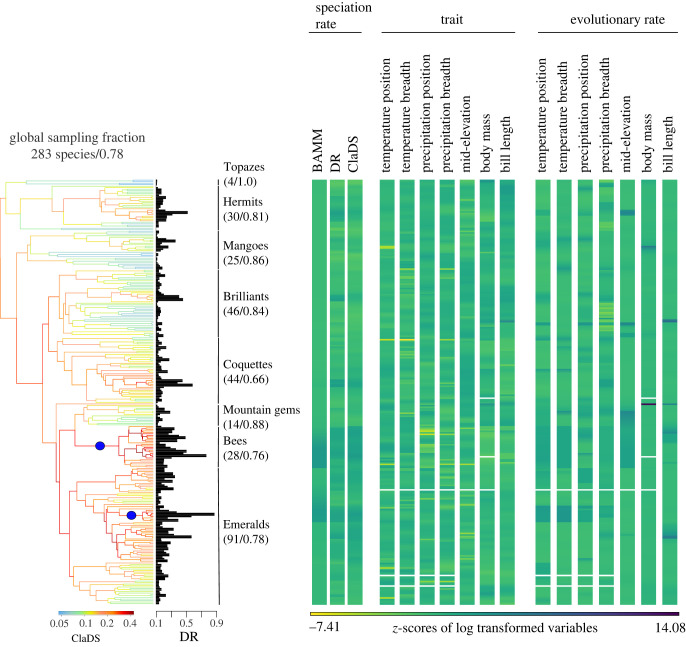
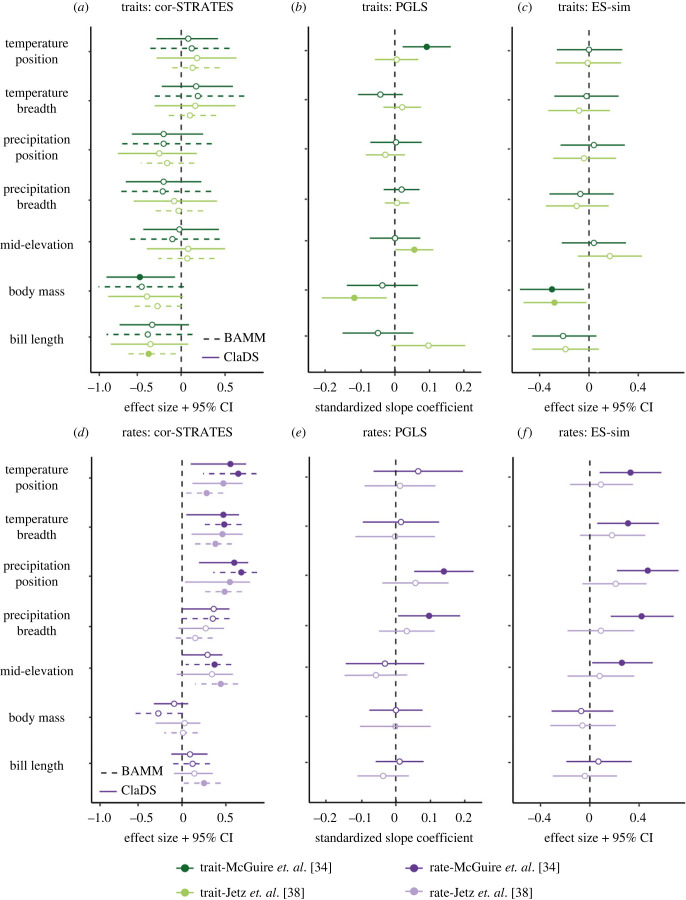
How traits affect speciation is a long-standing question in evolution. We investigate whether speciation rates are affected by the traits themselves or by the rates of their evolution, in hummingbirds, a clade with great variation in speciation rates, morphology and ecological niches. Further, we test two opposing hypotheses, postulating that speciation rates are promoted by trait conservatism or, alternatively, by trait divergence. To address these questions, we analyse morphological (body mass and bill length) and niche traits (temperature and precipitation position and breadth, and mid-elevation), using a variety of methods to estimate speciation rates and correlate them with traits and their evolutionary rates. When it comes to the traits, we find faster speciation in smaller hummingbirds with shorter bills, living at higher elevations and experiencing greater temperature ranges. As for the trait evolutionary rates, we find that speciation increases with rates of divergence in the niche traits, but not in the morphological traits. Together, these results reveal the interplay of mechanisms through which different traits and their evolutionary rates (conservatism or divergence) influence the origination of hummingbird diversity.

Keywords: Trochilidae; diversification; dynamic traits; evolutionary divergence; niche conservatism.


Conflict of interest statement

We declare we have no competing interests.

Figures

Figure 1.
Figure 1.
Hummingbird phylogeny pruned from McGuire et al. [34] comprising 283 species and the associated data on speciation rates estimated by BAMM, DR and ClaDS, morphological and niche traits (climate and elevation) and the evolutionary rates of these traits estimated by BAMM (data available in electronic supplementary material, appendix S1). All variables on the right panel were log-transformed and standardized to mean 0 and standard deviation of 1 (z-score). Blanks indicate missing data. Hummingbird clades are indicated in the phylogeny with their corresponding sampling fraction in parentheses (absolute number and proportion of species included in the study). The phylogeny is coloured by speciation rates estimated by ClaDS, with the rate shifts estimated by BAMM indicated by blue dots. The bars in front of each tip of the phylogeny illustrate speciation rates calculated by the DR index. A similar figure for an alternative phylogenetic hypothesis [38] is in the electronic supplementary material, figure S5. The heatmap and the barplot were created using the phytools R package [39].
Figure 2.
Figure 2.
Estimated relationships between (a–c) traits and (d–f) their evolutionary rates with speciation rates of hummingbirds. Dots are effect sizes and lines are either 95% confidence intervals (a,c,d,f) or standard errors (for PGLS results, b and e). Filled dots indicate 95% confidence intervals that does not include zero. Relationships between speciation rates and trait values are indicated by shades of green (first row) and trait evolutionary rates by shades of purple (second row). These results were obtained using two alternative phylogenies (darker colours refer to results using the phylogeny [34] and lighter colours to [38]), three methods to estimate speciation rates (BAMM, ClaDS and DR), and three statistical approaches to correlate speciation rates to traits and/or rates (a,d: Cor-STRATES, b,e: PGLS, and c and f: ES-sim)—see the methods section for more details. Effect sizes from PGLS are often smaller than from other tests because it corresponds to standardized slope coefficients, whereas all other effect sizes correspond to correlation coefficients. The complete set of results is available in electronic supplementary material, tables S2–S4.

Similar articles

Cited by

References

    1. Simpson GG. 1953. The major features of evolution. New York, NY: Columbia University Press.
    1. Wiens JJ. 2017. What explains patterns of biodiversity across the Tree of Life? New research is revealing the causes of the dramatic variation in species numbers across branches of the Tree of Life. Bioessays 39, 1-10. (10.1002/bies.201600128) - DOI - PubMed
    1. Owens IPF, Bennett PM, Harvey PH. 1999. Species richness among birds: body size, life history, sexual selection or ecology? Proc. R. Soc. B 266, 933-939. (10.1098/rspb.1999.0726) - DOI
    1. Rolland J, Salamin N. 2016. Niche width impacts vertebrate diversification. Global Ecol. Biogeogr. 25, 1252-1263. (10.1111/geb.12482) - DOI
    1. Adams DC, Berns CM, Kozak KH, Wiens JJ. 2009. Are rates of species diversification correlated with rates of morphological evolution? Proc. R. Soc. B 276, 2729-2738. (10.1098/rspb.2009.0543) - DOI - PMC - PubMed

Publication types