. 2023 Apr 18;6(7):e202201837.
doi: 10.26508/lsa.202201837. Print 2023 Jul.

The pro-inflammatory response to influenza A virus infection is fueled by endothelial cells

Affiliations

The pro-inflammatory response to influenza A virus infection is fueled by endothelial cells

Lisa Bauer et al. Life Sci Alliance. .

Abstract

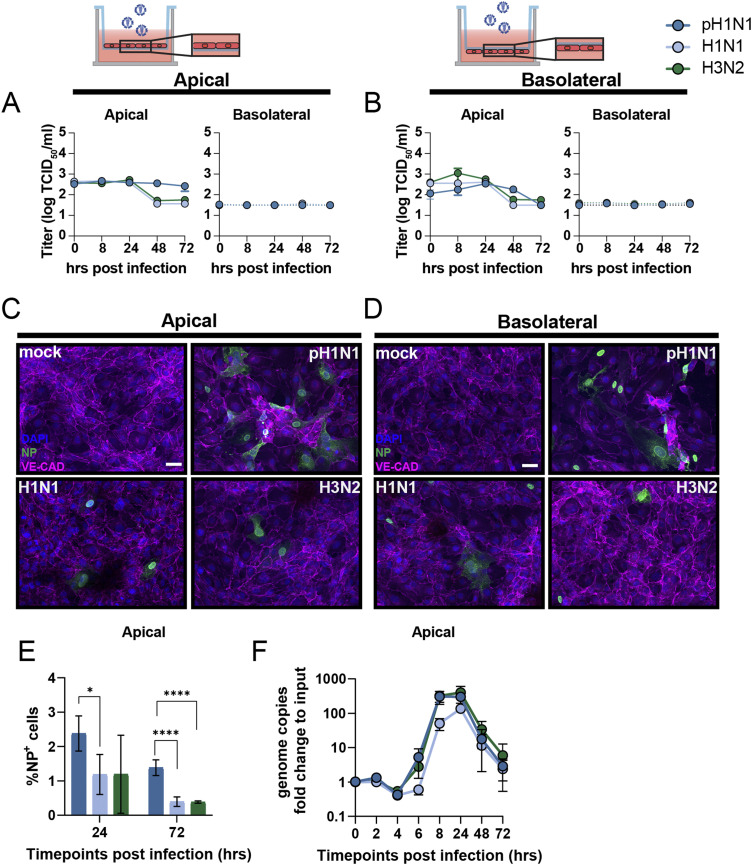
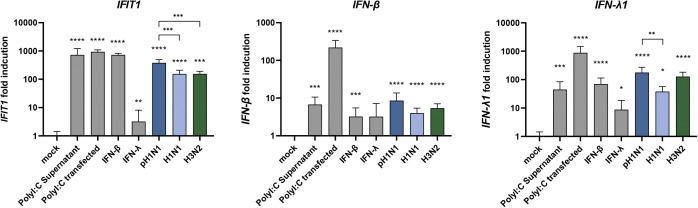
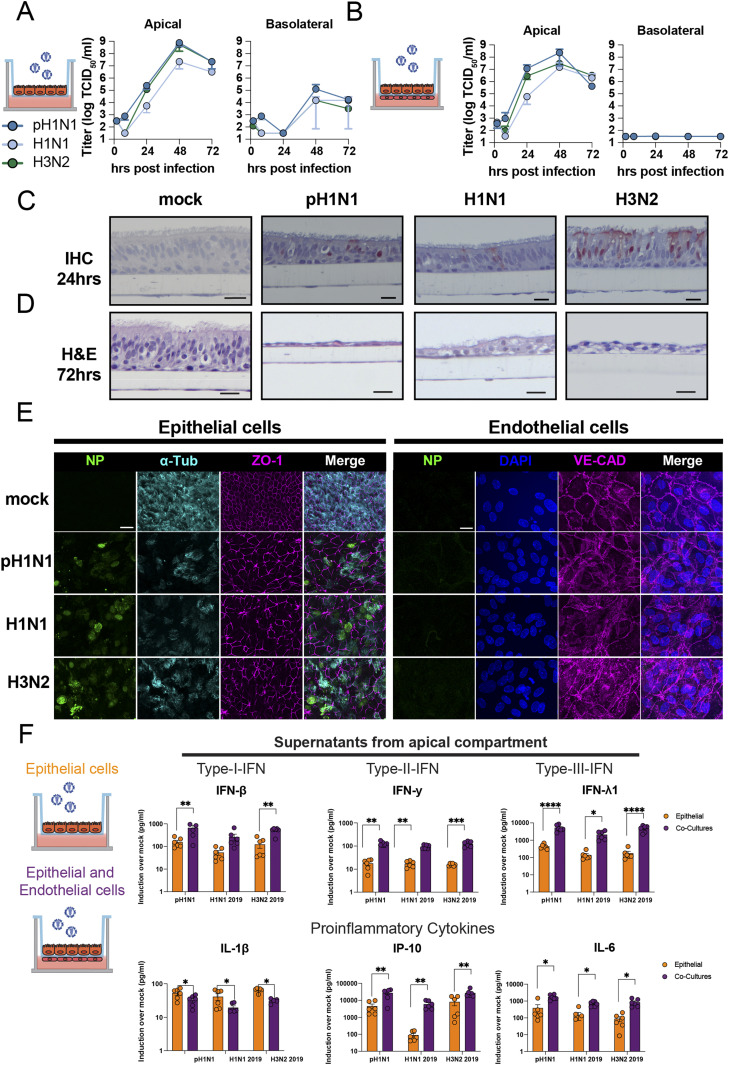
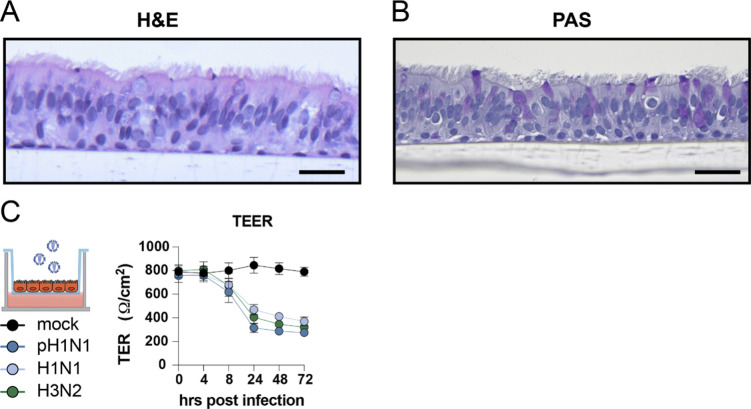
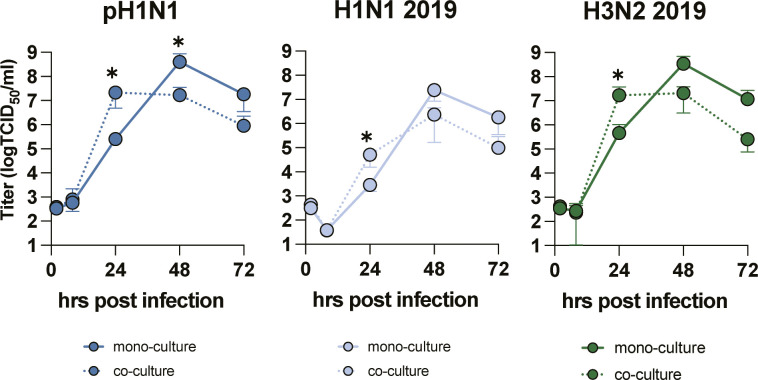
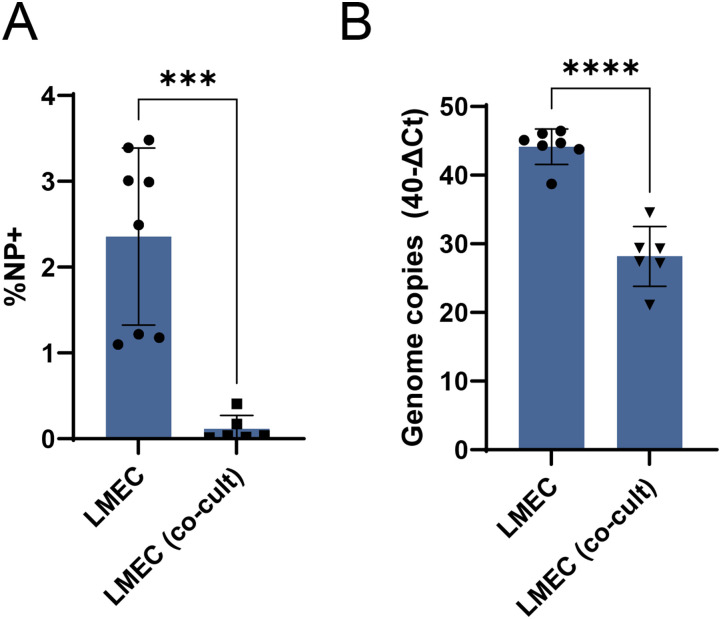
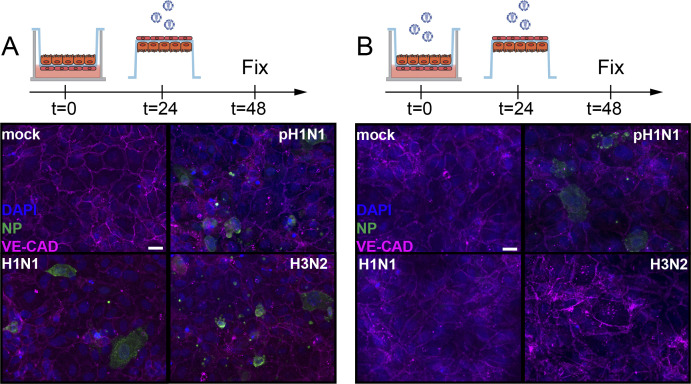
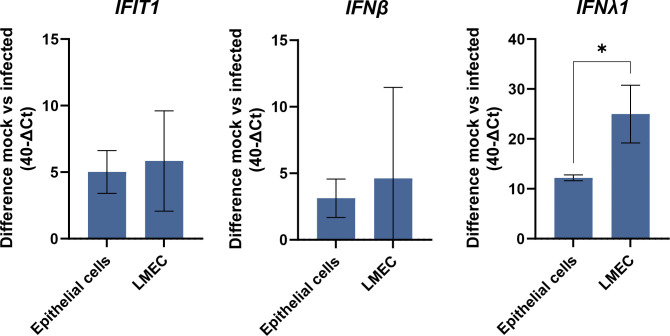
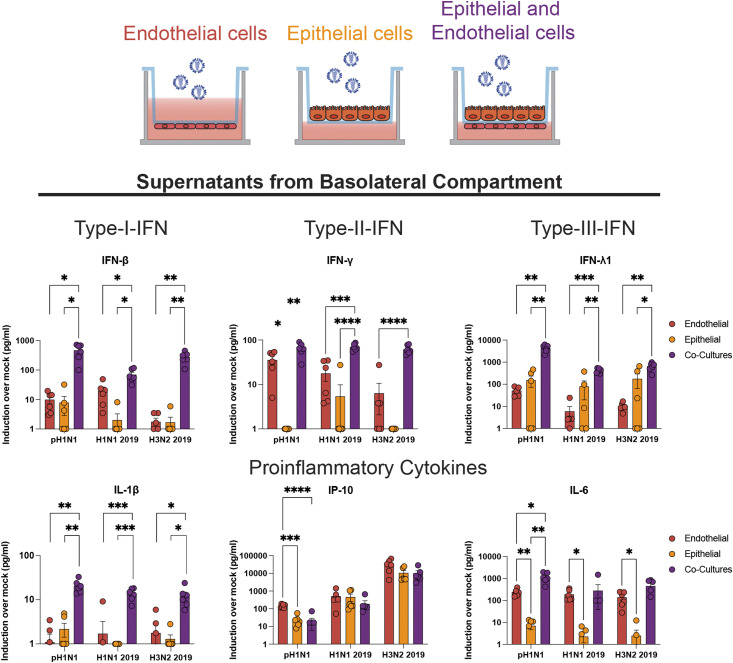
Morbidity and mortality from influenza are associated with high levels of systemic inflammation. Endothelial cells play a key role in systemic inflammatory responses during severe influenza A virus (IAV) infections, despite being rarely infected in humans. How endothelial cells contribute to systemic inflammatory responses is unclear. Here, we developed a transwell system in which airway organoid-derived differentiated human lung epithelial cells were co-cultured with primary human lung microvascular endothelial cells (LMECs). We compared the susceptibility of LMECs to pandemic H1N1 virus and recent seasonal H1N1 and H3N2 viruses and assessed the associated pro-inflammatory responses. Despite the detection of IAV nucleoprotein in LMEC mono-cultures, there was no evidence for productive infection. In epithelial-endothelial co-cultures, abundant IAV infection of epithelial cells resulted in the breakdown of the epithelial barrier, but infection of LMECs was rarely detected. We observed a significantly higher secretion of pro-inflammatory cytokines in LMECs when co-cultured with IAV-infected epithelial cells than LMEC mono-cultures exposed to IAV. Taken together, our data show that LMECs are abortively infected by IAV but can fuel the inflammatory response.


Conflict of interest statement

The authors declare that they have no conflict of interest.

Figures

Figure 1.
Figure 1.. Abortive infection of influenza A virus in lung microvascular endothelial cells (LMECs).
(A, B) To evaluate replication efficiency, LMECs were plated on the (A) apical or (B) basolateral side of a transwell filter. LMECs were inoculated with pH1N1, H1N1, or H3N2 virus at MOI 1, and at the indicated timepoints supernatants of the apical and basolateral sides were harvested, and virus titers were determined by endpoint titration. Infection efficiency was determined by immunofluorescence staining. (C, D) LMECs plated on the (C) apical and (D) basolateral sides were inoculated with pH1N1, H1N1, or H3N2 virus. Cells were fixed 24 h post-inoculation and stained for the endothelial cell marker vascular endothelial-cadherin (VE-CAD, magenta) and influenza A virus nucleoprotein (NP, green). Hoechst (blue) was used to visualize nuclei. (E) Percentage of infection determined by flow cytometry at 24 and 72 h post-inoculation. (F) Intracellular viral RNA genome copies were quantified by quantitative real-time PCR at indicated timepoints. Data represent mean ± SD from at least three independent experiments performed in biological duplicates, and flow cytometry was performed in biological triplicates. A one-way ANOVA multiple comparison test was used to compare groups (*< 0.05, **<0.01, ***<0.005). Scale bar: 20 μm.
Figure S1.
Figure S1.. Interferon and interferon-stimulated gene expression in lung microvascular endothelial cells.
To evaluate the immunocompetence of lung microvascular endothelial cells, the cells were exposed to recombinant IFN-β, IFN-λ, or the Toll-like receptor 3 agonist polyinosinic:polycytidylic acid (poly I:C) either in the supernatant or transfected. Alternatively, lung microvascular endothelial cells were inoculated with either pH1N1, H1N1, or H3N2. The gene expression of IFN-β, IFN-λ and interferon-stimulated gene IFIT1 was analyzed via qRT-PCR. Data represent mean ± SD from at least two independent experiments performed in biological triplicates. A t test was used to compare each group to mock and a one-way ANOVA was performed to compare pH1N1, H1N1, and H3N2 viruses (*<0.05, **<0.01, ***<0.005, ****<0.001).
Figure 2.
Figure 2.. Influenza A virus infection and cytokine profiling of the apical compartment of epithelial cell mono-cultures or in co-culture with endothelial cells.
(A, B) Well-differentiated airway organoids at air–liquid interface (AO at ALI) in mono-culture or (B) in co-culture with lung microvascular endothelial cells (LMECs) were inoculated with pH1N1, H1N1, or H3N2 virus at MOI 1. At the indicated timepoints, virus titers were determined in the supernatants of the apical and basolateral compartments. (C) Detection of influenza A virus (IAV) nucleoprotein (NP) by immunohistochemistry (IHC) of the AO at ALI-LMEC co-cultures 24 h post-inoculation. (D) Hematoxylin and eosin (H&E) staining of the co-cultures 72 h post-inoculation (scale bar 20 μm). (E) At 72 h post-inoculation, well-differentiated AO at ALI were stained for IAV NP (green), the cilia marker acetylated-α-tubulin (α-Tub, cyan) and the tight junction marker zona occludin-1 (ZO-1, magenta) on the apical compartment of the transwell. The basolateral compartment containing the LMECs was stained for IAV NP (green) and the endothelial cell marker vascular endothelial-cadherin (VE-CAD, magenta). In both cases, the nuclei were visualized with Hoechst (blue, scale bar: 20 μm). (F) Epithelial cells (AO at ALI) or endothelial–epithelial co-cultures were inoculated with pH1N1, H1N1, or H3N2 virus at MOI 1. At 24 h post-inoculation, cytokines were measured in the apical compartment, and protein concentrations were determined using the LEGENDplex assay. Data represented here show individual data points of cytokines derived from three independent experiments performed in biological duplicates, and the mean ± SD is depicted. Mock protein concentration of each condition was subtracted from the protein concentrations measured in the virus inoculated cultures. Statistical significance was determined with t test (*<0.05, **<0.01, ***<0.005, ****<0.001).
Figure S2.
Figure S2.. Influenza A virus replication in well-differentiated airways organoids at air–liquid interface.
(A, B) Airway organoids were differentiated on the apical side of a transwell at air–liquid interface and tissue architecture, including presence of ciliated cells, and goblet cells was confirmed with (A) H&E and a (B) PAS staining. (C) Determination of transepithelial electrical resistance (TEER) of influenza A virus (pH1N1, H1N1, and H3N2)–infected epithelial cultures at MOI 1 over time. Data are expressed relative to the TER value recorded before infection which was defined as 100%. Data represented here show pooled data of virus titers and TER values derived from three independent experiments performed in biological duplicates, and the mean ± SD is depicted. Scale bar: 20 μm.
Figure S3.
Figure S3.. Influenza A virus replication in the apical compartment of epithelial–endothelial co-cultures.
A Well-differentiated airway organoids in co-cultures with or without lung microvascular endothelial cells were inoculated with pH1N1, H1N1, and H3N2 at MOI 1. At indicated timepoints virus titers were determined in the apical supernatants. Two-way ANOVA with Dunnett’s multiple comparison test comparing mono-cultures to co-cultures was performed. *P ≤0.05.
Figure 3.
Figure 3.. Quantification of influenza A virus infection in endothelial mono-cultures or in epithelial–endothelial co-cultures.
(A) Percentage of infection and (B) intracellular viral genome copies in LMEC mono-cultures compared with co-cultures were determined by flow cytometry or quantitative real-time PCR at 24 h post-inoculation. Data represented here show pooled data of either infection percentage or virus titers derived from three independent experiments performed in biological duplicates, and the mean ± SD is depicted. A t test was used to compare groups (*<0.05, **<0.01, ***<0.005, ****<0.001).
Figure S4.
Figure S4.. No influenza A virus infected endothelial cells in epithelial–endothelial co-cultures when inoculated directly.
(A, B) Well-differentiated airway organoids in co-cultures with lung microvascular endothelial cells were inoculated with mock or (B) pH1N1, H1N1, and H3N2 at MOI 1. At 24 h post-inoculation, the endothelial cells were directly inoculated with homologous viruses. The cells were fixed after 24 h post second inoculation and stained for the endothelial cell marker vascular endothelial-cadherin (VE-CAD magenta) and influenza A virus nucleoprotein (NP, green). Hoechst (blue) was used to visualize nuclei. Scale bar: 20 µM.
Figure S5.
Figure S5.. Interferon and interferon-stimulated gene expression in airway organoids at air–liquid interface and lung microvascular endothelial cells inoculated with pH1N1.
To evaluate the innate antiviral state of lung microvascular endothelial cells and epithelial cells (airway organoids at air–liquid interface), the cells were inoculated with pH1N1. The gene expression of interferon-stimulated gene IFIT1, IFN-β, and IFN-λ was analyzed via qRT-PCR. Data represent mean ± SD from at least two independent experiments performed in biological duplicates. A t test was used to compare each group to mock (*<0.05).
Figure 4.
Figure 4.. Detection of cytokines produced by endothelial cells in the basolateral compartments of mono- or co-cultures.
Lung microvascular endothelial cells, epithelial cells (airway organoids at air–liquid interface) or endothelial–epithelial co-cultures were inoculated with pH1N1, H1N1, or H3N2 virus at MOI 1. At 24 h post-inoculation, cytokine protein concentrations were measured in the basolateral compartment using a LEGENDplex assay. Data represented here show individual data points of cytokines derived from three independent experiments performed in biological duplicates, and the mean ± SD is depicted. Mock protein concentration of each condition was subtracted from the protein concentrations measured in the virus-inoculated cultures. Statistical significance was determined with one-way ANOVA and each group was compared with each other (*<0.05, **<0.01, ***<0.005, ****<0.001).
Figure 5.
Figure 5.. Endothelial cells in pH1N1-inoculated ferret and human lungs express IL-6 mRNA.
(A) IL-6 production by endothelial cells was assessed in lung sections of a ferret inoculated with pH1N1 virus (1-d post-inoculation) and (B) lung sections of human lung biopsies inoculated with pH1N1 virus (1-d post-inoculation) by in situ hybridization for IL-6, followed by immunohistochemistry using an antibody for endothelial cells (von Willebrand factor, VWF). Arrows indicate cells that are positive for IL-6 and VWF.
Figure S6.
Figure S6.. Expression of IL-6 in von Willebrand factor positive endothelial cells in pH1N1-inoculated ferret.
IL-6 production by von Willebrand factor positive endothelial cells was assessed in lung sections of two independent ferrets inoculated with pH1N1 virus (1-d post-inoculation) by in situ hybridization for IL-6, followed by immunohistochemistry using an antibody for endothelial cells.

Similar articles

Cited by

References

    1. Clohisey S, Baillie JK (2019) Host susceptibility to severe influenza A virus infection. Crit Care 23: 303. 10.1186/s13054-019-2566-7 - DOI - PMC - PubMed
    1. Javanian M, Barary M, Ghebrehewet S, Koppolu V, Vasigala VKR, Ebrahimpour S (2021) A brief review of influenza virus infection. J Med Virol 93: 4638–4646. 10.1002/jmv.26990 - DOI - PubMed
    1. Piret J, Boivin G (2022) Viral interference between respiratory viruses. Emerg Infect Dis 28: 273–281. 10.3201/eid2802.211727 - DOI - PMC - PubMed
    1. Gounder AP, Boon ACM (2019) Influenza pathogenesis: The effect of host factors on severity of disease. J Immunol 202: 341–350. 10.4049/jimmunol.1801010 - DOI - PMC - PubMed
    1. De Jong MD, Simmons CP, Thanh TT, Hien VM, Smith GJD, Chau TNB, Hoang DM, Van Vinh Chau N, Khanh TH, Dong VC, et al. (2006) Fatal outcome of human influenza A (H5N1) is associated with high viral load and hypercytokinemia. Nat Med 12: 1203–1207. 10.1038/nm1477 - DOI - PMC - PubMed

Publication types