. 2023 Apr 18;6(7):e202302005.
doi: 10.26508/lsa.202302005. Print 2023 Jul.

Low-density lipoprotein receptor-related protein 1 (LRP1) as an auxiliary host factor for RNA viruses

Affiliations

Low-density lipoprotein receptor-related protein 1 (LRP1) as an auxiliary host factor for RNA viruses

Stephanie Devignot et al. Life Sci Alliance. .

Abstract

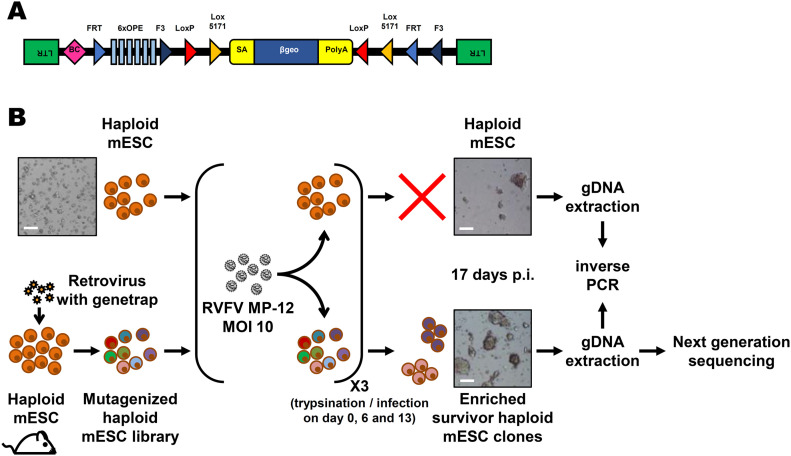
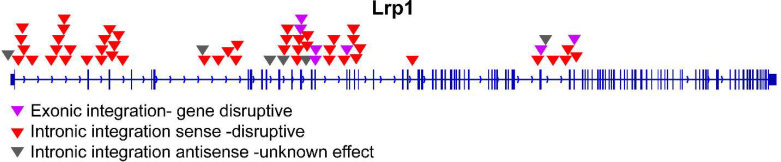
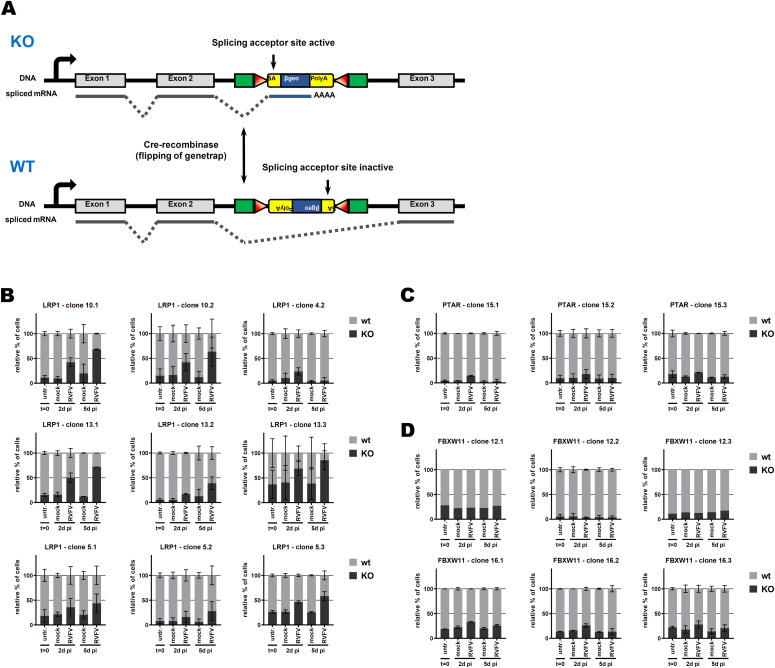
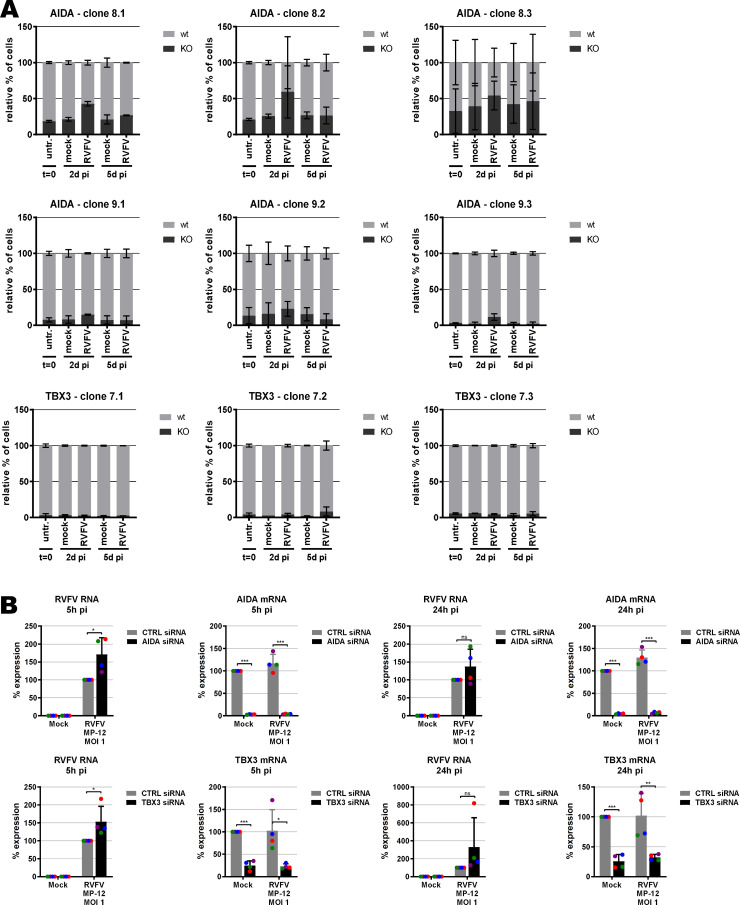
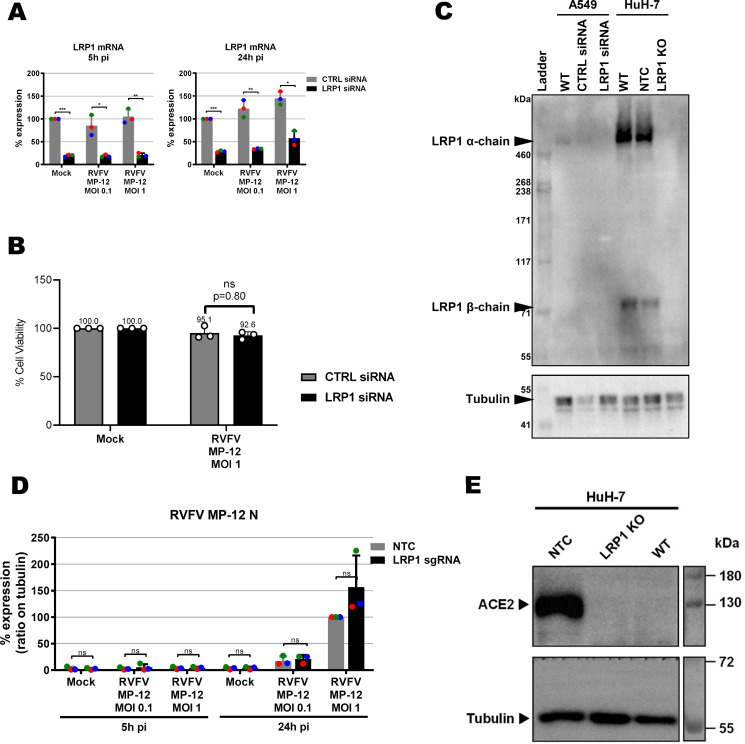
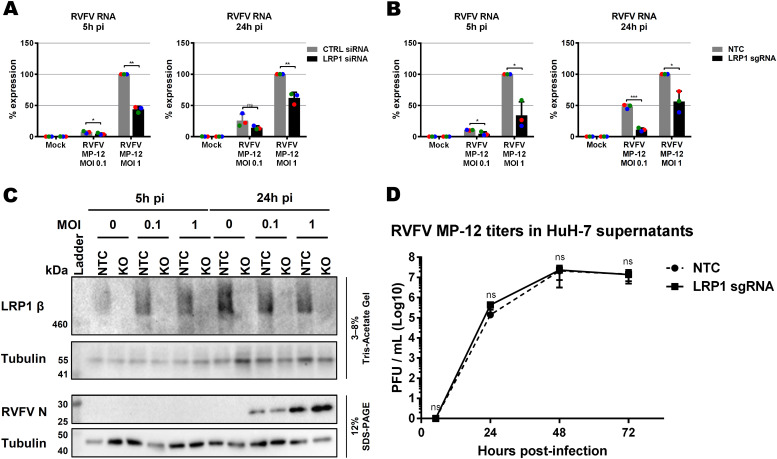
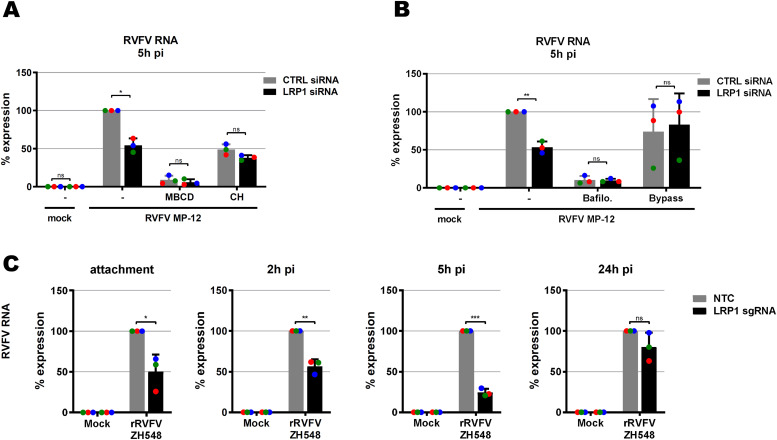
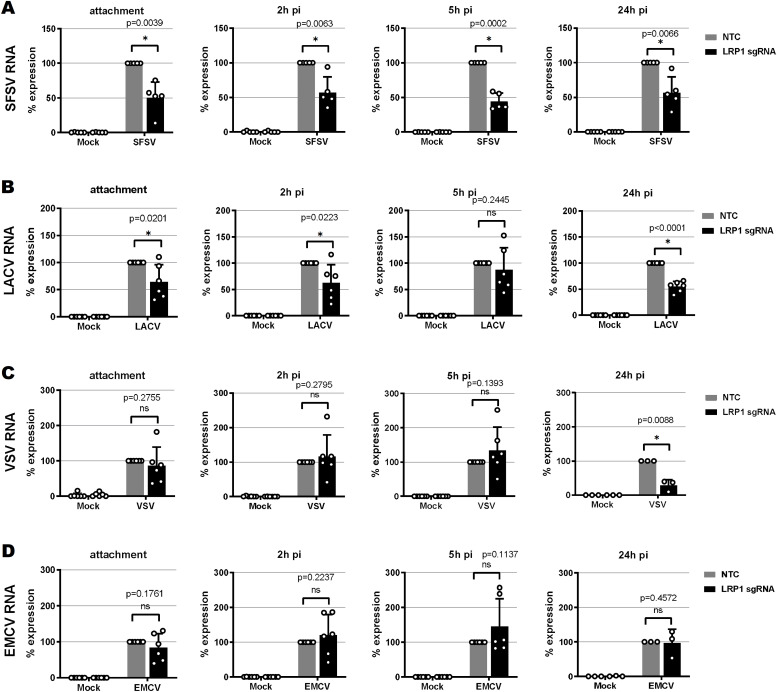
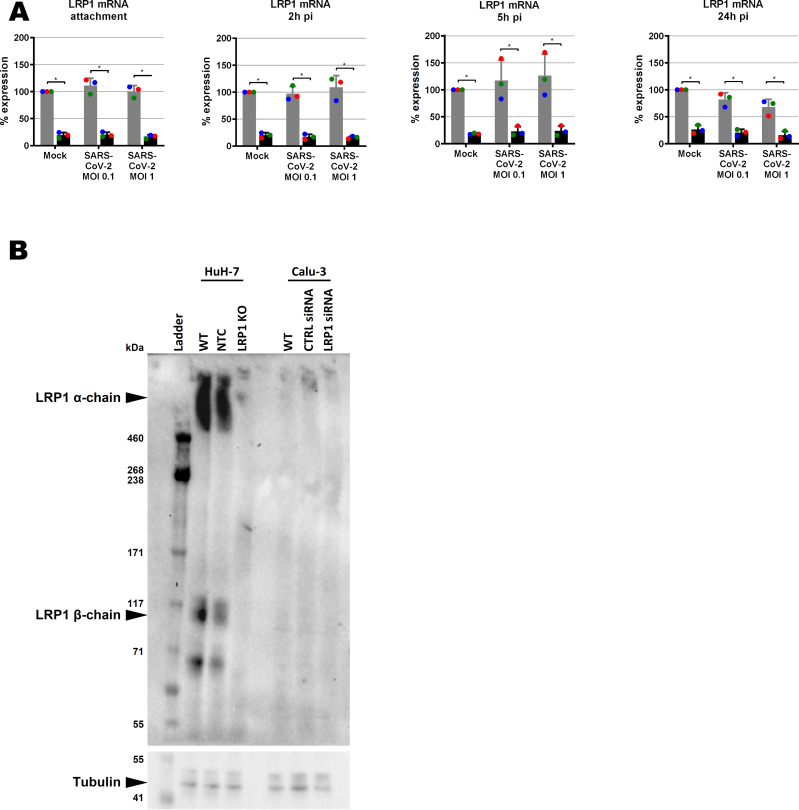
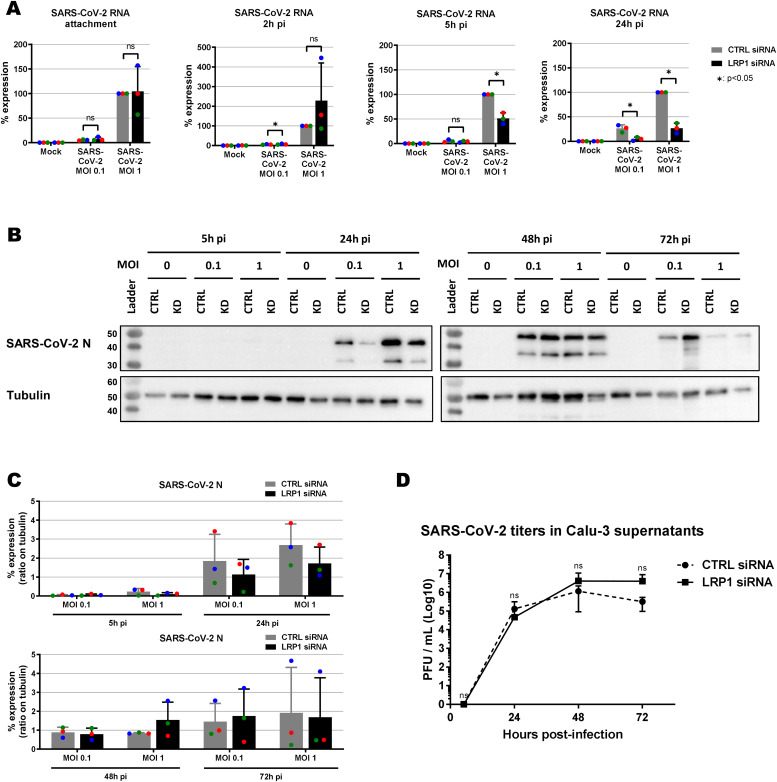
Viruses with an RNA genome are often the cause of zoonotic infections. In order to identify novel pro-viral host cell factors, we screened a haploid insertion-mutagenized mouse embryonic cell library for clones that are resistant to Rift Valley fever virus (RVFV). This screen returned the low-density lipoprotein receptor-related protein 1 (LRP1) as a top hit, a plasma membrane protein involved in a wide variety of cell activities. Inactivation of LRP1 in human cells reduced RVFV RNA levels already at the attachment and entry stages of infection. Moreover, the role of LRP1 in promoting RVFV infection was dependent on physiological levels of cholesterol and on endocytosis. In the human cell line HuH-7, LRP1 also promoted early infection stages of sandfly fever Sicilian virus and La Crosse virus, but had a minor effect on late infection by vesicular stomatitis virus, whereas encephalomyocarditis virus was entirely LRP1-independent. Moreover, siRNA experiments in human Calu-3 cells demonstrated that also SARS-CoV-2 infection benefitted from LRP1. Thus, we identified LRP1 as a host factor that supports infection by a spectrum of RNA viruses.


Conflict of interest statement

The authors declare that they have no conflict of interest.

Figures

Figure 1.
Figure 1.. Forward genetic screen of the haploid mouse embryonic stem cell library for resistance to RVFV MP-12.
(A) Schematic representation of the retroviral revertible genetrap used for mutagenesis. BC, barcode; OPE, Oct4 binding sites; SA, splicing acceptor site. (B) Experimental workflow for the RVFV MP-12 resistance screen using insertional mutagenesis. Bright-field microscopy images of the cells before infection and at the end of the screening process are shown as examples. mESC, mouse embryonic stem cell; p.i, post-infection; RVFV, Rift Valley fever virus. Scale bar: 0.5 mm.
Figure S1.
Figure S1.. Replication of RVFV MP-12 in monkey kidney cells Vero E6, and haploid mouse embryonic stem cells AN3-12.
(A) Two-step RT–PCR using primers located in the RVFV S segment, flanking the NSs gene. (B) Bright-field microscopy images of infected cells. Scale bar: 0.5 mm.
Figure S2.
Figure S2.. Bright-field microscopy of MP-12–infected mammalian embryonic stem cells, over the course of the forward genetic screen.
WT and retro-library AN3-12 cells were monitored every day over 17 d. Cells were trypsinized and reinfected at day 6 and day 13. A representative image is shown for each time point/condition. Scale bar (top left image): 0.5 mm.
Figure S3.
Figure S3.. Inverted PCR on genomic DNA.
(A) Schematic representation of the workflow process. The four-cutter enzymes are MseI and NlaIII. The eight-cutter enzyme is SbfI. Primers are located in the genetrap and are designed to amplify the site of insertion. (B) Visualization of inverted PCR products in an agarose gel. Primers are described in Table S1.
Figure S4.
Figure S4.. Next-generation sequencing analysis of NlaIII- and MseI-digested RVFV-infected AN3-12 library, showing the presence of the genetrap in the LRP1 gene.
Figure 2.
Figure 2.. Growth competition assay in mouse embryonic stem cells.
(A) Schematic representation of the genetrap system when inserted into an intron. When in sense orientation, the genetrap exposes a splicing acceptor site and will be inserted into the mature mRNA, leading to a knockout of the gene of interest. When in antisense orientation, the splicing acceptor site is inactive and the genetrap will be spliced out, leading to a WT expression of the gene of interest. Flipping of the genetrap orientation is possible by expressing the Cre recombinase. (B, C, D) Growth competition assay between sister clones bearing a genetrap into the gene of interest ((B): LRP1, (C): PTAR, and (D): FBXW11). Sister clones with WT phenotype are in grey, and sister clones with knockout phenotype are in black (see Table 1). ∼30% of knockout cells were mixed with 70% of their WT sister clone, and infected with RVFV MP-12 at an MOI of 5. The ratio between both sister clones was followed by flow cytometry. n = 2, except if the event count was below 1,000, in which case the whole data set was removed (n = 1).
Figure S5.
Figure S5.. Validation of top-scoring genes TBX3 and AIDA, using the same methods as described for LRP1 (see Fig 2).
(A, B) Growth competition assay performed in triplicates, and (B) siRNA knockdown and RT–PCR analysis for RVFV RNA (MOI 1, n = 4). siRNAs against TBX3 (Hs_TBX3_3, Hs_TBX3_4, Hs_TBX3_5, and Hs_TBX3_6) and AIDA (Hs_C1orf80_1, Hs_C1orf80_2, Hs_C1orf80_3, and Hs_FLJ12806_4) were purchased from QIAGEN, as were RT–qRNA primer pairs (Hs_AIDA_1_SG, Hs_TBX3_1_SG).
Figure S6.
Figure S6.. LRP1 depletion in A549 and HuH-7 cells.
(A) LRP1 mRNA levels in control (CTRL) and LRP1 siRNA knockdown A549 cells as measured by RT–qPCR. Cells were infected with RVFV MP-12 at an MOI of 0.1 or MOI of 1, total RNA was extracted at 5 and 24 h post-infection (p.i.), and RT–qPCR was done to detect LRP1 and the GAPDH reference mRNAs. RNA levels in the CTRL mock-infected were set to 100%. (B) Cell survival. CTRL and LRP1 siRNA-treated A549 cells were infected with the RVFV strain MP-12 at an MOI of 1, and cell survival was measured 24 h later. (C) LRP1 protein levels in WT and knockdown or knockout A549 and HuH-7 cells, respectively, as measured by immunoblot analysis. NTC, no template control (clone E5); WT, wild type. The shown LRP1 KO is from clone C8. (D) Quantification of RVFV N immunoblot signals from three independent experiments as shown in Fig 3C. (C, E) ACE2 levels of the HuH-7 cells and cell clones shown in (C).
Figure 3.
Figure 3.. Influence of LRP1 downmodulation on RVFV MP-12.
(A, B) Virus RNA levels were measured in A549 cell knockdown for LRP1 (A) and HuH-7 cell knockout for LRP1 (B). Cells were infected in a synchronized manner with RVFV MP-12 at an MOI of 0.1 or MOI of 1, and RNA was extracted at 5 and 24 h post-infection (p.i.) as indicated. Two-step RT–qPCR was done to detect RVFV MP-12 RNA (L-segment) and the GAPDH reference gene. The RNA levels of the RVFV L-segment in the control siRNA or no template control CRISPR/Cas9 cells infected at an MOI of 1 were set to 100%. (C) LRP1 knockout HuH-7 cells were infected with RVFV MP-12 at an MOI of 0.1 or MOI of 1, lysed at 5 and 24 h p.i., and subjected to immunoblotting as indicated. A representative blot is shown. (D) HuH-7 CRISPR/Cas9 cells (no template control or LRP1 knockout) were infected with RVFV MP-12 at an MOI of 0.01, supernatants were harvested at the indicated time points, and infectious virus was measured by the plaque assay. (D) Statistics were done on three independent experiments, using a paired one-tailed t test ((D): log-transformed data): *, P < 0.05; **, P < 0.01; ***, P < 0.001; and n.s., non-significant.
Figure 4.
Figure 4.. Mapping the LRP1-promoted infection steps.
(A) Influence of cellular cholesterol levels. LRP1 siRNA-transfected A549 cells and their controls (see Fig 3A) were pretreated for 1 h with methyl-β-cyclodextrin to deplete cholesterol, or enriched with additional cholesterol (CH), before synchronized infection with RVFV MP-12 at an MOI of 1 for 5 h. (B) Role of endocytosis. Cells were pretreated for 1 h with bafilomycin A1 to block endosomal acidification, or incubated for 3 min with an acidic medium (pH 5.0) to force the fusion of viral particles at the cell surface (bypass). (C) RVFV ZH548 RNA levels in LRP1 knockout cells over the course of infection. HuH-7 LRP1 knockout cells and HuH-7 NTC (no template control) cells were infected in a synchronized manner at an MOI of 1, washed three times, and further incubated in a medium. Samples were collected after the three washes post-infection (attachment step), or at 2, 5, or 24 h post-infection. Two-step RT–qPCR was done to detect viral RNA and the GAPDH reference gene. The RNA levels in the infected NTC cells were set to 100%. Statistics were done on three independent experiments, using a paired one-tailed t test: *, P < 0.05; **, P < 0.01; ***, P < 0.001; and n.s., non-significant.
Figure 5.
Figure 5.. Virus RNA levels in LRP1 knockout cells over the course of infection.
(A, B, C, D) Sandfly fever Sicilian virus, (B) La Crosse virus, (C) vesicular stomatitis virus, and (D) encephalomyocarditis virus. HuH-7 LRP1 knockout cells and HuH-7 NTC (no template control) cells were infected with the various viruses at an MOI of 1, except for vesicular stomatitis virus that was used at an MOI of 0.1, washed three times, and further incubated in a medium. Samples were collected after the three washes post-infection (attachment step), or at 2, 5, or 24 h post-infection. Two-step RT–qPCR was done to detect viral RNAs, and the GAPDH and 18S rRNA reference genes. The RNA levels in the infected NTC cells were set to 100%. Statistics were done on six independent experiments, using a paired one-tailed t test: *, P < 0.05; **, P < 0.01; ***, P < 0.001; and n.s., non-significant.
Figure S7.
Figure S7.. LRP1 expression in wt and LRP1-depleted human cell lines.
(A) LRP1 mRNA levels in WT and knockdown Calu-3 cells as measured by RT–qPCR (samples of Fig 6A). Cells were infected with SARS-CoV-2 at an MOI of 0.1 or MOI of 1, RNA was extracted at the indicated time points p.i., and RT–qPCR was performed to detect LRP1 and the GAPDH reference mRNAs. RNA levels in the CTRL mock-infected were set to 100%. (B) LRP1 protein levels in WT and knockout HuH-7 cells and knockdown Calu-3 cells as measured by immunoblot analysis. CTRL, control; NTC, no template control; WT, wild type.
Figure 6.
Figure 6.. Effect of LRP1 knockdown on SARS-CoV-2 multiplication in Calu-3 lung cells.
(A, B, C, D) siRNA-transfected cells were infected at the two indicated MOIs; samples for viral RNA analysis (A), immunoblotting (B, C), and virus yields (MOI 0.01) (D) were taken at the different time points, and analysed as described for Figs 3, 4, and 5. (B) Representative blot is shown in (B). (C) Quantifications of the N immunoblot signals relative to the tubulin signal are shown in (C). (D) Statistics were done on three independent experiments, using a paired one-tailed t test ((D): log-transformed data): *, P < 0.05; **, P < 0.01; ***, P < 0.001; and n.s., non-significant. Source data are available for this figure.

Similar articles

Cited by

References

    1. Actis Dato V, Chiabrando GA (2018) The role of low-density lipoprotein receptor-related protein 1 in lipid metabolism, glucose homeostasis and inflammation. Int J Mol Sci 19: 1780. 10.3390/ijms19061780 - DOI - PMC - PubMed
    1. Agnello V, Abel G, Elfahal M, Knight GB, Zhang QX (1999) Hepatitis c virus and other flaviviridae viruses enter cells via low density lipoprotein receptor. Proc Natl Acad Sci U S A 96: 12766–12771. 10.1073/pnas.96.22.12766 - DOI - PMC - PubMed
    1. Albornoz A, Hoffmann AB, Lozach PY, Tischler ND (2016) Early bunyavirus-host cell interactions. Viruses 8: 143. 10.3390/v8050143 - DOI - PMC - PubMed
    1. Alkan C, Bichaud L, de Lamballerie X, Alten B, Gould EA, Charrel RN (2013) Sandfly-borne phleboviruses of eurasia and africa: Epidemiology, genetic diversity, geographic range, control measures. Antiviral Res 100: 54–74. 10.1016/j.antiviral.2013.07.005 - DOI - PubMed
    1. Amraei R, Yin WQ, Napoleon MA, Suder EL, Berrigan J, Zhao Q, Olejnik J, Chandler KB, Xia CS, Feldman J, et al. (2021) Cd209l/l-sign and cd209/dc-sign act as receptors for sars-cov-2. ACS Cent Sci 7: 1156–1165. 10.1021/acscentsci.0c01537 - DOI - PMC - PubMed

Publication types

MeSH terms

Substances