. 2023 Apr 18;14(1):1894.
doi: 10.1038/s41467-023-37385-0.

The value of ecosystem services in global marine kelp forests

Affiliations

The value of ecosystem services in global marine kelp forests

Aaron M Eger et al. Nat Commun. .

Erratum in

  • Author Correction: The value of ecosystem services in global marine kelp forests.
    Eger AM, Marzinelli EM, Beas-Luna R, Blain CO, Blamey LK, Byrnes JEK, Carnell PE, Choi CG, Hessing-Lewis M, Kim KY, Kumagai NH, Lorda J, Moore P, Nakamura Y, Pérez-Matus A, Pontier O, Smale D, Steinberg PD, Vergés A. Eger AM, et al. Nat Commun. 2023 May 18;14(1):2841. doi: 10.1038/s41467-023-38666-4. Nat Commun. 2023. PMID: 37202380 Free PMC article. No abstract available.

Abstract

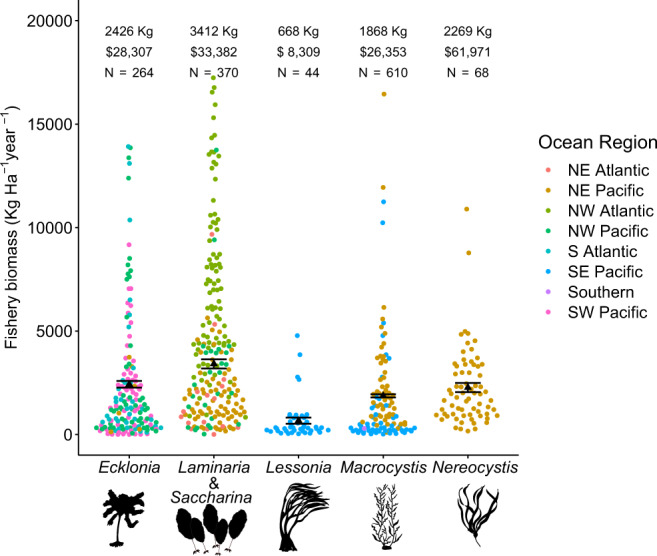
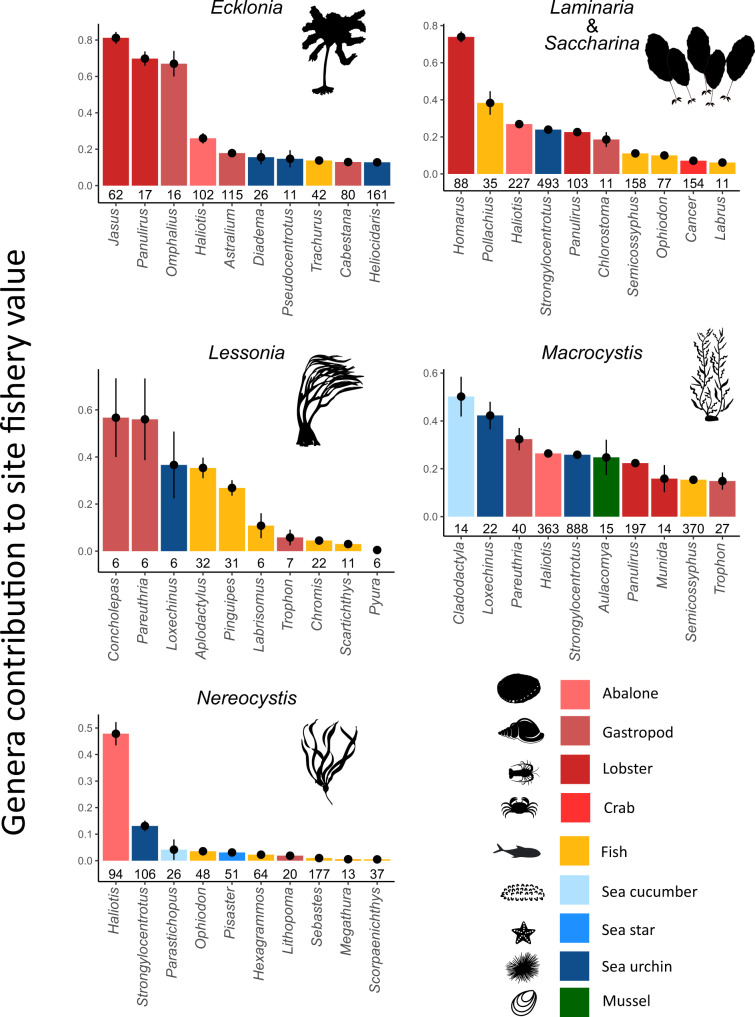
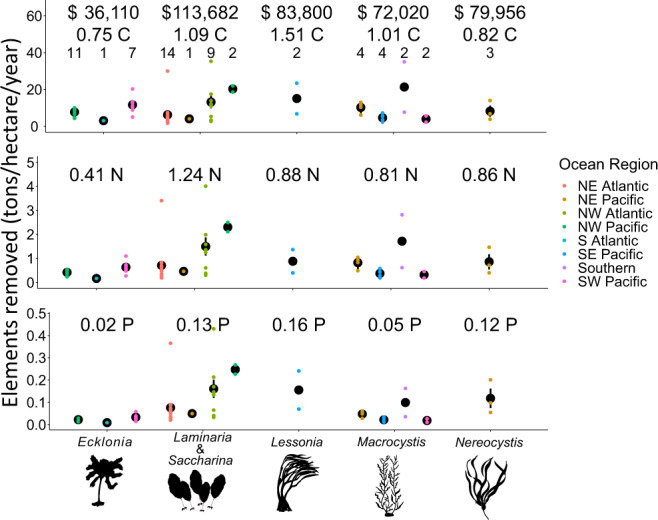
While marine kelp forests have provided valuable ecosystem services for millennia, the global ecological and economic value of those services is largely unresolved. Kelp forests are diminishing in many regions worldwide, and efforts to manage these ecosystems are hindered without accurate estimates of the value of the services that kelp forests provide to human societies. Here, we present a global estimate of the ecological and economic potential of three key ecosystem services - fisheries production, nutrient cycling, and carbon removal provided by six major forest forming kelp genera (Ecklonia, Laminaria, Lessonia, Macrocystis, Nereocystis, and Saccharina). Each of these genera creates a potential value of between $64,400 and $147,100/hectare each year. Collectively, they generate between $465 and $562 billion/year worldwide, with an average of $500 billion. These values are primarily driven by fisheries production (mean $29,900, 904 Kg/Ha/year) and nitrogen removal ($73,800, 657 Kg N/Ha/year), though kelp forests are also estimated to sequester 4.91 megatons of carbon from the atmosphere/year highlighting their potential as blue carbon systems for climate change mitigation. These findings highlight the ecological and economic value of kelp forests to society and will facilitate better informed marine management and conservation decisions.


Conflict of interest statement

We declare that the authors have no competing interests as defined by Nature Portfolio, or other interests that might be perceived to influence the results and/or discussion reported in this paper.

Figures

Fig. 1
Fig. 1. Fisheries biomass and associated economic value provided by kelp forests.
Site (unique time and location) yearly total biomass and the economic value of the harvestable fisheries production per hectare per year. The values are represented for each kelp genus, colours represent the ocean region, the black triangle and number values represent the mean value for the genus, the error bars are the standard error. Note: the sample size represents the number of points used for calculation, though 70–90% of points for Ecklonia, Laminaria & Saccharina (previously classified as Laminaria in some regions), and Macrocystis have been randomly removed from the graph for better visualization. Image credit: Tim Carruthers, Integration and Application Network (ian.umces.edu/media-library) for the Ecklonia, Laminaria, Lessonia, Macrocystis, Nereocystis images.
Fig. 2
Fig. 2. Individual genera contributions to the economic value of study sites.
The mean proportion each genus contributed to a site’s overall fisheries value per year, the lines represent plus and minus one standard error. The sample size is above the genera, n = number of surveys a genus appeared in, only genera that appeared in more than 10 surveys are represented (more than 5 for Lessonia due to fewer surveys). Image credit: Tim Carruthers, Integration and Application Network (ian.umces.edu/media-library) for the Ecklonia, Laminaria, Lessonia, Macrocystis, Nereocystis, abalone, snail, lobster, crab, fish, sea cucumber, sea star, sea urchin, and mussel images.
Fig. 3
Fig. 3. Annual value of the carbon, nitrogren, and phosphorus removal services provided by kelp forests.
The mean yearly removal of carbon (C), nitrogen (N), and phosphorus (P) in tons per hectare per year. The black dots represent the mean value for the genus in that region, the error bars are the standard error. The currency is in thousands of international dollars for the year 2020 and is given as an average value for each genus. The top text dollar values are the combined economic value for the removal of all three elements. Sample sizes (unique location-time measurement) are presented above each point. Image credit: Tim Carruthers, Integration and Application Network (ian.umces.edu/media-library) for the Ecklonia, Laminaria, Lessonia, Macrocystis, Nereocystis images.
Fig. 4
Fig. 4. Kelp forest distribution and associated economic value by region.
Map of kelp distribution, total economic value per m2 per year (k), regional value (B). Lighter shade colours are for regions where distribution estimates were not available and therefore these values were not included in the regional value calculation. Image credit: Tim Carruthers, Integration and Application Network (ian.umces.edu/media-library) for the Ecklonia, Laminaria, Lessonia, Macrocystis, Nereocystis images and map provided by FreeVectorMaps.com.
Fig. 5
Fig. 5. Flow chart of steps for calculating the market value of different services.
Diagram of the data processing steps used to translate ecological values into economic ones. In weight-length approximation, W = weight, L = length, a & b = coefficients. Image credit: Tim Carruthers, Integration and Application Network (ian.umces.edu/media-library) for the Ecklonia, Laminaria, Lessonia, Macrocystis, Nereocystis, sea star, lobster, and fish images.

References

    1. Darwin 1809-1882, C. The Voyage of the Beagle (Dutton, 1959).
    1. Erlandson JM, et al. The kelp highway hypothesis: marine ecology, the coastal migration theory, and the peopling of the Americas. J. Isl. Coast. Archaeol. 2007;2:161–174. doi: 10.1080/15564890701628612. - DOI
    1. Thornton TF. The ideology and practice of Pacific herring cultivation among the Tlingit and Haida. Hum. Ecol. 2015;43:213–223. doi: 10.1007/s10745-015-9736-2. - DOI
    1. Kain (Jones), J. M. & Dawes, C. P. Useful European seaweeds: past hopes and present cultivation. Hydrobiologia151, 173–181 (1987).
    1. Peteiro, C. Alginate production from marine macroalgae, with emphasis on kelp farming. In: Alginates and their Biomedical Applications (eds Rehm, B. H. A. & Moradali, M. F.) 27–66 (Springer, 2018).

Publication types