. 2023 Apr 18;14(1):2214.
doi: 10.1038/s41467-023-37696-2.

Bladder cancer organoids as a functional system to model different disease stages and therapy response

Affiliations

Bladder cancer organoids as a functional system to model different disease stages and therapy response

Martina Minoli et al. Nat Commun. .

Abstract

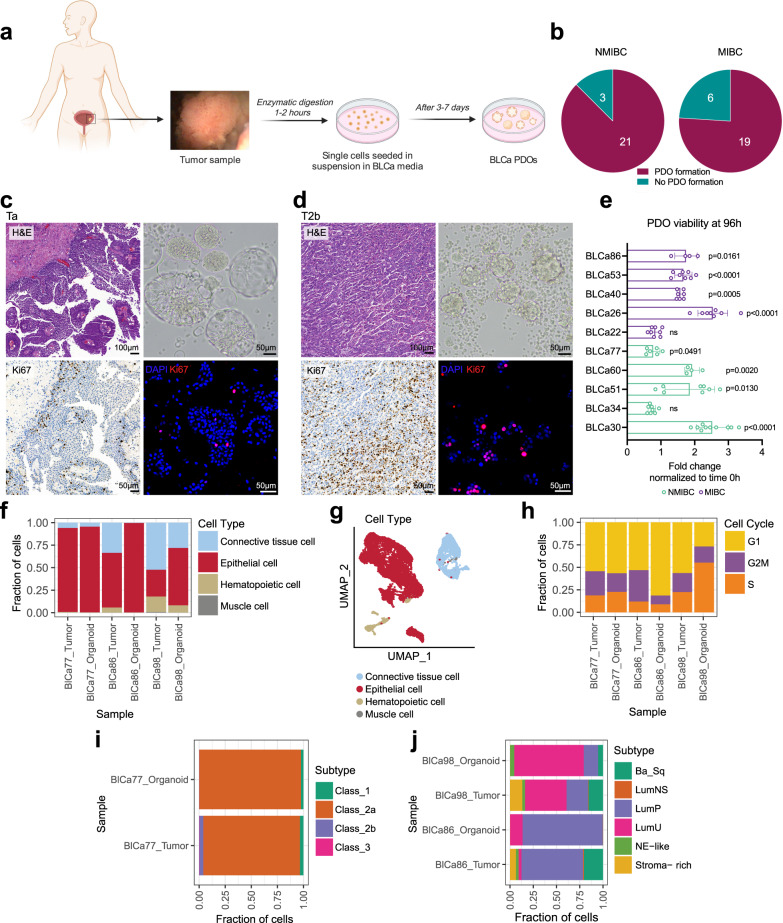
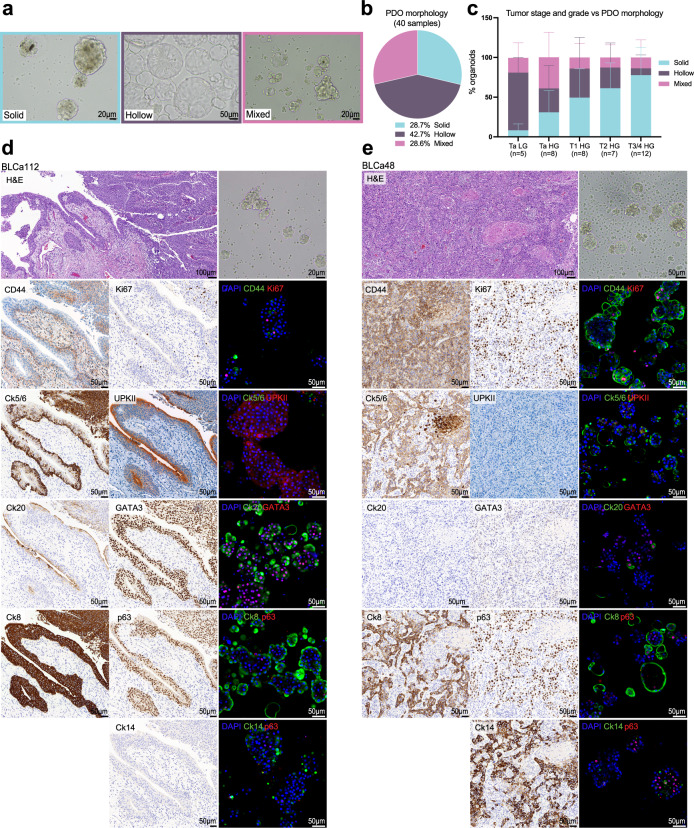
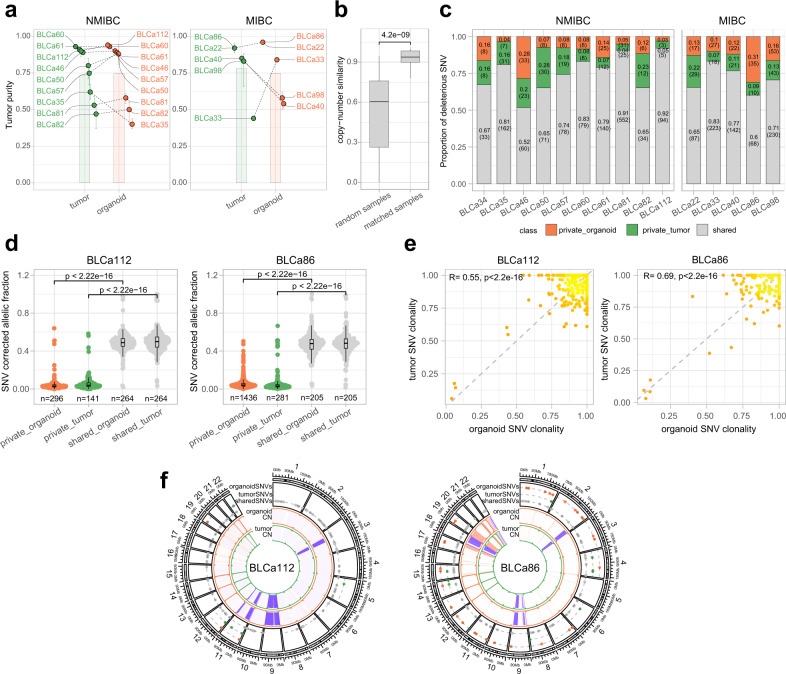
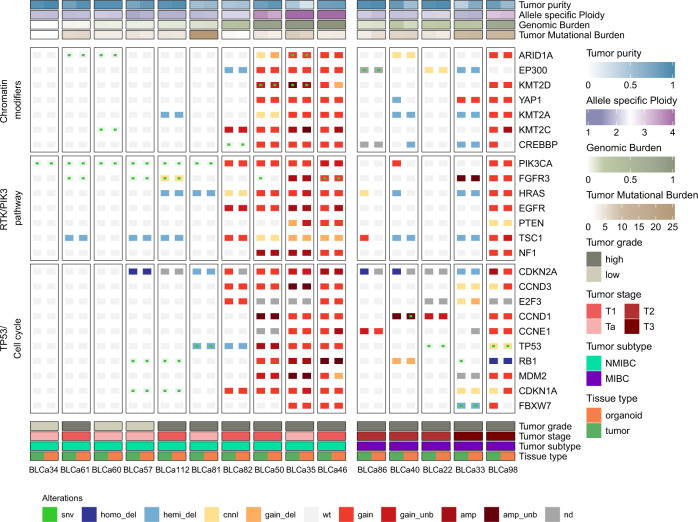
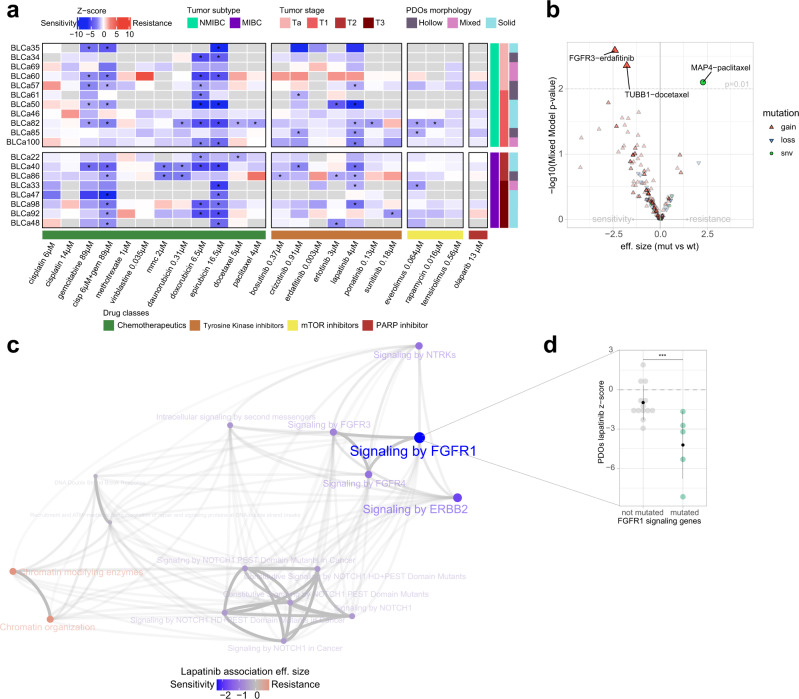
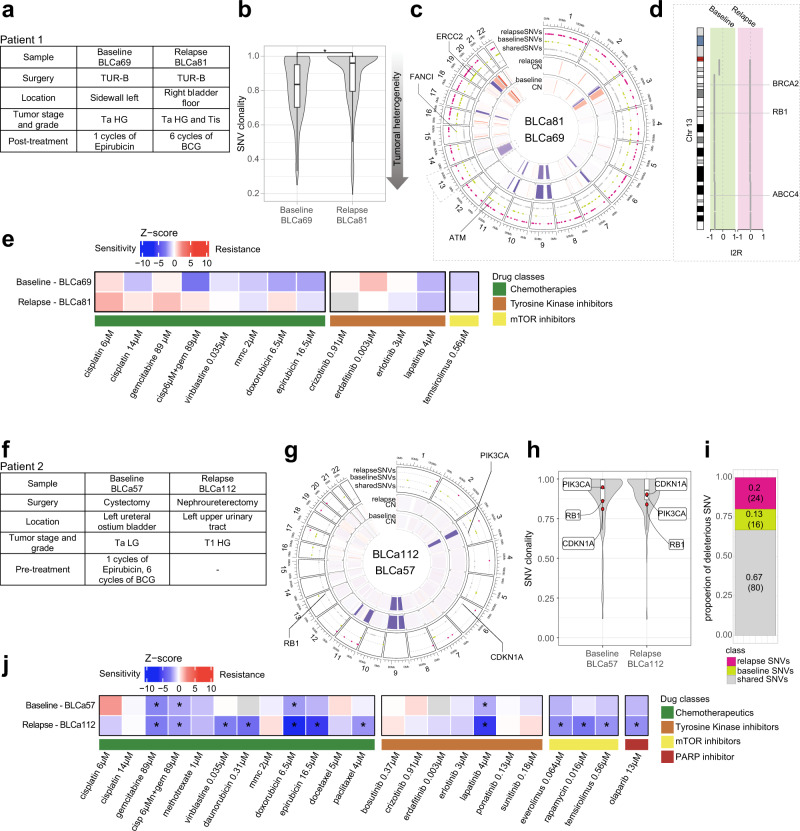
Bladder Cancer (BLCa) inter-patient heterogeneity is the primary cause of treatment failure, suggesting that patients could benefit from a more personalized treatment approach. Patient-derived organoids (PDOs) have been successfully used as a functional model for predicting drug response in different cancers. In our study, we establish PDO cultures from different BLCa stages and grades. PDOs preserve the histological and molecular heterogeneity of the parental tumors, including their multiclonal genetic landscapes, and consistently share key genetic alterations, mirroring tumor evolution in longitudinal sampling. Our drug screening pipeline is implemented using PDOs, testing standard-of-care and FDA-approved compounds for other tumors. Integrative analysis of drug response profiles with matched PDO genomic analysis is used to determine enrichment thresholds for candidate markers of therapy response and resistance. Finally, by assessing the clinical history of longitudinally sampled cases, we can determine whether the disease clonal evolution matched with drug response.


Conflict of interest statement

The authors declare no competing interests.

Figures

Fig. 1
Fig. 1. Isolation and culture of patient-derived organoids (PDOs) from non-muscle invasive bladder cancer (NMIBC) and muscle invasive bladder cancer (MIBC).
a Scheme of the experimental protocol for bladder cancer (BLCa) organoids derivation and culture. Created with BioRender.com. b Number of PDO formation and no PDO formation over the total samples cultured for NMIBC (n = 24 biological samples) and MIBC (n = 25 biological samples). c, d Morphology of parental tumor (PTs, Hematoxylin and Eosin staining) and matched PDOs at passage (p) 1 (brightfield image, upper) for two representative cases (BLCa34, transurethral resection of bladder tumor, Ta stage (c); BLCa40, cystectomy, T2b stage (d)). Immunohistochemistry for Ki67 for PT, and whole-mount immunofluorescence staining for Ki67 for PDOs (bottom). e Viability assay of PDOs at p2 derived from 5 NMIBC and 5 MIBC samples after 96 h in culture. Each data point corresponds to one technical replicate (mean ± SD) at 96 h (normalized to the time 0 h) for one experiment (n represents the technical replicates: n = 10 for BLCa30 (96 h); n = 5 for BLCa22 (0 h), BLCa26 (0 h), BLCa30 (0 h), BLCa40 (0 h), BLCa51 (0 h), BLCa53 (0 h), and BLCa77 (0 h); n = 8 for BLCa34 (96 h), BLCa51 (96 h), BLCa22 (96 h), BLCa26 (96 h) and BLCa53 (96 h); n = 7 for BLCa40 (96 h), and BLCa86 (0 h); n = 6 for BLCa77 (96 h); n = 4 for BLCa60 (0 h and 96 h), BLCa86 (96 h), and BLCa34 (0 h)). Statistically significance between time 0 and 96 h was calculated by two-sided Welch’s test. f Fraction of cell types in PT/PDOs (p1) pairs for three representative cases (BLCa77 NMIBC, BLCa86 MIBC, and BLCa98 MIBC). g UMAP plot of cells derived from PT/PDOs (p1) pairs clustered by cell types. h Fraction of cells in cell cycle phases in PT/PDOs pairs. i, j Proportion of epithelial cells that correspond to each molecular class for the BLCa77 sample (i, UROMOL2021 classifier) and for BLCa86 and BLCa98 samples (j, Consensus classifier). Ba_Sq basal/squamous, LumNS luminal nonspecified, LumP luminal papillary, LumU luminal unstable, NE-like neuroendocrine-like, ns not significant.
Fig. 2
Fig. 2. Bladder cancer (BLCa) patient-derived organoids (PDOs) recapitulate original primary tumor (PT) features in vitro.
a Representative brightfield images of BLCa PDOs at passage (p) 1 with a solid (BLCa50, day 9), hollow (BLCa34, day 7), or mixed (BLCa69, day 7) morphology. b % of PDO morphology over the total analyzed samples (n = 1763 total counted organoids from 40 biological samples). c Distribution of PDO morphology in samples grouped based on PT stage and grade (mean from biological samples ± SD; n represents the number of biological samples: n = 5 for Ta LG; n = 8 for Ta HG and T1 HG; n = 7 for T2 HG; and n = 12 for T3/4 HG). Two-way ANOVA test with Tukey’s multiple comparison (matching values of each biological sample stacked into sub-columns) was used to compare the % of PDO morphologies between tumor stages and grades (Solid: Ta LG vs T3/4 p-value = 0.0001; Ta HG vs T3/4 p-value = 0.0256 Ta HG vs T2 p-value = 0.0237. Hollow: Ta HG vs T3/4 p-value = 0.0026). d, e Hematoxylin and Eosin staining and immunohistochemistry staining of PT for indicated markers and brightfield images and whole-mount immunofluorescent staining of PDOs at p1 for indicated markers. One representative sample for non-muscle invasive BLCa (BLCa112, d) and one for muscle invasive BLCa (BLCa48, e). Ck cytokeratin, HG high-grade, LG low-grade, UPKII uroplakin II.
Fig. 3
Fig. 3. Patient-derived organoids (PDOs) retain key genomic features of parental tumors (PT).
a Tumor purity in PT and matched PDOs of non-muscle invasive bladder cancer (NMIBC, left) and muscle invasive bladder cancer (MIBC, right) samples (n = 15 biological samples; mean estimate ± SE). Two-sided paired Wilcoxon test between PDOs and PT, p-value = 0.31. b Allele-specific copy-number (CN) similarity in randomly paired samples and matched paired ones (n = 312 randomly matched, n = 13 matched PDOs with corresponding PT). Boxplots indicate median (middle line), 25th, 75th percentile (box) and 5th and 95th percentile (whiskers). Two-sided Wilcoxon test, p-value = 4.2e−09. c Proportion of shared and private deleterious single nucleotide variants (SNVs) between PDOs and PTs. For each sample, proportions were compared using two-sided Chi-squared test, p-value <0.05. d Distributions of the tumor content and ploidy corrected allelic fraction (AF) of all the shared and private SNVs in PDOs and PTs in two representative samples (NMIBC BLCa112 left, n = 266 shared tumor SNVs, n = 263 shared organoids SNVs, n = 141 private tumor SNVs, n = 296 private organoid SNVs; MIBC BLCa86 right, n = 201 shared tumor SNVs, n = 209 shared organoids SNVs, n = 281 private tumor SNVs, n = 1436 private organoid SNVs). Boxplots indicate median (middle line), 25th, 75th percentile (box), and 5th and 95th percentile (whiskers). Two-sided Wilcoxon test, p-value <2.22e16. e Clonality of shared point mutations of matched PDOs and PTs (BLCa112 and BLCa86). Two-sided correlation test p-value and Pearson’s correlation coefficient (R) are reported within the figure, p-value <2.22e−16. f Copy-number and point mutations profiles between PDOs and PTs for two representative samples (NMIBC BLCa112 left, MIBC BLCa86 right).
Fig. 4
Fig. 4. Tumor and matched patient-derived organoids (PDOs) recapitulate typical mutational mechanisms of bladder cancer (BLCa).
Mutation heat-map. Samples are represented in the columns, with primary tumor on the left (green; n = 15 biological samples) and PDOs on the right (orange; n = 15 biological samples). PDO/PT pairs from the same samples are grouped by tumor subtype and ordered by increasing genomic burden within groups. The copy-number profile of the samples with high allele-specific Ploidy (asP, see “Methods”) is characterized by universal copy-number gains and amplifications. Rows represent genes grouped per pathway. Different types of genomic alterations are indicated in different colors in the bottom and Tumor purity, allele-specific Ploidy, Genomic Burden, and Tumor Mutational Burden are reported on the top. amp amplification, amp_unb amplification unbalanced, cnnl copy number neutral loss, gain_del gain deletion (gain with Loss of heterozygosity), gain_unb gain unbalanced, homo_del homo-deletion, hemi_del hemi-deletion, MIBC muscle-invasive BLCa, NMIBC non-muscle invasive BLCa, nd not determined, snv single nucleotide variant, wt wild-type.
Fig. 5
Fig. 5. Patient-derived organoid (PDO) drug response and association with gene alterations.
a Results of PDO drug screen assay (n = 19 biological samples). Heatmap reports the average of z-scores normalized to the vehicle values from cell viability assays after 48 h exposure of PDOs to drugs for one experiment for each biological sample (raw data are provided in Supplementary Data 6). Tumor subtype and stage, and PDO morphology are indicated in different colors on the right of the heatmap; not available data are in gray. Statistically significance between treatments and vehicle was calculated by one-way ANOVA test with Dunnet’s multiple comparison, *z-score ≤ −1.5 and adjusted p-value ≤ 0.05. b Genomic association analysis between genomic somatic events and treatment sensitivity/resistance. Reported p-value is obtained through Linear Mixed Model (LMM) fit (see “Methods”, section drugs association analyses) without adjusting for multiple comparisons. c Association analysis between frequently mutated pathways in PDOs and lapatinib sensitivity. Edges transparency encodes the proportion of shared genes between each term. Node size is proportional to the effect size of the association with lapatinib response (see “Methods”, section drugs association analyses). LLM. d Dot plot showing response to lapatinib in PDOs enriching for mutations on FGFR1 signaling genes compared to PDOs that do not show significant enrichment. Each data point corresponds to one biological sample (n = 18 for not mutated, n = 4 for mutated, mean +/− SD is reported in black) computed as the average z-score across technical replicates. P-value is obtained through LMM fit (see “Methods”, section drugs association analyses), ***False discovery rate = 0.02. cisp cisplatin, gem gemcitabine, mmc mitomycin C, mut mutation, wt wild type, snv single nucleotide variant.
Fig. 6
Fig. 6. Monitoring tumor recurrence and progression and assessing drug sensitivity in vitro with longitudinally patient-derived organoids (PDOs).
a Clinical and pathological information of patient 1. b Shared single nucleotide variant (SNV) clonality in PDOs baseline and relapse (n = 739 baseline SNVs; n = 607 relapse SNVs) and its associated gradient of tumoral heterogeneity (arrow pointing to higher tumoral heterogeneity). Box plots indicate median (middle line), 25th, 75th percentile (box), and 5th and 95th percentile (whiskers). Two-sided paired Wilcoxon test, *p-value <2.2e−16. c Copy-number (CN) and point mutations profiles between PDO from the baseline and the relapse. Relevant genetic alterations are highlighted. e Highlight on chromosome 13 deletion with affected genes. d Results of one PDO drug screen assay on patient 1. Heatmap represents the average of z-scores normalized to the vehicle values from cell viability assays after 48 h exposure of PDOs to drugs for one experiment. Samples code is indicated on the right side whereas tested drugs on the bottom of the heatmap. Not available data are in gray. One-way ANOVA with Dunnet’s multiple comparison test between treatments and vehicle (raw data are provided in Supplementary Data 6). f Clinical and pathological information of patient 2. g CN and point mutations profiles between PDOs from the baseline and the relapse of patients 2. Relevant genetic alterations are highlighted. h SNV clonality profiles of baseline PDOs and relapse PDOs with a highlight for PI3KCA, RB1, and CDKN1A genes. i Proportion of deleterious SNVs shared and not shared between baseline and relapse PDOs. j Results of one PDO drug screen assay on patient 2. One-way ANOVA with Dunnet’s multiple comparison test between treatments and vehicle, *z-score ≤ −1.5 and adjusted p-value ≤ 0.05 (raw data are provided in Supplementary Data 6). BCG Bacillus Calmette–Guérin, cisp cisplatin, Chr chromosome, Tis carcinoma in situ, gem gemcitabine, TUR-B transurethral resection of the bladder. HG high-grade, LG low-grade.

Comment in

  • Uro-Science.
    Atala A. Atala A. J Urol. 2023 Dec;210(6):922-924. doi: 10.1097/JU.0000000000003662. Epub 2023 Sep 29. J Urol. 2023. PMID: 37774378 No abstract available.

Similar articles

Cited by

References

    1. Soukup V, et al. Prognostic performance and reproducibility of the 1973 and 2004/2016 World Health Organization grading classification systems in non-muscle-invasive bladder cancer: a European Association of Urology Non-muscle Invasive Bladder Cancer Guidelines Panel systematic review. Eur. Urol. 2017;72:801–813. doi: 10.1016/j.eururo.2017.04.015. - DOI - PubMed
    1. Babjuk M, et al. European association of urology guidelines on non-muscle-invasive bladder cancer (TaT1 and carcinoma in situ)—2019 update. Eur. Urol. 2019;76:639–657. doi: 10.1016/j.eururo.2019.08.016. - DOI - PubMed
    1. Matulewicz RS, Steinberg GD. Non-muscle-invasive bladder cancer: overview and contemporary treatment landscape of neoadjuvant chemoablative therapies. Rev. Urol. 2020;22:43–51. - PMC - PubMed
    1. Miller KD, et al. Cancer treatment and survivorship statistics, 2016. CA: A Cancer J. Clin. 2016;66:271–289. - PubMed
    1. Facchini G, et al. Advanced/metastatic bladder cancer: current status and future directions. Eur. Rev. Med. Pharm. Sci. 2020;24:11536–11552. - PubMed

Publication types

MeSH terms