. 2023 Apr 18;14(1):2209.
doi: 10.1038/s41467-023-37930-x.

Damage dynamics and the role of chance in the timing of E. coli cell death

Affiliations

Damage dynamics and the role of chance in the timing of E. coli cell death

Yifan Yang et al. Nat Commun. .

Abstract

Genetically identical cells in the same stressful condition die at different times. The origin of this stochasticity is unclear; it may arise from different initial conditions that affect the time of demise, or from a stochastic damage accumulation mechanism that erases the initial conditions and instead amplifies noise to generate different lifespans. To address this requires measuring damage dynamics in individual cells over the lifespan, but this has rarely been achieved. Here, we used a microfluidic device to measure membrane damage in 635 carbon-starved Escherichia coli cells at high temporal resolution. We find that initial conditions of damage, size or cell-cycle phase do not explain most of the lifespan variation. Instead, the data points to a stochastic mechanism in which noise is amplified by a rising production of damage that saturates its own removal. Surprisingly, the relative variation in damage drops with age: cells become more similar to each other in terms of relative damage, indicating increasing determinism with age. Thus, chance erases initial conditions and then gives way to increasingly deterministic dynamics that dominate the lifespan distribution.


Conflict of interest statement

The authors declare no competing interests.

Figures
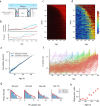
Fig. 1
Fig. 1. Damage dynamics in starving E. coli cells.
a Individual E. coli cells were placed in microfluidic channels with medium flow. Propidium iodide (PI) added to the medium crosses the membrane and stains DNA when membrane integrity is compromised. b Membrane damage was measured by the temporal derivative of PI fluorescence. Shown are, for two individual cells (red and cyan), the fluorescence signals (top) and derived PI uptake rates in 7 h time windows (bottom). c Colormaps of normalized fluorescence time-series (background and peak intensities normalized to 0 and 1, colored as black to bright red), with individual cells ranked by lifespan. d Colormaps of membrane damage computed from the PI rate of change, with individual cells ranked by lifespan. Solid black line indicates time of death. e Cumulative risk of death as a function of age shows an exponential regime. Cumulative risk of death is defined as negative natural logarithm of survivorship and is equal to the integral of the hazard function. The blue region corresponds to 95% confidence intervals. Death conditions are as previously defined. f Cellular damage fluctuates around a rising trajectory, subsampled to 7h time windows. Trajectories are colored according to their time of death (red: after 84 h; yellow: between 77 h and 84 h; yellow-green: between 70 h and 77 h; green, cyan … etc.). Circles indicate the last time window before death. Data shown here are the same as those in (d). PI uptake rate is normalized so that the initial timepoints start close to 1 (see Methods). g PI uptake rate distributions and best-fit to a type-2 generalized beta distribution with the ratio between shape parameters p/(p + q), plotted versus age in (h), see Methods. Source data of (ch) are provided in the Source Data file.
Fig. 2
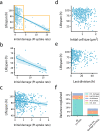
Fig. 2. Initial conditions do not account for most of the variations in lifespan.
a Initial damage levels (PI uptake rate) and lifespan of all cells in the experiment. Yellow boxes indicate groups of cells with high and low initial damage, each shown separately in (b, c). b For cells with high initial damage (PI uptake rate >4, n = 17 cells), initial damage correlates with lifespan. c For cells with low initial damage (<4, n = 503 cells), the correlation between initial damage and lifespan is weak. d Initial cell size and lifespan of all cells in the experiment. e Time of last division and lifespan for all cells in the experiment. f Fraction of lifespan variation explained by initial conditions according to multiple regression. Left are all cells, right are cells with low (<4) initial damage. Blue lines and shaded regions in panels (ac) represent linear regression lines and associated 95% confidence intervals respectively. Source data are provided as a Source Data file.
Fig. 3
Fig. 3. Damage dynamics show increasing determinism with age.
Statistics of E. coli membrane damage for all cells alive at a given age (n = 635 cells): Mean (a) and standard deviation (b) increase with age; but coefficient of variation (c) decreases, indicating reduced relative heterogeneity in the damage distribution. d Skewness drops with age. e Autocorrelation of damage (Δt = 7 h) increases with age, showing increasing persistence. All error bars indicate means +/− standard errors estimated from bootstrapping. f Probability distribution of damage in younger (52.5 h blue dashed line) versus older (72.5 h yellow solid line) cells. g Log PI uptake rate as a function of remaining lifespan becomes less variable close to death. Source data are in the Source Data file.
Fig. 4
Fig. 4. The saturating-removal model captures damage dynamics.
a Schematic of the MP-SR model. b Rate plot showing linearly increasing production with age and a removal rate that saturates with damage, causing the fixed point to accelerate to high damage levels. c The potential function of the MP-SR model and its evolution with age. Simulations of the MP-SR model for PI uptake rate (eX) show rising mean (d) and standard deviation (e), reducing CV (f) and reducing skewness (g). The model provides a death hazard that rises exponentially with age (h) and a Weibull-like survival function (i). Blue lines and regions represent the means and 95% confidence intervals respectively from subsampling n = 6200 simulated cells. Source data (both simulated trajectories and statistics) are provided in the Source Data file.
Fig. 5
Fig. 5. Damage dynamics in a strain that has reduced stress response (ΔrpoS) agree with model predictions.
a Colormaps of normalized fluorescence time-series of ΔrpoS cells (in the same style as Fig. 1c), with individuals ranked by lifespan. b Colormaps of estimated PI uptake rates of ΔrpoS cells ranked by lifespan. c Cumulative hazard shows increased Gompertz slope. d Survivorship shows reduced lifespan (inset), and survivorship versus normalized age shows a mildly shallower survival curve. Solid lines and color bands in panels (c, d) indicate means and 95% confidence intervals respectively. Measured damage statistics (n = 141 cells) include (e) CV (f) mean, (g) SD and (h) skewness. Analytical results of MP-SR model with increased η show similar dynamics for the (i) CV, (j) mean, (k) SD and (l) Skewness. Error bars in panels (eh) indicate means +/− standard errors estimated from bootstrapping. Source data of (ah) are provided in the Source Data file.

References

    1. Kirkwood TBL, et al. What accounts for the wide variation in life span of genetically identical organisms reared in a constant environment? Mech. Ageing Dev. 2005;126:439–443. doi: 10.1016/j.mad.2004.09.008. - DOI - PubMed
    1. Finch, C. E. et al. Chance, Development, and Aging. (Oxford University Press, 2000).
    1. Rea SL, Wu D, Cypser JR, Vaupel JW, Johnson TE. A stress-sensitive reporter predicts longevity in isogenic populations of Caenorhabditis elegans. Nat. Genet. 2005;37:894–898. doi: 10.1038/ng1608. - DOI - PMC - PubMed
    1. Yang Y, et al. Temporal scaling of aging as an adaptive strategy of Escherichia coli. Sci. Adv. 2019;5:eaaw2069. doi: 10.1126/sciadv.aaw2069. - DOI - PMC - PubMed
    1. Stroustrup N, et al. The temporal scaling of Caenorhabditis elegans ageing. Nature. 2016;530:103–107. doi: 10.1038/nature16550. - DOI - PMC - PubMed

Publication types