. 2023 Apr 18;13(1):6296.
doi: 10.1038/s41598-023-33591-4.

Systemic effects of oral tolerance in bone healing

Affiliations

Systemic effects of oral tolerance in bone healing

Bruno Henrique Costa et al. Sci Rep. .

Abstract

Bone fractures cause acute inflammation that, despite being important for initial repair, may delay the healing of the damaged bone. Parenteral injection of dietary protein has been shown to decrease inflammation and accelerate the repair of skin wounds and other inflammatory pathologies. Thus, our aim was to evaluate whether the intraperitoneal (i.p.) immunization with zein, an abundant protein in rodent chow, would favor bone healing. Wistar rats received i.p. immunization: saline (SG), adjuvant (AG) and zein associated with adjuvant (ZG). Then, a 2 mm of defect bone was performed on the right tibia, and on days 7, 14, 28 and 45 thereafter, analyses were performed. The results showed that the injection of zein reduced inflammation without impairing bone mineralization. Moreover, biomechanical tests demonstrated higher levels of maximum force (N) in ZG, indicating better mechanical resistance in relation to the others. The computerized tomography also indicated lower levels of medullary content in the ZG than in the SG, suggesting the absence of trabeculae in the medullary region in the ZG. These findings suggest that the injection of zein in previously tolerated animals may improve bone repair, leading to mechanically functional bone formation.


Conflict of interest statement

The authors declare no competing interests.

Figures

Figure 1
Figure 1
Experimental summary. Rats were fed a zein-enriched diet. At twelve weeks of age, each rat underwent surgery to create a circular bone defect of 2 mm in diameter in the proximal middle third of the right tibia. Around 5 min before surgery, an intraperitoneal injection containing either saline, Al(OH)3 adjuvant, or zein protein with Al(OH)3 was applied for immunization. The animals were euthanized at the indicated experimental dates. After 7, 14 and 28 days after surgery, the bones underwent histological analysis. After 28 and 45 days, the defective bones were evaluated by mineral densitometry, digital computed tomography and biomechanical testing.
Figure 2
Figure 2
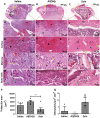
Representative H&E staining images showing the defect region in the rat tibia 7 days post-surgery. (AC) Cross-sections of the defect region in the tibia of the studied groups (scale bar = 500 μm, n = 6). (DF) Magnification of the defect area (scale bar = 100 μm, n = 6). (GI) Cortical defect bone region demonstrating the area of erythrocytes infiltrated with an asterisk (*) and new bone (nb) formation in the Zein group (scale bar = 50 μm, n = 6). (JL) The medullary region is delimited by the square with the presence of connective tissue (ct) and trabecular bone (tb), especially in the Zein group (scale bar = 50 μm, n = 6). Red arrows indicate red blood cells, blue arrows indicate osteocytes, yellow arrows indicate osteoblasts, and black arrows indicate the nuclei of various cells immersed in connective tissue. (MO) Corresponding to the maturation stages of bone cells. Gray arrows indicate osteoblasts, white arrows indicate osteoblasts in transition to osteocytes and green arrows indicate mature osteocytes. (P) Corresponding quantification of the trabecular bone (tb) area in the medullary region. (Q) Corresponding quantification of the osteocytes in the cortical region of the defect. Data represent the mean ± SEM, n.d. for not detected, with **p ≤ 0.01 and ***p ≤ 0.001 for statistical analysis performed between the experimental groups, n = 6.
Figure 3
Figure 3
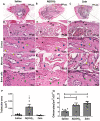
Representative H&E staining images showing the defect region in the rat tibia 14 days post-surgery. (AC) Cross-sections of the defect region in the tibia of the studied groups (scale bar = 500 μm, n = 6). (DF) The magnification of the defect region is demonstrated by an asterisk (*) and the delimitation of the periosteum by the red dotted line (scale bar = 100 μm, n = 6). (GI) Cortical defect bone region demonstrating new bone (nb) formation (scale bar = 50 μm, n = 6). (JL) The medullary region was delimited by the square with the presence of trabecular bone (tb) (scale bar = 50 μm, n = 6). Blue arrows indicate osteocytes, and yellow arrows indicate osteoblasts. (MO) Corresponding to the stages of bone cell maturation. Gray arrows indicate osteoblasts, white arrows indicate osteoblasts in transition to osteocytes and green arrows indicate mature osteocytes. (P) Corresponding quantification of the trabecular bone (tb) area in the medullary region. (Q) Corresponding quantification of the osteocytes in the cortical region of the defect. Data represent the mean ± SEM, with **p ≤ 0.01 and ***p ≤ 0.001 for statistical analysis performed between the experimental groups, n = 6.
Figure 4
Figure 4
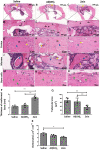
Representative H&E images showing the defect region in the rat tibia 28 days after surgery. (AC) Cross-sections of the defect region in the tibia of the studied groups (scale bar = 500 μm, n = 6). (DF) The magnification of the defect region is demonstrated by an asterisk (*) and the delimitation of the periosteum by the red dotted line (scale bar = 100 μm, n = 6). (GI) Bone region of the cortical defect with the well-delimited presence of osteocytes in the cortical zone and the presence of new bone (nb) and secondary bone (sb) (scale bar = 50 μm, n = 6). (JL) The medullary region is bounded by the square with the presence of osteocytes, osteoblasts and trabecular bone (tb) (scale bar = 50 μm, n = 6). Blue arrows indicate osteocytes, and yellow arrows indicate osteoblasts. (MO) Corresponding to the stages of maturation of bone cells, gray arrows indicate osteoblasts, white arrows indicate osteoblasts in transition to osteocytes and green arrows indicate mature osteocytes. (P) Corresponding to the thickness of the neoformed bone. (Q) Corresponding quantification of the trabecular bone (tb) area in the medullary region. (R) Corresponding quantification of the osteocytes in the cortical region of the defect. Data represent the mean ± SEM, with **p ≤ 0.01 and ***p ≤ 0.001 for statistical analysis performed between the experimental groups, n = 6.
Figure 5
Figure 5
Graphical representations obtained from the BMD and shear tests (A) Tibia BMD 28 days after defect. Overall mean of tibia weight: 0.12 g, SD ± 0.01 and tibia BMD 45 days after defect. Overall mean of weight: 0.13 g, SD ± 0.02. (B) Graphical representation of the biomechanical parameter maximum force (N). (C) Graphical representation of the biomechanical parameter deformation (mm). (D) Graphical representation of the biomechanical parameter relative rigidity (N/mm). Data represent the mean ± SEM, with *p ≤ 0.05 and **p ≤ 0.01 for statistical analysis performed between the experimental groups, n = 8.
Figure 6
Figure 6
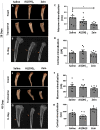
Representative images were obtained by digital computed tomography of the tibia of Wistar rats 28 and 45 days after the surgery. (A) Three-dimensional reconstruction of tibiae from 28 days in frontal and transversal views, demonstrating the cortical and medullary region of the bone defect. (B) X-ray image obtained by CT scan 28 days post defect, red arrows indicate injured regions. (C) Quantitative representation of mineral content levels in the medullary region 28 days post defect. (D) Quantitative representation of mineral content levels in the cortical region 28 days post-defect. (E) Three-dimensional reconstruction of tibiae from 45 days in frontal and transversal views, demonstrating the cortical and medullary region of the bone defect. (F) X-ray image obtained by CT scan 45 days post-defect, red arrows indicate injured regions. (G) Quantitative representation of mineral content levels in the medullary region 45 days post-defect. (H) Quantitative representation of mineral content levels in the cortical region 45 days post-defect. Data represent the mean ± SEM, with *p ≤ 0.05 for statistical analysis performed between the experimental groups, n = 8.

Similar articles

Cited by

References

    1. WHO. Life Expectancy at Birth (Years). https://www.who.int/data/gho/data/indicators/indicator-details/GHO/life-.... Accessed 14 Jul 2022.
    1. Kanis JA, et al. SCOPE 2021: A new scorecard for osteoporosis in Europe. Arch. Osteoporos. 2021;16:82. doi: 10.1007/s11657-020-00871-9. - DOI - PMC - PubMed
    1. Einhorn TA, Gerstenfeld LC. Fracture healing: Mechanisms and interventions. Nat. Rev. Rheumatol. 2015;11:45–54. doi: 10.1038/nrrheum.2014.164. - DOI - PMC - PubMed
    1. Mountziaris PM, Mikos AG. Modulation of the inflammatory response for enhanced bone tissue regeneration. Tissue Eng. B. 2018;14:179–186. doi: 10.1089/ten.teb.2008.0038. - DOI - PMC - PubMed
    1. Schell H, et al. The haematoma and its role in bone healing. J. Exp. Orthop. 2017;4:5. doi: 10.1186/s40634-017-0079-3. - DOI - PMC - PubMed

Publication types