

Integrative analysis of TP53 mutations in lung adenocarcinoma for immunotherapies and prognosis
- PMID: 37072703
- PMCID: PMC10114340
- DOI: 10.1186/s12859-023-05268-2
Integrative analysis of TP53 mutations in lung adenocarcinoma for immunotherapies and prognosis
Abstract
Background: The TP53 tumor suppressor gene is one of the most mutated genes in lung adenocarcinoma (LUAD) and plays a vital role in regulating the occurrence and progression of cancer. We aimed to elucidate the association between TP53 mutations, response to immunotherapies and the prognosis of LUAD.
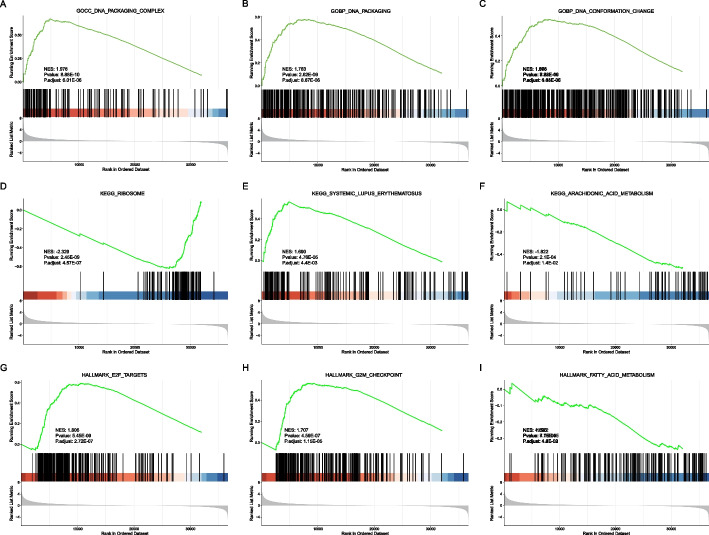
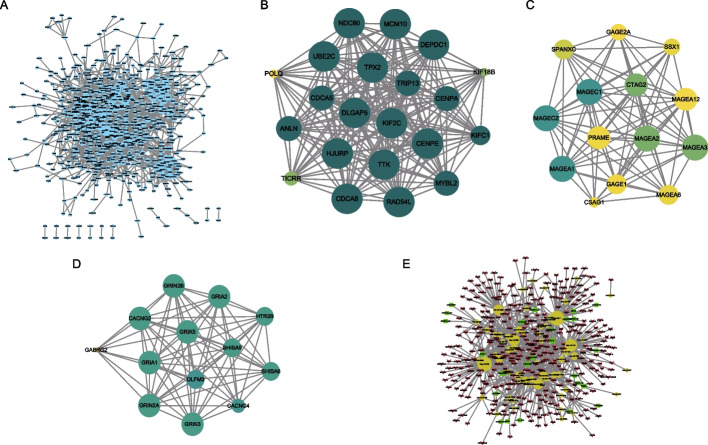
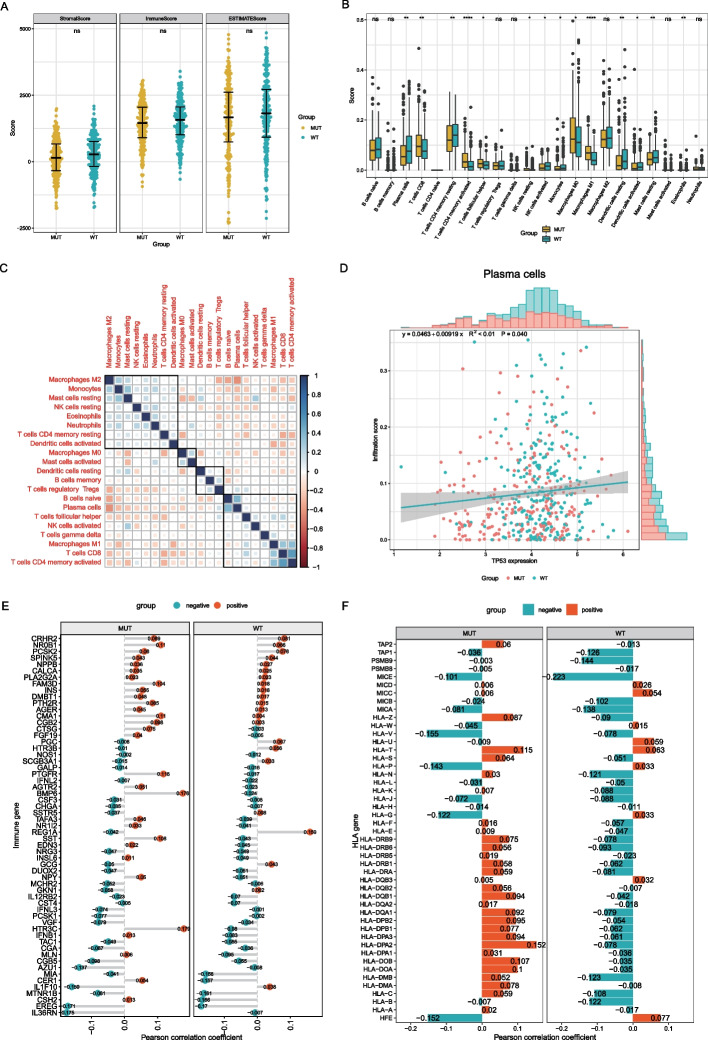
Methods: Genomic, transcriptomic, and clinical data of LUAD were downloaded from The Cancer Genome Atlas (TCGA) dataset. Gene ontology (GO) analysis, Kyoto Encyclopedia of Genes and Genomes (KEGG) enrichment analysis, gene set enrichment analysis (GSEA). Gene set variation analysis (GSVA) were performed to determine the differences in biological pathways. A merged protein-protein interaction (PPI) network was constructed and analyzed. MSIpred was used to analyze the correlation between the expression of the TP53 gene, tumor mutation burden (TMB) and tumor microsatellite instability (MSI). CIBERSORT was used to calculate the abundance of immune cells. Univariate and multivariate Cox regression analyses were used to determine the prognostic value of TP53 mutations in LUAD.
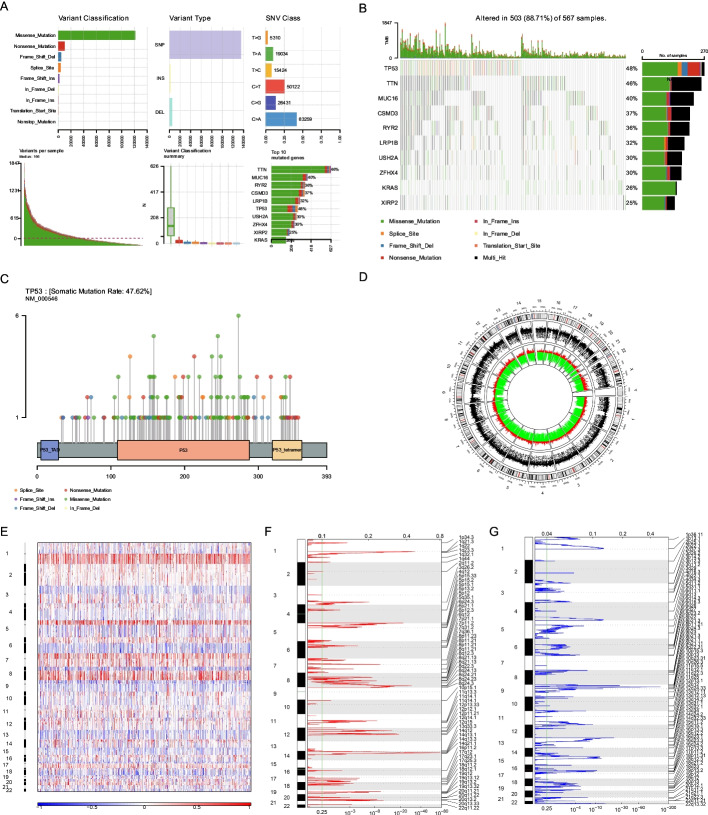
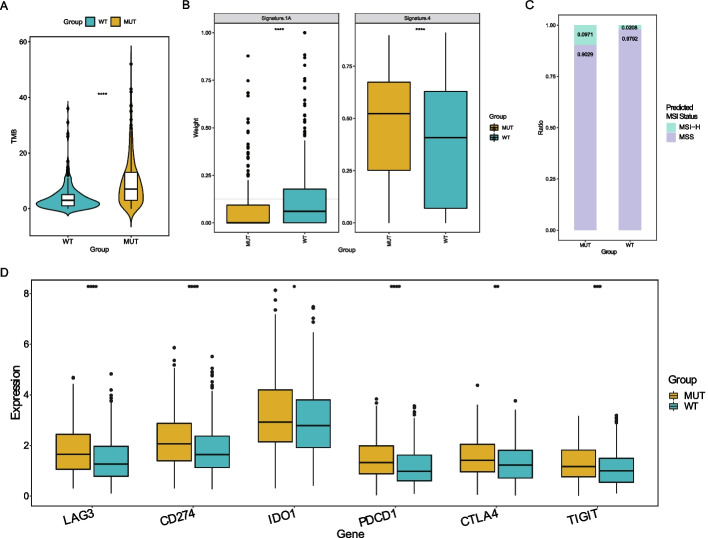
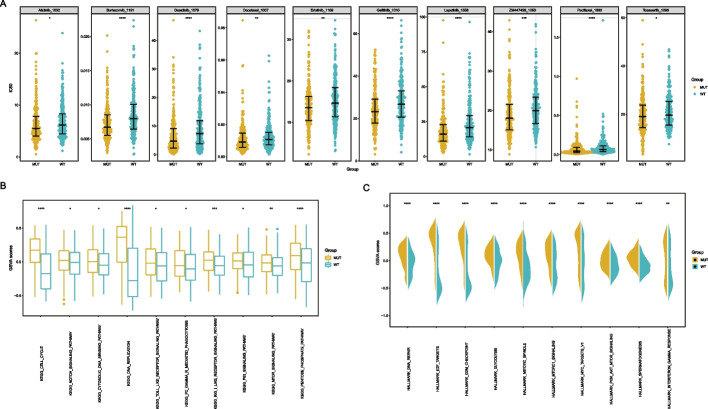
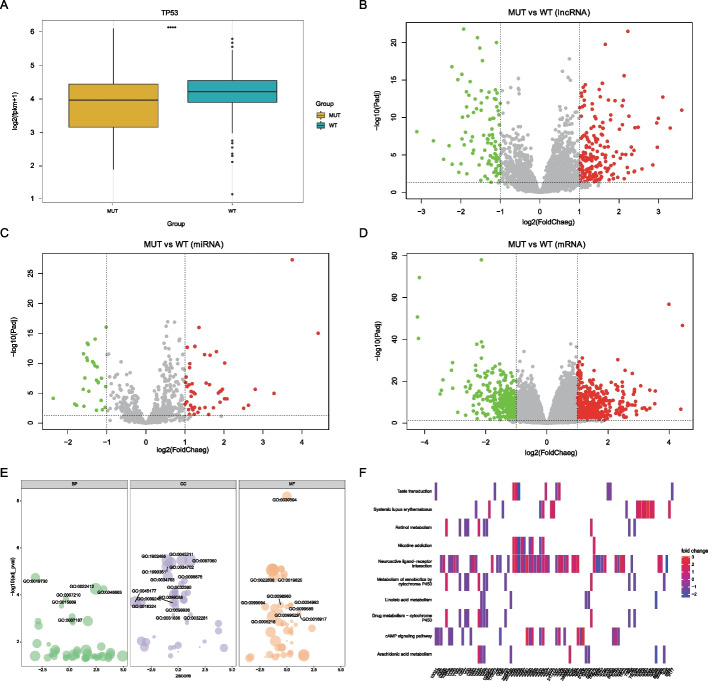
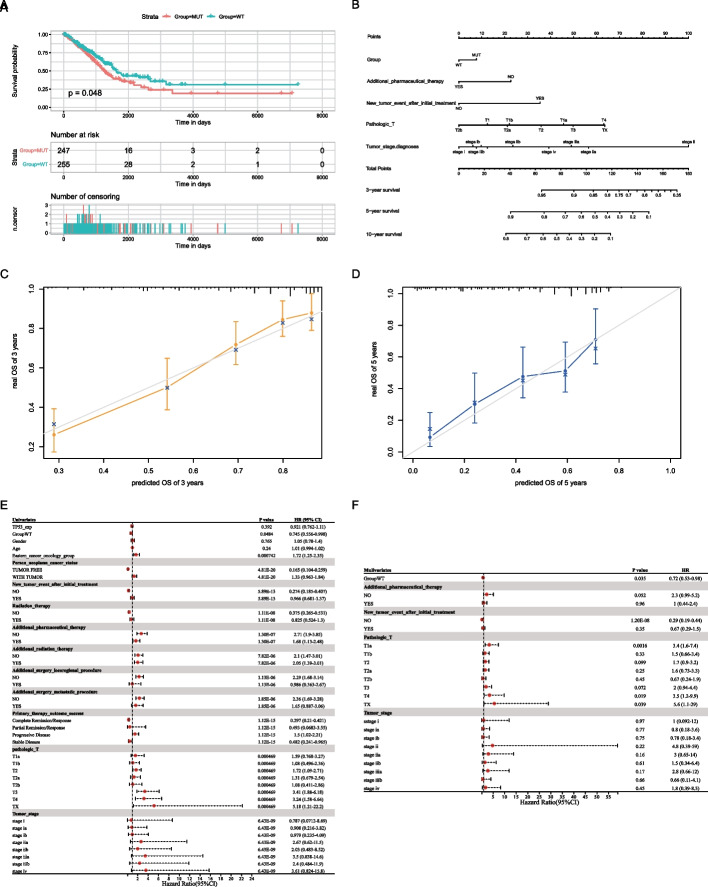
Results: TP53 was the most frequently mutated in LUAD, with a mutational frequency of 48%. GO and KEGG enrichment analysis, GSEA, and GSVA results showed a significant upregulation of several signaling pathways, including PI3K-AKT mTOR (P < 0.05), Notch (P < 0.05), E2F target (NES = 1.8, P < 0.05), and G2M checkpoint (NES = 1.7, P < 0.05). Moreover, we found a significant correlation between T cells, plasma cells, and TP53 mutations (R2 < 0.01, P = 0.040). Univariate and multivariate Cox regression analyses revealed that the survival prognosis of LUAD patients was related to TP53 mutations (Hazard Ratio (HR) = 0.72 [95% CI, 0.53 to 0.98], P < 0.05), cancer status (P < 0.05), and treatment outcomes (P < 0.05). Lastly, the Cox regression models showed that TP53 exhibited good power in predicting three- and five-year survival rates.
Conclusions: TP53 may be an independent predictor of response to immunotherapy in LUAD, and patients with TP53 mutations have higher immunogenicity and immune cell infiltration.
Keywords: Immune checkpoint; Lung adenocarcinoma; Signaling pathways; TP53; Tumor microenvironment.
© 2023. The Author(s).
Conflict of interest statement
The authors declare that they have no competing interests.
Figures
Similar articles
-
Specific TP53 subtype as biomarker for immune checkpoint inhibitors in lung adenocarcinoma.EBioMedicine. 2020 Oct;60:102990. doi: 10.1016/j.ebiom.2020.102990. Epub 2020 Sep 11. EBioMedicine. 2020. PMID: 32927274 Free PMC article.
-
Immune landscape and a promising immune prognostic model associated with TP53 in early-stage lung adenocarcinoma.Cancer Med. 2021 Feb;10(3):806-823. doi: 10.1002/cam4.3655. Epub 2020 Dec 12. Cancer Med. 2021. PMID: 33314730 Free PMC article.
-
Differences in genetics and microenvironment of lung adenocarcinoma patients with or without TP53 mutation.BMC Pulm Med. 2021 Oct 11;21(1):316. doi: 10.1186/s12890-021-01671-8. BMC Pulm Med. 2021. PMID: 34635074 Free PMC article.
-
TP53 to mediate immune escape in tumor microenvironment: an overview of the research progress.Mol Biol Rep. 2024 Jan 25;51(1):205. doi: 10.1007/s11033-023-09097-7. Mol Biol Rep. 2024. PMID: 38270700 Free PMC article. Review.
-
Immune Resistance in Lung Adenocarcinoma.Cancers (Basel). 2021 Jan 21;13(3):384. doi: 10.3390/cancers13030384. Cancers (Basel). 2021. PMID: 33494181 Free PMC article. Review.
Cited by
-
Effects of Tp53 Gene Mutations on the Survival of Non-Small Cell Lung Cancer (NSCLC); A Short Review.Cancer Manag Res. 2025 Jan 15;17:65-82. doi: 10.2147/CMAR.S495006. eCollection 2025. Cancer Manag Res. 2025. PMID: 39830995 Free PMC article. Review.
-
A Pilot Study: Contrasting Genomic Profiles of Lung Adenocarcinoma Between Patients of European and Latin American Ancestry.Int J Mol Sci. 2025 May 19;26(10):4865. doi: 10.3390/ijms26104865. Int J Mol Sci. 2025. PMID: 40430005 Free PMC article.
-
Comprehensive Survey of AACR GENIE Database of Tumor Mutation Burden (TMB) Among All Three Classes (I, II, III) of BRAF Mutated (BRAF+) NSCLC.Lung Cancer (Auckl). 2025 Feb 19;16:1-9. doi: 10.2147/LCTT.S493835. eCollection 2025. Lung Cancer (Auckl). 2025. PMID: 39995769 Free PMC article.
-
The prognostic significance and Immunomodulatory role of SCGB3A1 expression in stage I lung adenocarcinoma.BMC Med Genomics. 2025 Jul 21;18(1):119. doi: 10.1186/s12920-025-02192-7. BMC Med Genomics. 2025. PMID: 40691840 Free PMC article.
-
PNI as a predictive biomarker: a novel nomogram of immunotherapy efficacy in advanced breast cancer.Front Oncol. 2025 Aug 15;15:1534545. doi: 10.3389/fonc.2025.1534545. eCollection 2025. Front Oncol. 2025. PMID: 40896424 Free PMC article.
References
MeSH terms
Substances
Grants and funding
LinkOut - more resources
Full Text Sources
Medical
Research Materials
Miscellaneous
