. 2023 Apr 18;24(1):79.
doi: 10.1186/s13059-023-02915-y.

The ENCODE Imputation Challenge: a critical assessment of methods for cross-cell type imputation of epigenomic profiles

Affiliations

The ENCODE Imputation Challenge: a critical assessment of methods for cross-cell type imputation of epigenomic profiles

Jacob Matthew Schreiber et al. Genome Biol. .

Erratum in

  • Publisher Correction: The ENCODE Imputation Challenge: a critical assessment of methods for cross-cell type imputation of epigenomic profiles.
    Schreiber JM, Boix CA, Wook Lee J, Li H, Guan Y, Chang CC, Chang JC, Hawkins-Hooker A, Schölkopf B, Schweikert G, Carulla MR, Canakoglu A, Guzzo F, Nanni L, Masseroli M, Carman MJ, Pinoli P, Hong C, Yip KY, Spence JP, Batra SS, Song YS, Mahony S, Zhang Z, Tan W, Shen Y, Sun Y, Shi M, Adrian J, Sandstrom RS, Farrell NP, Halow JM, Lee K, Jiang L, Yang X, Epstein CB, Strattan JS, Bernstein BE, Snyder MP, Kellis M, Noble WS, Kundaje AB; ENCODE Imputation Challenge Participants. Schreiber JM, et al. Genome Biol. 2025 Feb 13;26(1):31. doi: 10.1186/s13059-025-03494-w. Genome Biol. 2025. PMID: 39948633 Free PMC article. No abstract available.

Abstract

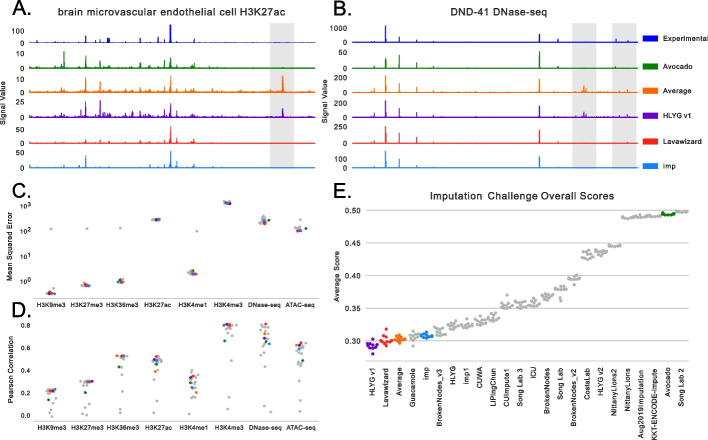
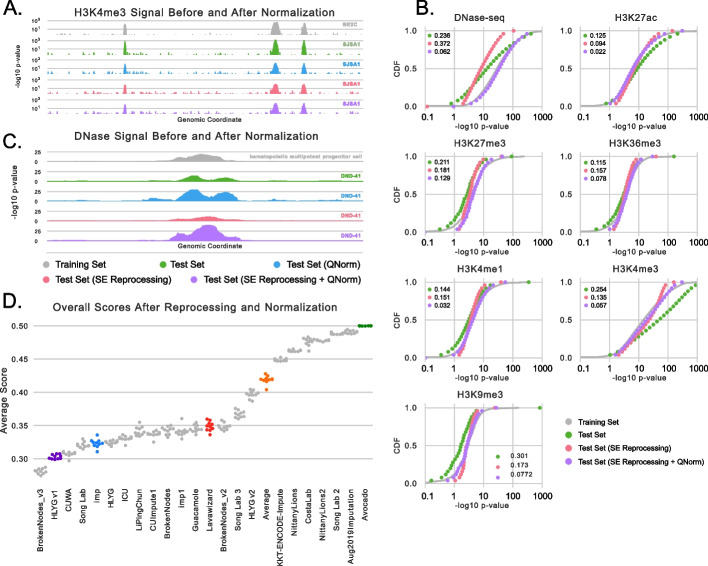
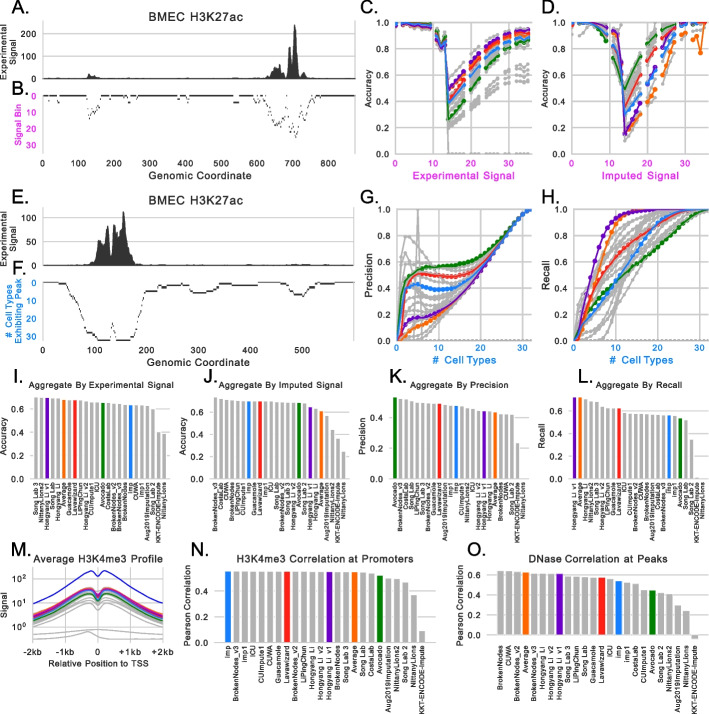
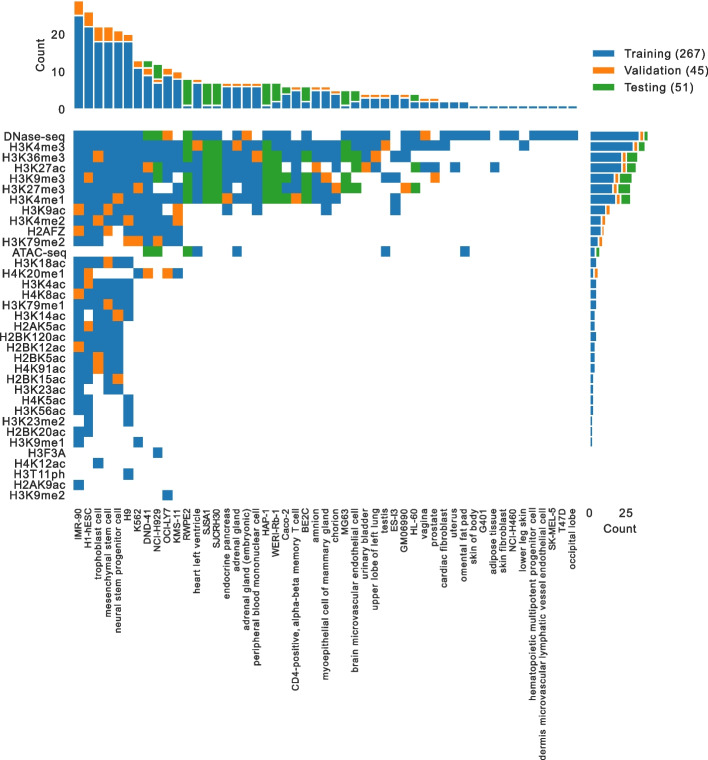
A promising alternative to comprehensively performing genomics experiments is to, instead, perform a subset of experiments and use computational methods to impute the remainder. However, identifying the best imputation methods and what measures meaningfully evaluate performance are open questions. We address these questions by comprehensively analyzing 23 methods from the ENCODE Imputation Challenge. We find that imputation evaluations are challenging and confounded by distributional shifts from differences in data collection and processing over time, the amount of available data, and redundancy among performance measures. Our analyses suggest simple steps for overcoming these issues and promising directions for more robust research.


Conflict of interest statement

A.K. is a scientific co-founder of Ravel Biotechnology Inc., is on the scientific advisory board of PatchBio Inc., SerImmune Inc., AINovo Inc., TensorBio Inc. and OpenTargets, is a consultant with Illumina Inc., and owns shares in DeepGenomics Inc., Immuni Inc., and Freenome Inc. M.S. is a cofounder and scientific advisor of Personalis, SensOmics, Qbio, January AI, Fodsel, Filtricine, Protos, RTHM, Iollo, Marble Therapeutics, and Mirvie. He is a scientific advisor of Genapsys, Jupiter, Neuvivo, Swaza, and Mitrix. The remaining authors declare no competing interests.

Figures

Fig. 1
Fig. 1
Results from the ENCODE Imputation Challenge. A The H3K27ac signal for brain microvascular endothelial cells that is observed (in blue), from baseline methods, and from the winning three teams in the challenge. B The same as A except for DNase-seq signal in DND-41 cells. C The average MSE for each method across test set tracks and bootstraps but partitioned by assay type. D The same as C except for Pearson correlation. E The overall score, calculated as described in the “Performance measures” section, across all test set tracks and performance measures shown for each bootstrap for each team. The baseline methods and winners are colored
Fig. 2
Fig. 2
Distributional shift and quantile normalization. A Experimental signal measuring H3K4me3 in BE2C cells from an unnormalized training set experiment (gray), an unnormalized test set experiment in SJSA1 cells (green), the test set signal after quantile normalization (blue), the test set signal after single-end reprocessing (red), and the test set signal after single-end reprocessing and quantile normalization (purple). B Distributions of signal values within peaks in chr16/17 for each reprocessed assay across the unnormalized training set (gray), the unnormalized test set (green), the single-end reprocessed test set (red), and the single-end reprocessed and quantile-normalized test set (purple). The KS statistics between the training set distribution and the test set distributions are shown in the legends and the CDFs are summarized using 25 dots for visualization purposes. C An example locus that exhibits a DNase peak in both the training and test sets. D A re-scoring of the challenge participants against single-end reprocessed and quantile-normalized test set signal
Fig. 3
Fig. 3
Additional performance measures. A Experimentally observed signal for H3K27ac in brain microvascular endothelial cells. B An example of partitioning the track from A into logarithmically spaced bins (the rows). C The accuracy between binarized imputations and MACS2 peak calls for each signal bin when using the experimental signal to define the bins. D The same as C except using the imputed signal to define the bins. E The same as A but a different locus. F The same as B except calculating bins using the number of cell types that each locus exhibits a peak in. G The precision of the binarized imputed signal against MACS2 peak calls when evaluated separately for each bin. H The same as G except the recall instead of the precision. I The average area under the curves, calculated as shown in C, across all test set tracks for each participant. J The average area under the curves calculated as shown in D across all test set tracks for each participant. K The precision score calculated in the same manner as I/J. L The same as K, except the recall score. M The average H3K4me3 profile of experimental (blue), quantile-normalized (magenta), and imputed signals at strand-corrected promoters. N The average Pearson correlation between imputed and quantile-normalized signal across all promoters and H3K4me3 test set tracks. O The average Pearson correlation between imputed and quantile-normalized signal across all observed DNase peaks and DNase test set tracks
Fig. 4
Fig. 4
The challenge data matrix. The matrix shows the experiments used in the challenge, colored based on whether they were in the training set (blue), the validation set (orange), or the blind test set (green). White squares indicate that an experiment has not yet been performed. The marginal bar plots show the number of experiments in each assay and cell type

References

    1. Roadmap Epigenomics Consortium, Kundaje A, Meuleman W, Ernst J, Bilenky M, Yen A, et al. Integrative analysis of 111 reference human epigenomes. Nature. 2015;518(7539):317–330. - PMC - PubMed
    1. ENCODE Project Consortium, Moore JE, Purcaro MJ, Pratt HE, Epstein CB, Shoresh N, et al. Expanded encyclopaedias of DNA elements in the human and mouse genomes. Nature. 2020;583(7818):699–710. - PMC - PubMed
    1. Stunnenberg HG, International Human Epigenome Consortium, Hirst M. The International Human Epigenome Consortium: a blueprint for scientific collaboration and discovery. Cell. 2016;167(5):1145–1149. - PubMed
    1. Ramilowski JA, Yip CW, Agrawal S, Chang JC, Ciani Y, Kulakovskiy IV, et al. Functional annotation of human long noncoding RNAs via molecular phenotyping. Genome Res. 2020;30(7):1060–72. - PMC - PubMed
    1. GTEx Consortium, Laboratory, Data Analysis &Coordinating Center (LDACC)—Analysis Working Group, Statistical Methods groups—Analysis Working Group, Enhancing GTEx (eGTEx) groups, NIH Common Fund, NIH/NCI, et al. Genetic effects on gene expression across human tissues. Nature. 2017;550(7675):204–213. - PMC - PubMed

Publication types

LinkOut - more resources