Preferential pruning of inhibitory synapses by microglia contributes to alteration of the balance between excitatory and inhibitory synapses in the hippocampus in temporal lobe epilepsy
- PMID: 37072932
- PMCID: PMC10493672
- DOI: 10.1111/cns.14224
Preferential pruning of inhibitory synapses by microglia contributes to alteration of the balance between excitatory and inhibitory synapses in the hippocampus in temporal lobe epilepsy
Abstract
Background: A consensus has formed that neural circuits in the brain underlie the pathogenesis of temporal lobe epilepsy (TLE). In particular, the synaptic excitation/inhibition balance (E/I balance) has been implicated in shifting towards elevated excitation during the development of TLE.
Methods: Sprague Dawley (SD) rats were intraperitoneally subjected to kainic acid (KA) to generate a model of TLE. Next, electroencephalography (EEG) recording was applied to verify the stability and detectability of spontaneous recurrent seizures (SRS) in rats. Moreover, hippocampal slices from rats and patients with mesial temporal lobe epilepsy (mTLE) were assessed using immunofluorescence to determine the alterations of excitatory and inhibitory synapses and microglial phagocytosis.
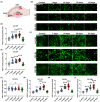
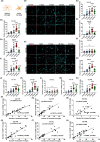
Results: We found that KA induced stable SRSs 14 days after status epilepticus (SE) onset. Furthermore, we discovered a continuous increase in excitatory synapses during epileptogenesis, where the total area of vesicular glutamate transporter 1 (vGluT1) rose considerably in the stratum radiatum (SR) of cornu ammonis 1 (CA1), the stratum lucidum (SL) of CA3, and the polymorphic layer (PML) of the dentate gyrus (DG). In contrast, inhibitory synapses decreased significantly, with the total area of glutamate decarboxylase 65 (GAD65) in the SL and PML diminishing enormously. Moreover, microglia conducted active synaptic phagocytosis after the formation of SRSs, especially in the SL and PML. Finally, microglia preferentially pruned inhibitory synapses during recurrent seizures in both rat and human hippocampal slices, which contributed to the synaptic alteration in hippocampal subregions.
Conclusions: Our findings elaborately characterize the alteration of neural circuits and demonstrate the selectivity of synaptic phagocytosis mediated by microglia in TLE, which could strengthen the comprehension of the pathogenesis of TLE and inspire potential therapeutic targets for epilepsy treatment.
Keywords: E/I balance; epilepsy; microglia; synapse; synaptic phagocytosis.
© 2023 The Authors. CNS Neuroscience & Therapeutics published by John Wiley & Sons Ltd.
Conflict of interest statement
The authors have no financial conflicts of interest.
Figures


Similar articles
-
Alterations of hippocampal GAbaergic system contribute to development of spontaneous recurrent seizures in the rat lithium-pilocarpine model of temporal lobe epilepsy.Hippocampus. 2001;11(4):452-68. doi: 10.1002/hipo.1060. Hippocampus. 2001. PMID: 11530850
-
A novel animal model of acquired human temporal lobe epilepsy based on the simultaneous administration of kainic acid and lorazepam.Epilepsia. 2017 Feb;58(2):222-230. doi: 10.1111/epi.13579. Epilepsia. 2017. PMID: 28157273
-
Status Epilepticus Dynamics Predicts Latency to Spontaneous Seizures in the Kainic Acid Model.Cell Physiol Biochem. 2020 May 16;54(3):493-507. doi: 10.33594/000000232. Cell Physiol Biochem. 2020. PMID: 32415763
-
Microglia modulate the structure and function of the hippocampus after early-life seizures.J Pharmacol Sci. 2020 Dec;144(4):212-217. doi: 10.1016/j.jphs.2020.09.003. Epub 2020 Sep 15. J Pharmacol Sci. 2020. PMID: 33070840 Review.
-
Selective degeneration and synaptic reorganization of hippocampal interneurons in a chronic model of temporal lobe epilepsy.Adv Neurol. 2006;97:69-76. Adv Neurol. 2006. PMID: 16383116 Review.
Cited by
-
Single-Cell Transcriptomic Analyses of Brain Parenchyma in Patients With New-Onset Refractory Status Epilepticus (NORSE).Neurol Neuroimmunol Neuroinflamm. 2024 Jul;11(4):e200259. doi: 10.1212/NXI.0000000000200259. Epub 2024 May 29. Neurol Neuroimmunol Neuroinflamm. 2024. PMID: 38810181 Free PMC article.
-
Bone marrow-derived myeloid cells transiently colonize the brain during postnatal development and interact with glutamatergic synapses.iScience. 2024 May 21;27(7):110037. doi: 10.1016/j.isci.2024.110037. eCollection 2024 Jul 19. iScience. 2024. PMID: 39021809 Free PMC article.
-
JC124 confers multimodal neuroprotection in epilepsy by suppressing NLRP3 inflammasome activation: evidence from animal and human neuronal models.Cell Commun Signal. 2025 Jul 8;23(1):327. doi: 10.1186/s12964-025-02239-3. Cell Commun Signal. 2025. PMID: 40629339 Free PMC article.
-
Lactate Ameliorates Kainic Acid-Induced Neuroinflammation and Cognitive Impairment via the Chemokine Signaling Pathway in Mice.J Inflamm Res. 2025 Jan 27;18:1235-1254. doi: 10.2147/JIR.S498738. eCollection 2025. J Inflamm Res. 2025. PMID: 39897526 Free PMC article.
-
Microglial phagocytosis in epilepsy: Mechanisms and impact.J Physiol. 2025 Jun 18:10.1113/JP288573. doi: 10.1113/JP288573. Online ahead of print. J Physiol. 2025. PMID: 40532092 Free PMC article. Review.
References
-
- Rao VR, Lowenstein DH. Epilepsy. Curr Biol. 2015;25(17):R742‐R746. - PubMed
-
- Thijs RD, Surges R, O'Brien TJ, Sander JW. Epilepsy in adults. The Lancet. 2019;393(10172):689‐701. - PubMed
-
- Aronica E, Mühlebner A. Neuropathology of epilepsy. Handb Clin Neurol. 2017;145:193‐216. - PubMed
-
- Gonzalez Otarula KA, Schuele S. Networks in temporal lobe epilepsy. Neurosurg Clin N Am. 2020;31(3):309‐317. - PubMed
Publication types
MeSH terms
Substances
LinkOut - more resources
Full Text Sources
Research Materials
Miscellaneous

