. 2023 Oct;29(10):2826-2842.
doi: 10.1111/cns.14219. Epub 2023 Apr 18.

Degradation of NLRP3 by p62-dependent-autophagy improves cognitive function in Alzheimer's disease by maintaining the phagocytic function of microglia

Affiliations

Degradation of NLRP3 by p62-dependent-autophagy improves cognitive function in Alzheimer's disease by maintaining the phagocytic function of microglia

Dongyuan Zhang et al. CNS Neurosci Ther. 2023 Oct.

Abstract

Background: Activation of the NLRP3 inflammasome promotes microglia to secrete inflammatory cytokines and induce pyroptosis, leading to impaired phagocytic and clearance functions of microglia in Alzheimer's disease (AD). This study found that the autophagy-associated protein p62 interacts with NLRP3, which is the rate-limiting protein of the NLRP3 inflammasome. Thus, we aimed to prove that the degradation of NLRP3 occurs through the autophagy-lysosome pathway (ALP) and also demonstrate its effects on the function of microglia and pathological changes in AD.

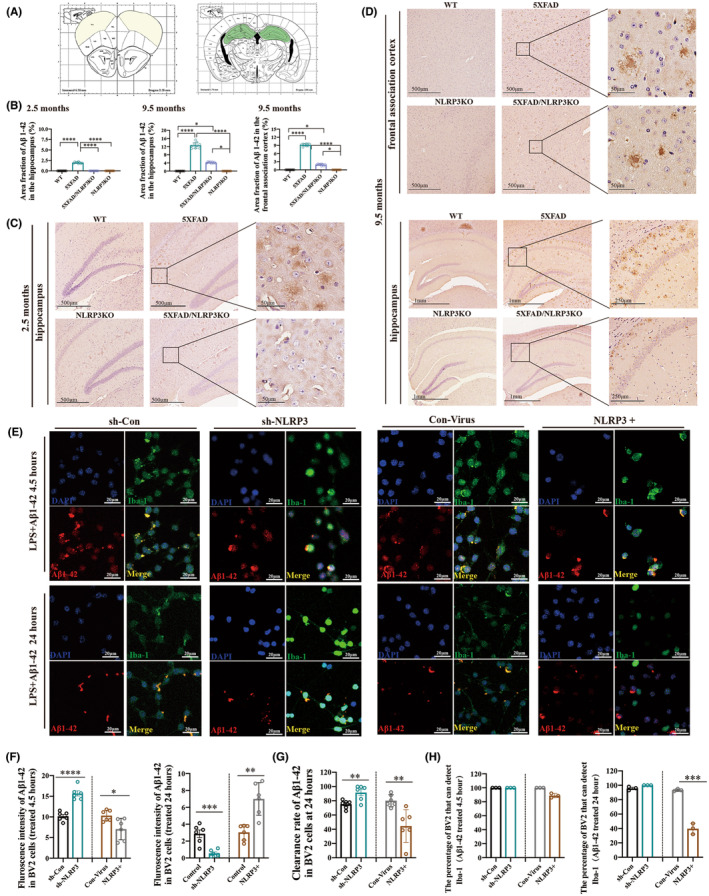
Methods: The 5XFAD/NLRP3-KO mouse model was established to study the effect of NLRP3 reduction on AD. Behavioral experiments were conducted to assess the cognitive function of the mice. In addition, immunohistochemistry was used to evaluate the deposition of Aβ plaques and morphological changes in microglia. BV2 cells treated with lipopolysaccharide (LPS) followed by Aβ1-42 oligomers were used as in vitro AD inflammation models and transfected with lentivirus to regulate the expression of the target protein. The pro-inflammatory status and function of BV2 cells were detected by flow cytometry and immunofluorescence (IF). Co-immunoprecipitation, mass spectrometry, IF, Western blot (WB), quantitative real-time PCR, and RNA-seq analysis were used to elucidate the mechanisms of molecular regulation.

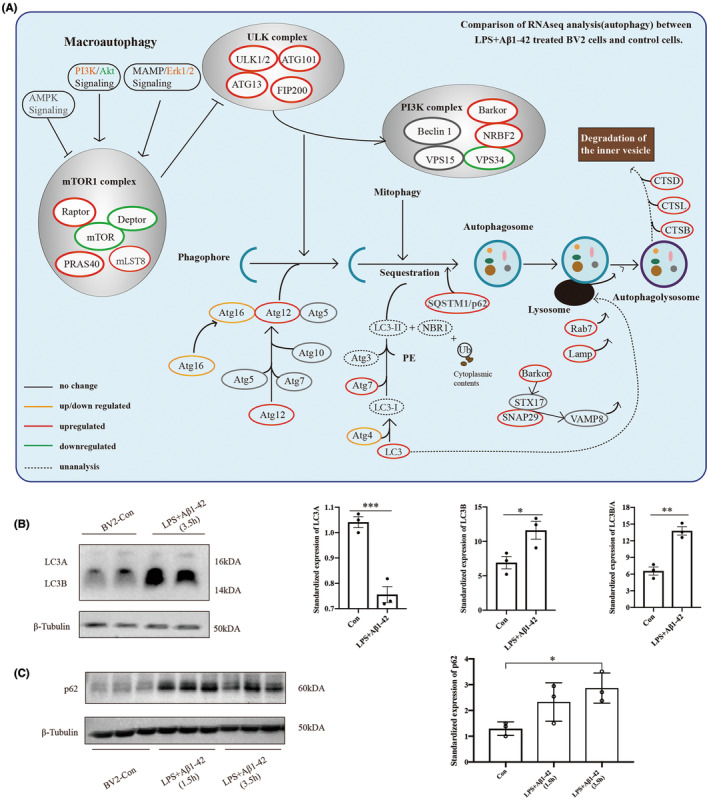
Results: Cognitive function was improved in the 5XFAD/NLRP3-KO mouse model by reducing the pro-inflammatory response of microglia and maintaining the phagocytic and clearance function of microglia to the deposited Aβ plaque. The pro-inflammatory function and pyroptosis of microglia were regulated by NLRP3 expression. Ubiquitinated NLRP3 can be recognized by p62 and degraded by ALP, slowing down the proinflammatory function and pyroptosis of microglia. The expression of autophagy pathway-related proteins such as LC3B/A, p62 was increased in the AD model in vitro.

Conclusions: P62 recognizes and binds to ubiquitin-modified NLRP3. It plays a vital role in regulating the inflammatory response by participating in ALP-associated NLRP3 protein degradation, which improves cognitive function in AD by reducing the pro-inflammatory status and pyroptosis of microglia, thus maintaining its phagocytic function.

Keywords: Alzheimer's disease; NLRP3 inflammasome; autophagy; pyroptosis; sqstm1/p62; ubiquitin.


Conflict of interest statement

The authors have no relevant financial or nonfinancial interests to disclose.

Figures

FIGURE 1
FIGURE 1
Restoration of cognitive function in 5XFAD/NLRP3‐KO mice. (A) Velocity, distance moved, frequency across the center zone (Zone C), not moving cumulative duration and cumulative duration in the center zone in the OFT. (B) Discrimination and preference indices during the test period in the NOR test. (C) The Morris water maze experimental facility. (D) Latency to the platform during the spatial training trials of MWM. (E) The swimming track in the probe trials of MWM. (F) Frequency across the platform and latency to cross the platform of MWM in the probe trials. (G) Spontaneous alternation in 9.5‐month‐old mice in the Y maze. *Represents statistical significance after comparing each group in D. # represents statistical significance after comparison between 5XFAD and 5XFAD/NLRP3KO group in D. All data are reported as mean ± SEM (n = 6, each group) for individual experiments. *p < 0.05, **p < 0.01, ***p < 0.001, ****p < 0.0001, #p < 0.05.
FIGURE 2
FIGURE 2
NLRP3 knockout reduces the deposition of Aβ plaques. (A) The location of the pathological section. (B) Area fraction of Aβ in the hippocampus and frontal association cortex. (C) Deposition of Aβ plaque in the hippocampus of 2.5‐month‐old mice. (D) Deposition of Aβ plaques in the hippocampus and frontal association cortex in 9.5‐month‐old mice. (E) Immunofluorescence results of BV2 cells under different treatment conditions. (F) Fluorescence intensity of Aβ1‐42 in BV2 cells treated with LPS (12 h) followed by Aβ1‐42 (4.5 h or 24 h). (G) The clearance rate of BV2 cells after treatment with LPS (12 h) followed by Aβ1‐42 (4.5 h or 24 h). (H) The percentage of BV2 cells which can detect Iba1 at different treatment conditions. Data are reported as the mean ± SEM. Three animals were selected randomly from each group, and three slices were selected from each animal (n = 9). 100 cells were selected in each group and repeated the experiment 3 times (n = 3). *p < 0.05, **p < 0.01, ***p < 0.001, ****p < 0.0001.
FIGURE 3
FIGURE 3
NLRP3 knockout reduces microglia pyroptosis. Microglia with different colored arrows in A–D represent different functional states. Microglia indicated by the green arrow have small soma and elongated synapses that are in the resting state. Microglia pointed by the yellow arrow, with an enlarged soma and short and thick synapses, are in an activated state. Microglia indicated by the red arrow are swollen with no clear nuclei, indicating pyroptosis. (A, B) Morphology of microglia in the hippocampus and frontal association cortex of 2.5‐month‐old mice. (C, D) Morphology of microglia in the hippocampus and frontal association cortex of 9.5‐month‐old mice. (E) Area fraction of Iba‐1 in C and D. (F) The proportion of microglia in a swollen state in C and D. (G–J) Flow cytometry was used to identify the pro‐inflammatory state of BV2 cells with different levels of NLRP3 expression under different drug treatments. Data are reported as the mean ± SEM. Three animals were selected randomly from each group, and three slices were selected from each animal (n = 9).100 microglia were collected from each slice. A total 105 cells were selected in each group and repeated the experiment 3 times of individual experiments in vitro. *p < 0.05, ***p < 0.001, ****p < 0.0001, #p < 0.05, ##p < 0.01, ####p < 0.0001. *Was used to indicate statistical significance when comparing within the group to the control (WT), while a # was used to indicate statistical significance when comparing between groups.
FIGURE 4
FIGURE 4
Co‐IP of NLRP3 complex in BV2 cells of an AD inflammation model and mass spectrometry protein analysis. (A) Localization of the NLRP3 co‐IP complex in the subcellular in the LPS + Aβ1‐42 treated BV2 group. (B) GO enrichment analysis of the proteins in A. (C) The KEGG pathway annotation of proteins in A. The resulting spectra from each fraction were searched separately against the Mus_musculus_uniprot_2019.01.18. fasta (85,188 sequences) database using the following search engine: Proteome Discoverer 2.2 (PD 2.2, Thermo).
FIGURE 5
FIGURE 5
P62 interacts with NLRP3 and regulates the polarization state of microglia. (A, B) Co‐immunoprecipitation was performed using exogenous and endogenous NLRP3 and p62. BV2 cells were infected with lentivirus over‐expressing HA‐NLRP and FLAG‐p62 and treated with LPS followed by Aβ1‐42 oligomers. (C) IF co‐localization of NLRP3 and p62 in LPS‐and Aβ1‐42‐treated BV2 cells. (D) WB was performed to detect the protein level of NLRP3 in BV2 cells with different levels of p62 expression. (E) Protein and mRNA expression levels in BV2 cells treated with 3MA, MG132, or DMSO, followed by treatment with LPS and Aβ1‐42 oligomers. (F, G) Flow cytometry was used to identify the pro‐inflammatory state of BV2 cells with different levels of p62 expression under different drug treatments. (H, I) The proportion of BV2 cells in a pro‐inflammatory status in Figure 3F,G. 105 Cells were selected in each group in Figure 3F,G. Data are reported as the mean ± SEM (n = 3) of individual experiments. * Was used to indicate statistical significance when comparing within the group to the control, while a # was used to indicate statistical significance when comparing between groups.*p < 0.05, ***p < 0.001, ****p < 0.0001, #p < 0.05, ####p < 0.0001.
FIGURE 6
FIGURE 6
RNA‐seq results supported the activation of p62‐related autophagy pathways in the AD inflammation in vitro model. (A) Differential gene expression analysis in BV2 cells treated with LPS followed by Aβ1‐42 and control groups. (B) The GO enrichment analysis of the differentially expressed genes is shown in A (the most significant 30 terms were selected to draw a scatter diagram for display, p adj < 0.05). BP: biological processes, CC: cellular components, MF: molecular functions. (C) The KEGG pathway analysis of differentially expressed genes (the most significant 20 terms were selected to draw a scatter diagram for display, p adj < 0.05) in A. (D) The percentage of target genes of the eight selected pathways. (E) Heatmaps of differentially expressed genes in the signaling pathways of D and the NOD‐like receptor signaling pathway(|logFC| > 1.5, p adj(q) < 0.01).
FIGURE 7
FIGURE 7
The autophagy pathway was activated in the in vitro AD models. (A) The mRNA expression levels of autophagy pathway‐related molecules according to RNA‐seq results in Figure 6E. (B, C) Protein levels related to the autophagy pathway in the AD model in vitro. Data are reported as the mean ± SEM (n = 3) of individual experiments. *p < 0.05, **p < 0.01, ***p < 0.001.

References

    1. Babcock KR, Page JS, Fallon JR, Webb AE. Adult hippocampal neurogenesis in aging and Alzheimer's disease. Stem Cell Reports. 2021;16:681‐693. doi:10.1016/j.stemcr.2021.01.019 - DOI - PMC - PubMed
    1. Casella G, Colombo F, Finardi A, et al. Extracellular vesicles containing IL‐4 modulate neuroinflammation in a mouse model of multiple sclerosis. Mol Ther. 2018;26:2107‐2118. doi:10.1016/j.ymthe.2018.06.024 - DOI - PMC - PubMed
    1. Pang S, Sun C, Gao S, Yang Y, Pan X, Zhang L. Evodiamine derivatives improve cognitive abilities in APP(swe)/PS1(ΔE9) transgenic mouse models of Alzheimer's disease. Animal Model Exp Med. 2020;3:193‐199. doi:10.1002/ame2.12126 - DOI - PMC - PubMed
    1. Leng F, Edison P. Neuroinflammation and microglial activation in Alzheimer disease: where do we go from here? Nat Rev Neurol. 2020;17:157‐172. doi:10.1038/s41582-020-00435-y - DOI - PubMed
    1. Heneka MT, Kummer MP, Stutz A, et al. NLRP3 is activated in Alzheimer's disease and contributes to pathology in APP/PS1 mice. Nature. 2013;493:674‐678. doi:10.1038/nature11729 - DOI - PMC - PubMed

Publication types

Substances