. 2023 Jun 7;31(6):1807-1828.
doi: 10.1016/j.ymthe.2023.04.007. Epub 2023 Apr 17.

MicroRNA-216a is essential for cardiac angiogenesis

Affiliations

MicroRNA-216a is essential for cardiac angiogenesis

Rio P Juni et al. Mol Ther. .

Abstract

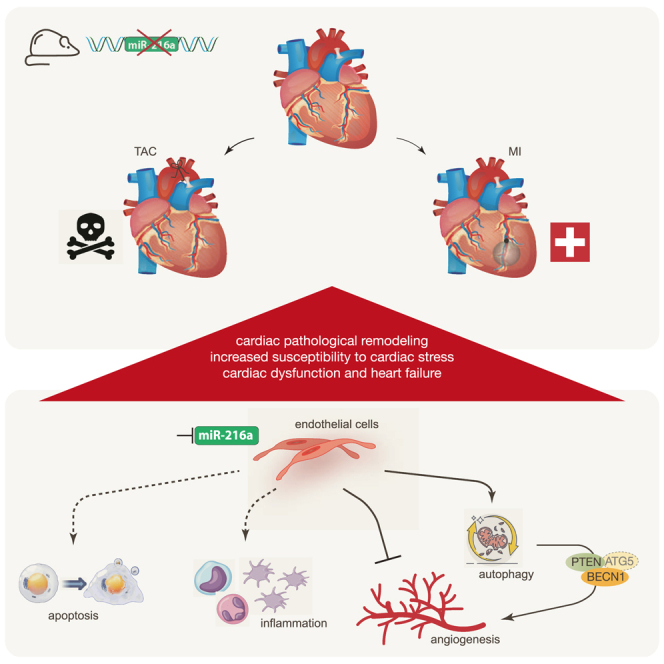
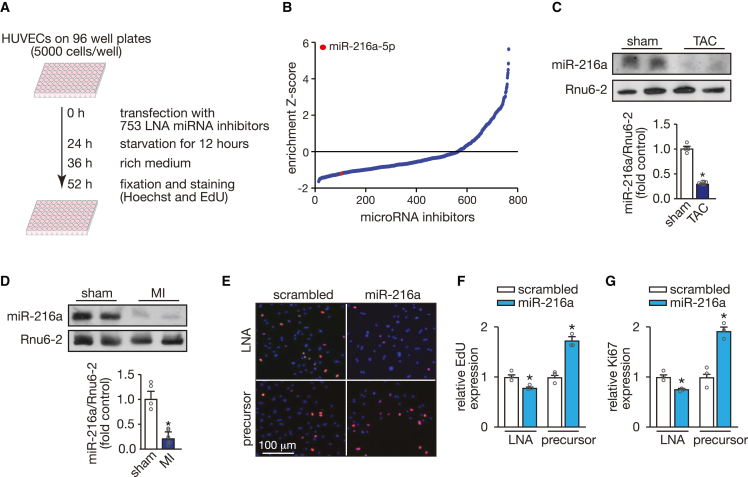
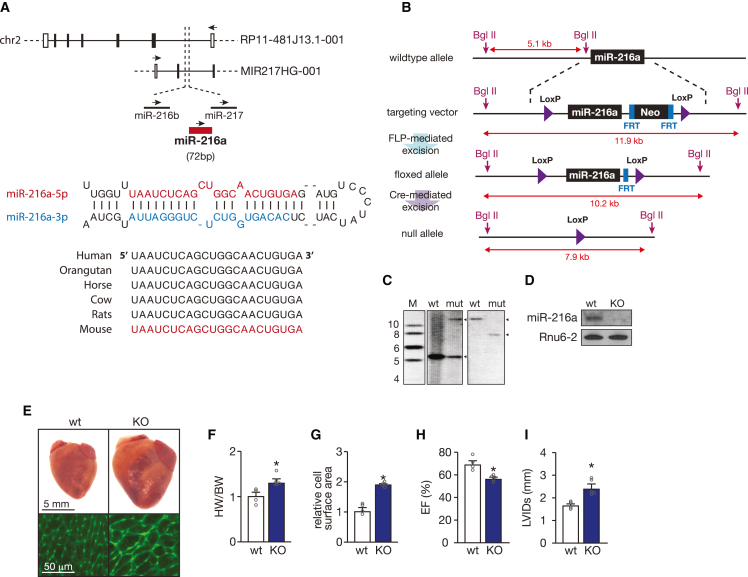
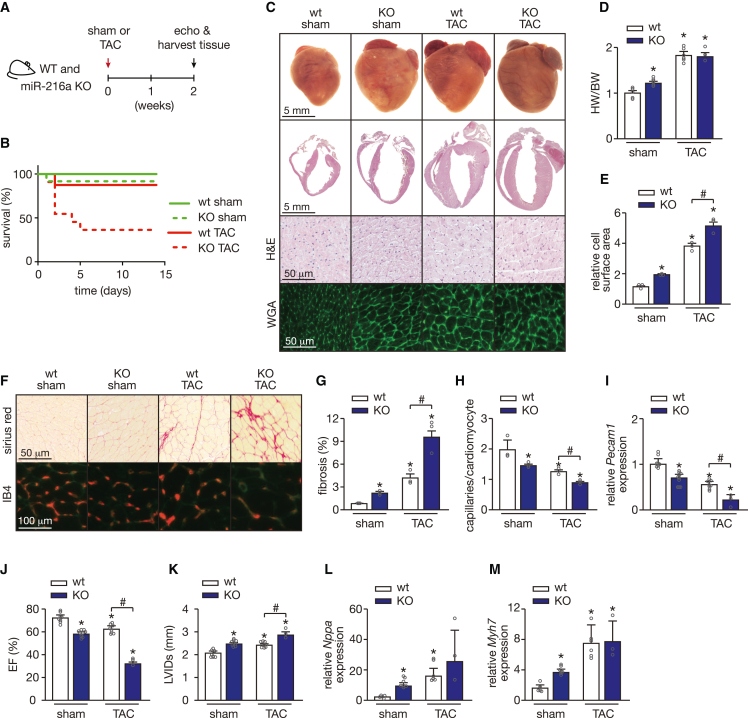
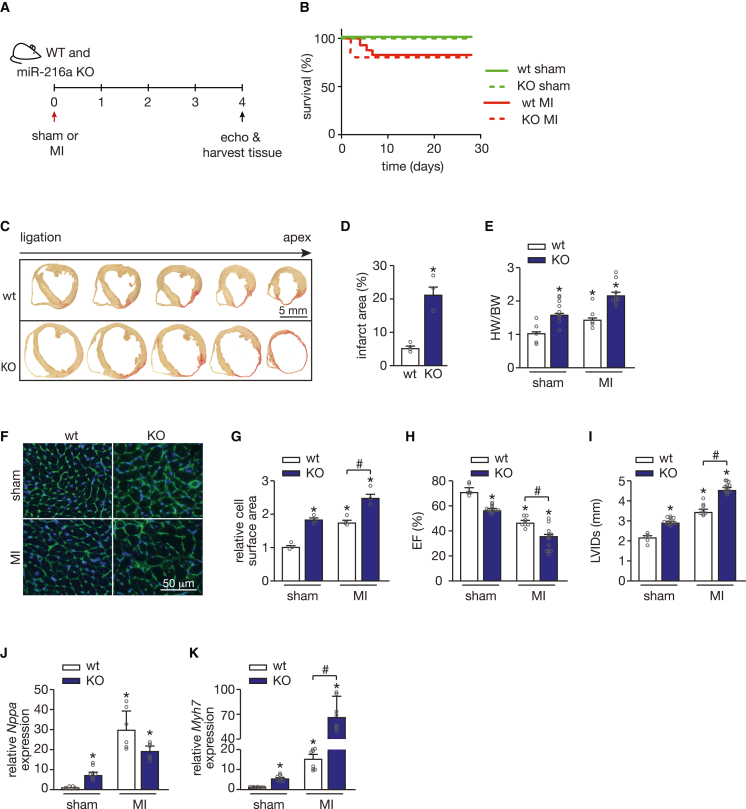
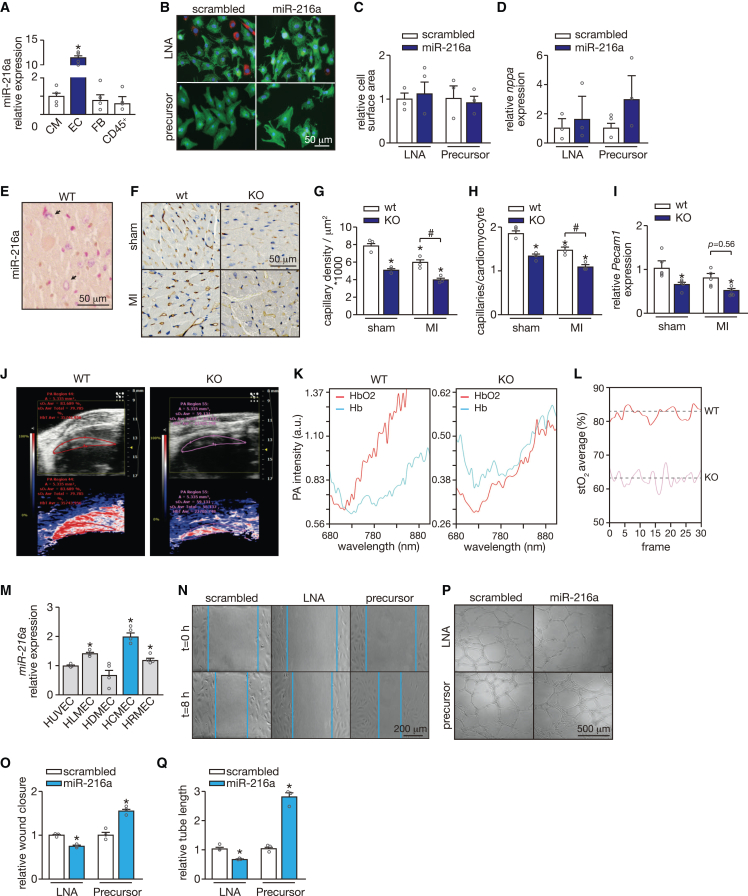
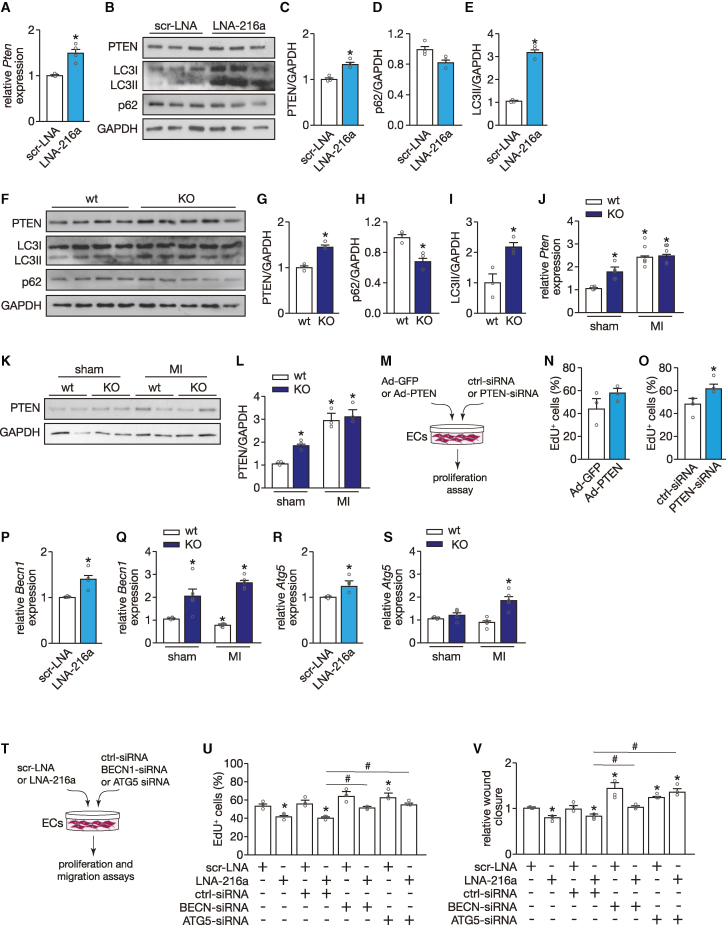
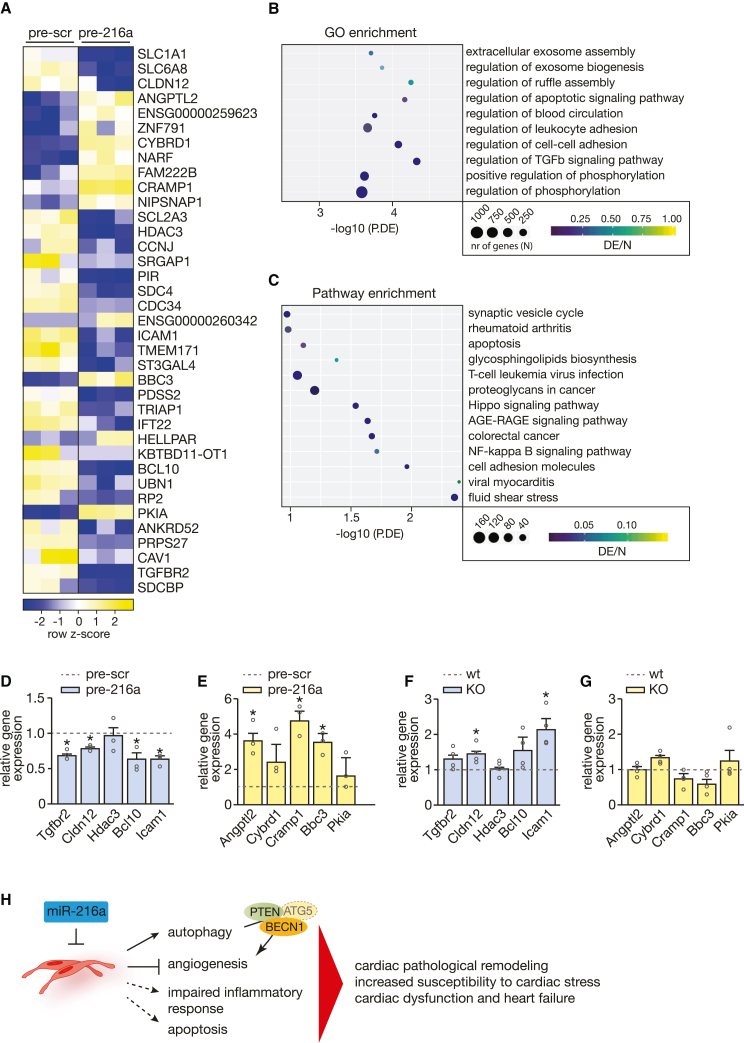
While it is experimentally supported that impaired myocardial vascularization contributes to a mismatch between myocardial oxygen demand and supply, a mechanistic basis for disruption of coordinated tissue growth and angiogenesis in heart failure remains poorly understood. Silencing strategies that impair microRNA biogenesis have firmly implicated microRNAs in the regulation of angiogenesis, and individual microRNAs prove to be crucial in developmental or tumor angiogenesis. A high-throughput functional screening for the analysis of a whole-genome microRNA silencing library with regard to their phenotypic effect on endothelial cell proliferation as a key parameter, revealed several anti- and pro-proliferative microRNAs. Among those was miR-216a, a pro-angiogenic microRNA which is enriched in cardiac microvascular endothelial cells and reduced in expression under cardiac stress conditions. miR-216a null mice display dramatic cardiac phenotypes related to impaired myocardial vascularization and unbalanced autophagy and inflammation, supporting a model where microRNA regulation of microvascularization impacts the cardiac response to stress.

Keywords: angiogenesis; autophagy; cardiac remodeling; endothelial cells; heart failure; microRNAs.


Conflict of interest statement

Declaration of interests L.d.W. and P.d.C.M. are cofounders of Mirabilis Therapeutics.

Figures

None
Graphical abstract
Figure 1
Figure 1
High-content screening identifies microRNAs regulating endothelial cell proliferation (A) Screening strategy and workflow used to detect microRNAs that influence endothelial cell proliferation. (B) Distribution of standardized enrichment scores (Z scores) for the entire library of 753 miRNA-LNA inhibitors, calculated based on the EdU-positive human umbilical vein endothelial cells (HUVECs) for each LNA inhibitor and relative to the scrambled LNA. Inhibition of miR-216a-5p was found to significantly reduce the proliferation rate and is marked with a red dot. (C) Northern blotting analysis of miR-216a-5p expression in hearts of mice subjected to transverse aortic constriction (TAC) (upper panel) and quantification of the corrected northern blot signal (lower panel). Rnu6-2 was used as a loading control. n refers to number of hearts: n = 4 (sham) and n = 6 (TAC). (D) Northern blotting analysis of miR-216a-5p expression in hearts of mice subjected to myocardial infarction (MI) (upper panel) and quantification of the corrected northern blot signal (lower panel). Rnu6-2 was used as a loading control. n refers to number of hearts: n = 4 (sham) and n = 6 (MI). (E) Representative images of cultured HUVECs stained with Hoechst (blue) and 5-ethanyl-2′-deoxyuridine (Edu) (red) 24 h after transfection with miR-216a-5p-LNA-inhibitor or precursor-miR-216a-5p. Scale bar, 100 μm. (F and G) Quantification of HUVEC proliferation 24 h after transfection with an LNA or a precursor molecule either scrambled or specific for miR-216a-5p, represented as percentage of Edu-positive cells (F) and proliferation antigen Ki67-positive cells (G) to total cell count; n refers to independent experiments, n = 3 (10 microscopic fields/condition/experiment). In all panels numerical data are presented as mean (error bars show SEM); statistical significance was calculated using two-tailed unpaired t test. ∗p < 0.05 vs. control group.
Figure 2
Figure 2
miRNA-216a genomic location and targeting strategy (A) Schematic representation of hsa-miR-216a-5p genomic localization (top panel) and precursor sequence (bottom panel). In the human genome, miR-216a is in a cluster together with miR-216b and miR-217, which is transcribed together within a long non-coding RNA MIR217HG-001 within the opposite strand of a longer long non-coding RNA RP11-481J13.1-001. The mature miR-216a-5p strand is conserved among species (bottom panel). (B) Strategy for targeting of miR-216a. The targeting vector, targeted allele, and null allele for miR-216a are shown. LoxP sites were introduced flanking the genomic region encompassing both the 71-bp pre-miR-216a as well as a neomycin resistance cassette flanked by two FRT sites, which allowed for bFLP recombinase-mediated excision and Cre-mediated removal of the targeted region of the miR-216a locus. Sizes of probes for Southern blotting analysis are shown. (C) Verification of homologous recombination strategy by Southern blot analysis based on BgII digestion. The wild-type (WT) allele yielded a 5.1 kb DNA fragment, whereas successful targeting (mut) results in both 5.1 and 11.9 kb fragments in heterozygous miR-216aneo/+. Removal of the neomycin cassette and Cre-mediated excision of the floxed miR-216a target region, an expected fragment of 7.9 kb was observed (null allele). (D) Northern blotting analysis of miR-216a-5p expression in hearts from WT and miR-216a knockout (KO) mice. Rnu6-2 was used as a loading control. (E) Representative images of whole hearts (top panel) and wheat germ agglutinin (WGA)-stained (bottom panel) histological sections of WT and KO hearts. Scale bars, 5 mm (top panel) and 50 μm (bottom panel). (F) Gravimetric analysis of corrected heart weights in WT and KO mice; n refers to number of hearts: n = 4 (WT) and n = 5 (KO). (G) Quantification of cardiomyocyte surface area from WT and KO mice, based on 150 cells measured per heart; n refers to number of hearts: n = 4 (WT) and n = 5 (KO). (H) Quantification of ejection fraction (EF) and (I) left ventricular internal diameter (LVID) during systole in WT and KO mice; n refers to number of hearts: n = 4 (WT) and n = 5 (KO). In all panels, numerical data are presented as mean (error bars show SEM); statistical significance was calculated using two-tailed unpaired t test. ∗p < 0.05 vs. control group.
Figure 3
Figure 3
miR-216a ablation induces a spontaneous pathological cardiac phenotype that is aggravated under pressure overload (A) Design of the study. WT and miR-216a KO mice were subjected to TAC or sham surgery and cardiac geometry and function were determined by serial Doppler echocardiography at 2 weeks after surgery. (B) Kaplan-Meier survival curves for WT and KO mice subjected to sham or transverse aortic constriction (TAC) for 2 weeks, clearly showing high mortality rates in KO mice under cardiac pressure overload induced by TAC. (C) Representative images of whole hearts (top panel) and four-chamber view (second panel), haematoxylin and eosin (H&E)-stained (third panel) histological sections from WT and KO hearts from mice subjected to either sham or TAC surgery. Scale bars, 5 mm (top two panels) and 50 μm (bottom two panels). (D) Gravimetric analysis of corrected heart weights in WT and KO mice subjected to either sham or TAC surgery; n refers to number of hearts: n = 5 WT sham, n = 7 KO sham, n = 6 WT TAC, and n = 3 KO TAC. (E) Quantification of cardiomyocyte surface area from WT and KO mice subjected to either sham or TAC surgery based on 150 cells measured per heart; n refers to number of hearts: n = 3 (WT sham), n = 3 (KO sham), n = 5 (WT TAC), and n = 3 (KO TAC). (F) Representative image of Sirius Red-stained (upper panels), WGA-stained, and IB4-stained (second panel) histological sections from WT and KO hearts from mice subjected to either sham or TAC surgery. Scale bars, 50 μm (Sirius Red) and 100 μm (IB4). (G) Quantification of collagen deposition from images of histological sections stained for Sirius Red, based on 30 microscopic fields/heart, n = 3 hearts/group. (H) Capillaries in myocardial sections of the different animal groups were identified by isolectin B4 immunohistochemistry combined with WGA and, from the images obtained, we determined the ratio of capillaries per cardiomyocyte ratios based on 30 microscopic fields/heart, n = 3 hearts/group. (I) Real-time PCR analysis of transcript abundance for pecam1 in hearts from WT and KO mice subjected to either sham or TAC, n refers to number of hearts: n = 8 WT sham, n = 10 KO sham, n = 8 WT TAC, and n = 3 KO TAC. (J and K) Quantification of ejection fraction (EF) (J) and left ventricular internal diameter during systole (LVIDs) (K) in WT and KO mice subjected to either sham or TAC surgery, n refers to number of hearts: n = 8 WT sham, n = 10 KO sham, n = 8 WT TAC, and n = 3 KO TAC. (L and M) Quantitative real-time PCR analysis of atrial natriuretic peptide (nppa) (L) and β-myosin heavy chain 7 (myh7) (M) in hearts of WT and KO mice subjected to either sham or TAC surgery; n refers to number of hearts: n = 5 WT sham, n = 7 KO sham, n = 6 WT TAC, and n = 3 KO TAC. In all panels numerical data are presented as mean (error bars show SEM); statistical significance was calculated using two-tailed unpaired t test when comparing two experimental groups or two-way ANOVA followed by Tukey’s multiple comparison test when comparing more than two experimental groups. ∗p < 0.05 vs. corresponding control group, #p < 0.05 vs. experimental group.
Figure 4
Figure 4
miR-216a silencing increases susceptibility to myocardial infarction (A) Design of study. WT and miR-216a KO mice were subjected to myocardial infarction (MI) or sham surgery and cardiac geometry and function were determined by serial Doppler echocardiography at 4 weeks after surgery. (B) Kaplan-Meier survival curve for WT and KO mice subjected to sham or MI. (C and D) Representative images of sequential transversal sections of hearts from WT and KO mice subjected to MI (C), stained with Sirius-red for visualization and quantification of the infarct areas (relative to left ventricle area) in the different groups (D) showing significantly larger infarct areas in the KO mice hearts; n refers to number of hearts: n = 4 WT MI, n = 3 KO MI. Scale bar, 5 mm. (E) Gravimetric analysis of corrected heart weights in WT and KO mice subjected to either sham or MI surgery; n refers to number of hearts: n = 5 WT sham, n = 9 KO sham, n = 6 WT MI, and n = 8 KO MI. (F) Representative images of WGA-stained histological cardiac sections from WT and KO mice subjected to sham or MI. Scale bar, 50 μm. (G) Quantification of cardiomyocyte surface area from WT and KO mice subjected to either sham or MI surgery based on 150 cells measured per heart; n = 3 hearts per group. (H and I) Quantification of EF (H) and LVIDs (I) in WT and KO mice subjected to either sham or MI; n refers to number of hearts: n = 6 WT sham, n = 11 KO sham, n = 8 WT MI, and n = 12 KO MI). (J and K) Quantitative real-time PCR analysis of atrial natriuretic peptide (Nppa) (J) and β-myosin heavy chain 7 (Myh7) (K) in hearts of WT and KO mice subjected to either sham or MI surgery; n refers to number of hearts (n = 6 WT sham, n = 8 KO sham, n = 8 WT MI, and n = 8 KO MI). In all panels numerical data are presented as mean (error bars show SEM); statistical significance was calculated using two-tailed unpaired t test when comparing two experimental groups or two-way ANOVA followed by Tukey’s multiple comparison test when comparing more than two experimental groups. ∗p < 0.05 vs. corresponding control group, #p < 0.05 vs. experimental group.
Figure 5
Figure 5
miR-216a silencing promotes capillary rarefaction and endothelial dysfunction (A) Quantitative real-time PCR analysis of miR-216a expression in mouse primary cardiac cells. All different cell fractions, endothelial cells (EC); fibroblasts (FB), and inflammatory cells (CD45+) were compared with the cardiomyocyte fraction (CM); n refers to independent experiments (n = 4). (B) Confocal microscopy images of neonatal rat cardiomyocytes transfected with precursor molecules or LNA inhibitors specific for miR-216a, or their respective controls. Cells are stained for actinin alpha 1 (ACTN1) and with DAPI for nuclei visualization. Fibroblasts are marked in red. (C) Quantification of cell surface area from conditions in b based on 100 cells per condition, n = 3 independent experiments. (D) Real-time PCR analysis of transcript abundance for the fetal marker nppa in conditions in b (n = 3 independent experiments). (E) Whole-mount in situ hybridization (ISH) for miR-216 detection on KO mouse-derived cardiac tissue. Scale bar, 50 μm. (F) Representative images of histological sections of hearts from WT and KO mice subjected to sham or MI, where capillaries were stained with Griffonia simplicifolia I (GSI). Scale bar, 50 μm. (G) Quantification of cardiac capillary density based on 30 microscopic field/heart, n = 3 hearts/group and (H) cardiac capillary to cardiomyocyte ratios in histological sections of hearts from WT and KO mice subjected to sham or MI, based on 30 microscopic field/heart, n = 3 hearts/group. (I) Real-time PCR analysis of transcript abundance for pecam1 in hearts from WT and KO mice subjected to either sham or MI, n refers to number of hearts: n = 5 per group. (J–L) Myocardial tissue oxygenation analysis as assessed by combining photoacoustics (PA) with high frequency ultrasound. (J) Representative real-time images of focal tissue oxygen saturation in the myocardium of WT and KO mice. (K) PA intensity and (L) myocardial tissue oxygen saturation (stO2) in WT and KO mice. n refers to number of mice (n = 3 per group). (M) Quantitative real-time PCR analysis of miR-216a expression in different primary endothelial cell lines: human umbilical endothelial cells (HUVEC), human lung microvascular endothelial cells (HLMEC), human dermal microvascular endothelial cells (HDMEC), human cardiac microvascular endothelial cells (HCMEC), and human retinal microvascular endothelial cells (HRMEC), n = 4 independent experiments. (N) Representative images of the wound healing/migration assay on HUVECs after transfection with scrambled precursor or LNA, a miR-216a precursor molecule or an LNA-miR-216, for modulation of miR-216a expression, and (O) quantification of respective wound closure rate (n = 3 independent experiments for each condition). Scale bar, 200 μm. (P) Representative images of tubulogenesis assay on HUVECs after transfection with scrambled precursor or LNA, a miR-216a precursor molecule or an LNA-miR-216, and (Q) respective quantification (n = 3 independent experiments for each condition). Scale bar, 500 μm. In all panels numerical data are presented as mean (error bars show SEM); statistical significance was calculated using two-tailed unpaired t test when comparing two experimental groups or two-way ANOVA followed by Tukey’s multiple comparison test when comparing more than two experimental groups. ∗p < 0.05 vs. corresponding control group, #p < 0.05 vs. experimental group.
Figure 6
Figure 6
miR-216a links cardiac endothelial function and autophagy via regulation of PTEN (A) Quantitative PCR analysis of PTEN in HUVECs transfected either with a scrambled LNA or an LNA-miR-216a (n = 4 independent experiments including each condition). (B) Western blot analysis of PTEN and two autophagy surrogate markers, LC3 and p62, in HUVECs transfected either with a scrambled LNA or an LNA-miR-216a. GAPDH was used as loading control. (C–E) Quantification of PTEN expression (C), p62 (D), and LC3-II (E) from conditions in (B); n = 3 independent experiments including each condition. (F) Western blot analysis of PTEN, LC3, and p62 in myocardial tissue of WT and KO mice. GAPDH was used as loading control. (G–I) Quantification of PTEN expression (G), p62 (H), and LC3-II (I) in experimental groups from (G); n = 3 independent experiments including each condition. (J) Quantitative PCR analysis of Pten in myocardial tissue of WT and KO mice subjected to sham or MI; n = 5 hearts per group. (K) Western blot analysis and (L) quantification of PTEN expression in myocardial tissue of WT and KO mice subjected to sham or MI; n = 3 hearts per group. (M) Experimental setup of modulation of PTEN expression levels in HUVECs, using a specific siRNA to achieve downregulation and an adenovirus for upregulation. (N) Quantification of HUVEC proliferation 48 h after transduction with an Ad-GFP (control) or an Ad-PTEN, represented as percentage of Edu-positive cells; n = 3 independent experiments (10 microscopic fields for each condition/experiment). (O) Quantification of HUVEC proliferation 48 h after transfection with a scrambled- or PTEN-siRNA, represented as percentage of Edu-positive cells; n = 3 independent experiments (10 microscopic fields for each condition/experiment). (P) Quantitative PCR analysis of BECN1 in HUVECs transfected either with a scrambled LNA or an LNA-miR-216a (n = 4 independent experiments including each condition). (Q) Quantitative PCR analysis of Becn1 in myocardial tissue of WT and KO mice subjected to sham or MI; n = 5 hearts per group. (R) Quantitative PCR analysis of ATG5 in HUVECs transfected either with a scrambled LNA or an LNA-miR-216a (n = 4 independent experiments including each condition). (S) Quantitative PCR analysis of Atg5 in myocardial tissue of WT and KO mice subjected to sham or MI; n = 5 hearts per group. (T) Experimental setup to inhibit either BECN1 or ATG5 expression levels in HUVECs upon downregulation of miR-216a, using a specific siRNA and an LNA probe, respectively. (U) Quantification of HUVEC proliferation 48 h after transfection with scrambled LNA, or an LNA-miR-216, and ctrl-sirna, BECN1-sirna or ATG5-siRNA, represented as percentage of Edu-positive cells; n = 3 independent experiments (10 microscopic fields for each condition/experiment). (V) Quantification of wound healing/migration assay on HUVECs after transfection with scrambled LNA, or an LNA-miR-216, and ctrl-sirna, BECN1-sirna or ATG5-siRNA, represented as wound closure rate (n = 3 independent experiments for each condition). In all panels numerical data are presented as mean (error bars show SEM); statistical significance was calculated using two-tailed unpaired t test when comparing two experimental groups or two-way ANOVA followed by Tukey’s multiple comparison test when comparing more than two experimental groups. ∗p < 0.05 vs. corresponding control group.
Figure 7
Figure 7
miR-216a-dependent transcriptional changes in endothelial cells RNA sequencing was performed to assess the transcriptomic changes in endothelial cells treated with scrambled or miR-216a precursor molecules. (A) Heatmap of the top differentially expressed genes in endothelial cells treated with precursor-miR-216a compared with endothelial cells treated with scrambled precursor showing log2 FPKM (color scale) values of dysregulated genes, with yellow and blue colors representing increased and decreased expression, respectively. (B) Number of differentially expressed genes enriched in GO terms and (C) KEGG pathway analysis of differentially expressed genes. N refers to the number of genes involved in the pathway and DE refers to the genes in our dataset of differently expressed genes, therefore DE/N stands for the gene ratio and P.DE the p value for over-representation of the GO/KEGG term in the set. (D and E) Real-time PCR analysis of the expression of five representative (D) downregulated and (E) upregulated genes, n = 3 independent experiments. Numerical data are presented as mean (error bars show SEM); statistical significance was calculated using two-tailed unpaired t test. ∗p < 0.05 vs. corresponding control group. (F and G) Real-time PCR analysis of the expression of five representative (F) downregulated and (G) upregulated genes in myocardial tissue of WT and KO mice, n refers to number of hearts (n = 4 for each condition). Model depicting the regulatory mechanisms by which miR-216a controls physiological cardiac angiogenesis levels and regulates cardiac function. Decreased mir-216a expression levels in (cardiac) endothelial cells not only increases autophagic activity through direct upregulation of PTEN/BECN1 and indirectly ATG5 expression with subsequent impairment of angiogenesis, but also majorly impacts on apoptosis signaling and cardiac inflammatory response, leading to cardiac pathologic remodeling, susceptibility to cardiac stress, and ultimately to cardiac dysfunction and heart failure.

References

    1. Diaz-Sandoval L.J., Losordo D.W. Gene therapy for cardiovascular angiogenesis. Expert Opin. Biol. Ther. 2003;3:599–616. - PubMed
    1. Itescu S., Kocher A.A., Schuster M.D. Myocardial neovascularization by adult bone marrow-derived angioblasts: strategies for improvement of cardiomyocyte function. Heart Fail. Rev. 2003;8:253–258. - PubMed
    1. Wang X., Huang W., Liu G., Cai W., Millard R.W., Wang Y., Chang J., Peng T., Fan G.-C. Cardiomyocytes mediate anti-angiogenesis in type 2 diabetic rats through the exosomal transfer of miR-320 into endothelial cells. J. Mol. Cell. Cardiol. 2014;74:139–150. - PMC - PubMed
    1. Van der Laan A.M., Piek J.J., Van Royen N. Targeting angiogenesis to restore the microcirculation after reperfused MI. Nat. Rev. Cardiol. 2009;6:515–523. - PubMed
    1. Bang C., Batkai S., Dangwal S., Gupta S.K., Foinquinos A., Holzmann A., Just A., Remke J., Zimmer K., Zeug A., et al. Cardiac fibroblast-derived microRNA passenger strand-enriched exosomes mediate cardiomyocyte hypertrophy. J. Clin. Invest. 2014;124:2136–2146. - PMC - PubMed

Publication types

MeSH terms