

Long-term histological effects of high-dose prednisolone administration on the mitral valve in normal Beagle dogs
- PMID: 37073241
- PMCID: PMC10105791
- DOI: 10.5455/OVJ.2023.v13.i2.3
Long-term histological effects of high-dose prednisolone administration on the mitral valve in normal Beagle dogs
Abstract
Background: In recent years, left ventricular hypertrophy and cardiac dysfunction have been reported in human and canine patients with hypercortisolism and in dogs treated experimentally with high-dose prednisolone. However, to our knowledge, there have been no reports on the effects of hyperglucocorticism (HGC) on the mitral valve (MV).
Aim: This study aimed to compare the MV in dogs treated with high-dose prednisolone with that in healthy dogs to investigate the effects of HGC on the MV.
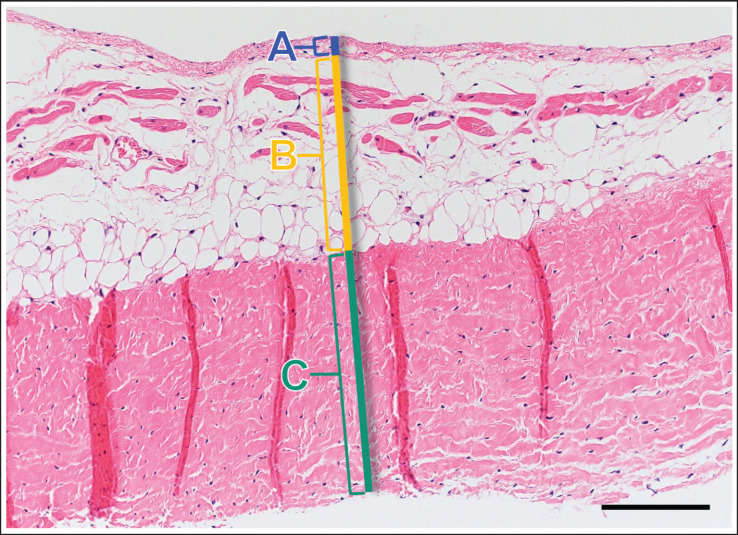
Methods: We investigated the effects of HGC on the MV by comparing samples obtained from high-dose glucocorticoid (GC)-treated (P) and healthy (C) dogs. The P group included healthy Beagle dogs (n = 6) treated with prednisolone (2 mg/kg, bid, po) for 84 days and the C group included healthy Beagle dogs (n = 6) euthanized for unrelated reasons. The anterior and posterior mitral leaflets (AML and PML, respectively) from both groups were harvested and stained with hematoxylin-eosin, Alcian blue, and Masson trichome. Additionally, adiponectin (ADN) and GC receptor immunohistochemistry were performed. Histological evaluation was performed in the atrialis, spongiosa, fibrosa, and all layers of the proximal, middle, and distal regions of the AML and PML.
Results: The proportion of the spongiosa layer thickness to the total thickness was higher in the P than in the C group (proximal and middle AML). However, the proportion of the fibrosa layer thickness to the total thickness was lower in the P than in the C group (middle PML). Areas of acidic sulfated mucosubstance deposition were smaller in the fibrosa layer and all layers (middle AML), while those of collagen deposition were smaller in the spongiosa and total layers (proximal and middle AML), in the P than in the C group. Additionally, ADN expression in the spongiosa layer was higher in the P than in the C group (middle AML).
Conclusion: These findings suggest that long-term administration of synthetic GCs induces histological changes in the MV. These changes may lead to MV dysfunction in dogs with HGC.
Keywords: Anterior mitral leaflet; Canine; Cushing syndrome; Hyperglucocorticism; Posterior mitral leaflet.
Conflict of interest statement
The authors declare that there is no conflict of interest.
Figures


Similar articles
-
Mechanism of long-term high-dose prednisolone administration producing myocardial fibrosis in beagle dogs.Open Vet J. 2023 Dec;13(12):1708-1717. doi: 10.5455/OVJ.2023.v13.i12.19. Epub 2023 Dec 31. Open Vet J. 2023. PMID: 38292726 Free PMC article.
-
An investigation of layer-specific tissue biomechanics of porcine atrioventricular valve anterior leaflets.Acta Biomater. 2019 Sep 15;96:368-384. doi: 10.1016/j.actbio.2019.06.049. Epub 2019 Jun 29. Acta Biomater. 2019. PMID: 31260822 Free PMC article.
-
Mitral-valve repair without annuloplasty rings: results after repair of anterior leaflet versus posterior-leaflet defects using polytetrafluoroethylene sutures for chordal replacement.Eur J Cardiothorac Surg. 2000 Mar;17(3):206-12. doi: 10.1016/s1010-7940(00)00352-3. Eur J Cardiothorac Surg. 2000. PMID: 10758377
-
The pathology of mitral valve prolapse.Herz. 1988 Aug;13(4):215-26. Herz. 1988. PMID: 3049284 Review.
-
Pathology of myxomatous mitral valve disease in the dog.J Vet Cardiol. 2012 Mar;14(1):103-26. doi: 10.1016/j.jvc.2012.02.001. Epub 2012 Mar 3. J Vet Cardiol. 2012. PMID: 22386587 Review.
References
-
- Behrend E.N, Kooistra H.S, Nelson R, Reusch C.E, Scott-Moncrieff J.C. Diagnosis of spontaneous canine hyperadrenocorticism: 2012 ACVIM consensus statement (small animal) J. Vet. Intern. Med. 2013;27:1292–1304. - PubMed
-
- Boscaro M, Barzon L, Fallo F, Sonino N. Cushing's syndrome. Lancet. 2001;357:783–791. - PubMed
Publication types
MeSH terms
Substances
LinkOut - more resources
Full Text Sources
Medical
Miscellaneous