

GRaNIE and GRaNPA: inference and evaluation of enhancer-mediated gene regulatory networks
- PMID: 37073532
- PMCID: PMC10258561
- DOI: 10.15252/msb.202311627
GRaNIE and GRaNPA: inference and evaluation of enhancer-mediated gene regulatory networks
Abstract
Enhancers play a vital role in gene regulation and are critical in mediating the impact of noncoding genetic variants associated with complex traits. Enhancer activity is a cell-type-specific process regulated by transcription factors (TFs), epigenetic mechanisms and genetic variants. Despite the strong mechanistic link between TFs and enhancers, we currently lack a framework for jointly analysing them in cell-type-specific gene regulatory networks (GRN). Equally important, we lack an unbiased way of assessing the biological significance of inferred GRNs since no complete ground truth exists. To address these gaps, we present GRaNIE (Gene Regulatory Network Inference including Enhancers) and GRaNPA (Gene Regulatory Network Performance Analysis). GRaNIE (https://git.embl.de/grp-zaugg/GRaNIE) builds enhancer-mediated GRNs based on covariation of chromatin accessibility and RNA-seq across samples (e.g. individuals), while GRaNPA (https://git.embl.de/grp-zaugg/GRaNPA) assesses the performance of GRNs for predicting cell-type-specific differential expression. We demonstrate their power by investigating gene regulatory mechanisms underlying the response of macrophages to infection, cancer and common genetic traits including autoimmune diseases. Finally, our methods identify the TF PURA as a putative regulator of pro-inflammatory macrophage polarisation.
Keywords: enhancers; gene regulatory networks; macrophage biology; multiomics data integration; transcriptional regulation.
© 2023 The Authors. Published under the terms of the CC BY 4.0 license.
Conflict of interest statement
We declare that none of the authors have any competing interests. JBZ is an editorial advisory board member. This has no bearing on the editorial consideration of this article for publication.
Figures
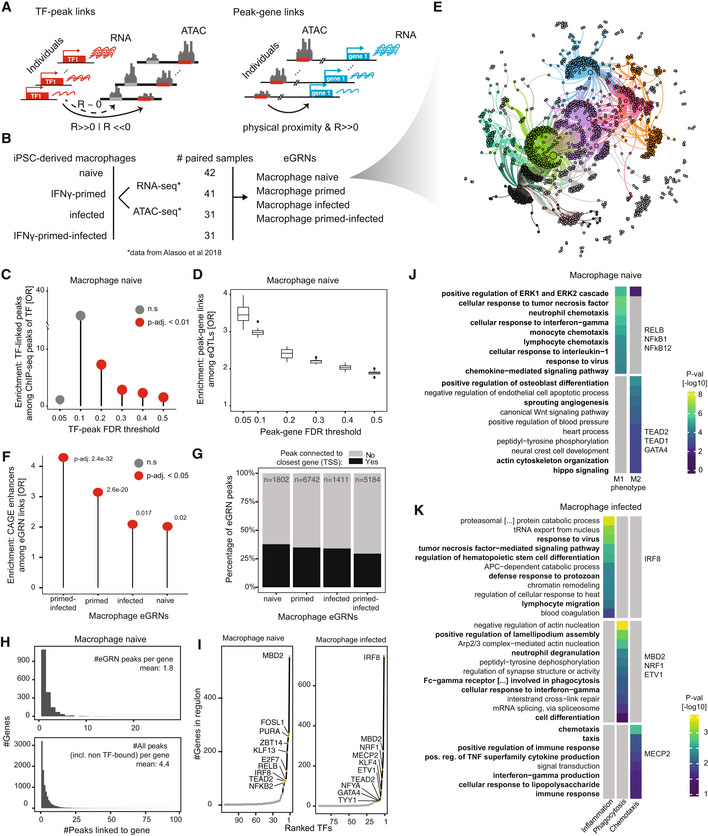
- A
Schematic of the eGRN construction by GRaNIE, including the TF to peak (left) and peak to gene (right) links (detailed workflow in Appendix Fig S1).
- B
Datasets used for macrophage eGRN construction and evaluation.
- C
Validation of the eGRN TF‐peak links with ChIP‐seq data. Enrichment of ChIP‐seq peaks overlapping a GRaNIE‐inferred TF‐bound peak (same TF) are shown for different TF‐peak FDRs in the naive macrophage eGRN. Statistical significance was determined using Fishers Exact test; test set: all TF‐peak pairs where the peak contains the motif for the respective TF (n = 25,205, 39,408, 78,971, 109,228, 142,548, 147,226 for TF‐peak FDR 0.05, 0.1, 0.2, 0.3, 0.4, 0.5 respectively), categories: overlap with ChIP‐seq signal, part of GRaNIE‐infer network. Only TFs for which ChIP‐seq data was available are considered (see Appendix Fig S2 for other eGRNs).
- D
Validation of the eGRN peak‐gene links with macrophage eQTLs. Plots show the enrichment of eGRN links overlapping an eQTL over randomly sampled distance‐matched peak‐gene links for different peak‐gene FDRs in the naive macrophage eGRN (see Appendix Fig S3 for other eGRNs). Boxplots: central band: 50% quantile, box: interquartile range (25–75%); whiskers: max/min are 1.5 IQR above/below the box.
- E
Force‐directed visualisation of the naive macrophage eGRN (see Appendix Fig S4 for the other eGRNs). The colours correspond to the identified communities.
- F
Enrichment of macrophage‐specific FANTOM5 CAGE enhancers among the macrophage eGRN peaks. Statistical significance was determined with Fisher's exact test; test set: all peaks that were considered for peak‐gene connections (ATAC consensus peaks located within 250 kb of a TSS of a gene with mean normalised expression across samples > 1) in each eGRN (n = 210,083, 227,035, 227,120 and 219,823 peaks for the naive, infected, primed and primed‐infected eGRN, respectively), categories: overlap with CAGE enhancer, part of GRaNIE network.
- G
Fraction of eGRN peaks connected to the closest gene (black) versus other (grey) genes for the macrophage eGRNs.
- H
Number of peaks linked to a gene shown as histogram for eGRN peaks (top) and all peaks (including non‐TF bound; bottom) for the naive macrophage data (see Appendix Fig S7 for other eGRNs). Mean number of peaks indicated in the panels.
- I
Number of genes connected to each TF for the naive macrophage eGRN (top 10 TFs are labelled).
- J, K
GO enrichment and associated P‐values for selected communities from the naive (J) and infected (K) macrophage eGRN (see Dataset EV7 for the full table of enrichments across communities for all macrophage eGRNs).
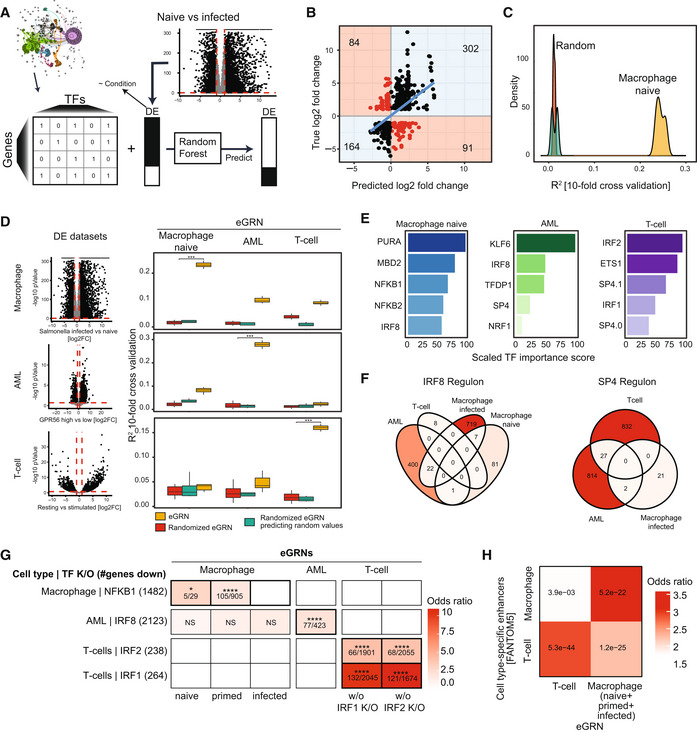
Schematic of the general GRN evaluation approach GRaNPA.
Output of GRaNPA is shown as true versus predicted log2 fold‐changes for the macrophage expression response to Salmonella infection. Predictions are based on the naive macrophage eGRN (see Appendix Fig S10 for the other macrophage eGRNs).
Output of GRaNPA is shown as density distribution of R 2 for 10 random forest runs for the naive macrophage eGRN predicting differential expression upon Salmonella infection, along with the two permuted controls.
GRaNPA evaluation of eGRNs for naive macrophages (left), AML (middle) and T‐Cells (right) of differential expression from macrophages infected with Salmonella versus naive (top), two subtypes of AML (middle), and resting versus stimulated T‐cells (bottom). Red lines indicate the log2 fold‐change (vertical line) and P‐value (horizontal line) thresholds for genes included in the GRaNPA analysis. Distributions of R 2 from distinct random forest runs (n = 10) are shown as boxplots; t‐tests were performed to compare GRaNPA performance between the permuted and real networks (***P < 0.001). Boxplots: central band: 50% quantile, box: interquartile range (25–75%); whiskers: max/min are 1.5 IQR above/below the box.
Top 5 most important TFs (0.0 and 0.1 indicate distinct TF motifs as defined by the HOCOMOCO database) for each of the eGRNs in (D) based on prediction in the same cell‐type.
Overlap of SP4 (left) and IRF8 (right) regulons between eGRNs from different cell types (only eGRNs with at least one connection to the respective TF are shown).
Enrichment (odds ratio ‐ OR) of NFKB1, IRF8, IRF1 and IRF2 target genes identified in cell‐type specific knockouts (K/O, rows) in the matching macrophage, AML and T‐cell eGRN regulons (columns). Numbers in cells indicate: (# genes in regulon and down in TF K/O)/(# genes in regulon). Asterisks indicate significance using Fisher's exact test; test set: all protein‐coding genes; categories: gene in regulon, gene down in TF K/O (NS: non‐significant, *P‐adj. < 0.05, ****: < 0.001). White squares indicate empty regulons.
Enrichment of T‐cell and macrophage‐specific FANTOM5 CAGE enhancers among the T‐cell and macrophage eGRN peaks. The numbers inside the tiles are BH‐adjusted P‐values based on Fisher's exact test; test set: all peaks in the respective cell types (102,141 and 248,844 for T‐cells and macrophage eGRNs, respectively); categories: peak in eGRN, peak overlap with CAGE enhancer. The macrophage eGRN is the union between the infected, naive and primed eGRNs.
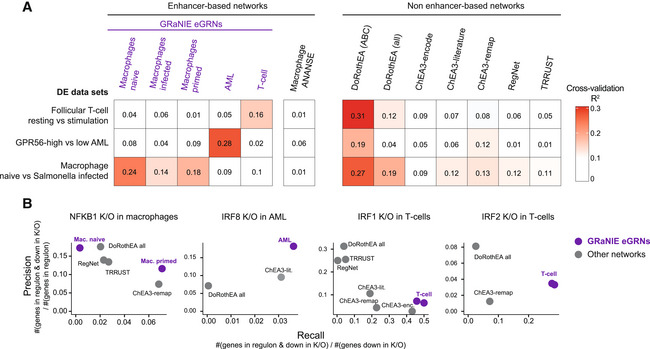
GRaNPA evaluation of five GRaNIE eGRNs (macrophage naive/primed/infected, AML, and T‐cells), another enhancer‐based eGRN inferred with ANANSE (Xu et al, 2021), and publicly available TF‐gene networks based on data curation (DoRothEA ABC and all (Holland et al, 2020a)), ChIP‐seq data (ChEA3 encode, literature, and ReMap (Keenan et al, 2019)), manual curation (TRRUST (Han et al, 2018) and REGNET (Liu et al, 2015)). GRNs are evaluated by GRaNPA for their performance in predicting the differential expression of resting versus stimulated follicular T‐cells, GPR56 high versus low AML, and naive versus Salmonella‐infected macrophages. Numbers in squares indicate R 2 values.
Precision‐Recall evaluation of the NFKB1, IRF8, IRF1 and IRF2 regulon from the networks in (A) for identifying genes down‐regulated upon K/O of the respective TF. For GRaNIE eGRNs (purple), the performance of cell‐type matching networks is shown, other networks are the same across all analyses.
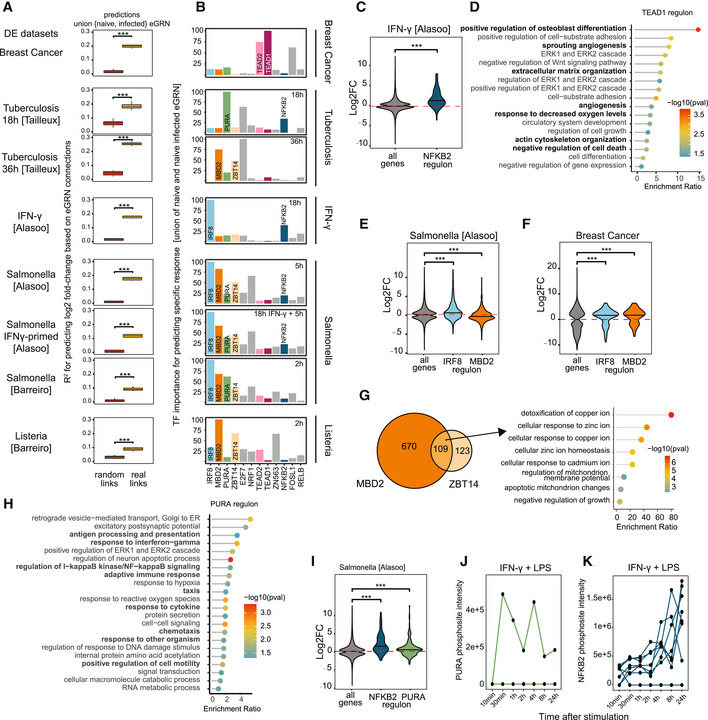
- A
GRaNPA evaluation of the union of the naive and infected macrophage eGRNs (naive+infected eGRN; real links) and the corresponding permuted control network (random links) across eight experimental settings of macrophage perturbations. Distributions of R 2 from distinct random forest runs (n = 10) are shown as boxplots and two sided t‐tests were performed to compare GRaNPA performance between the permuted and real networks (***P < 0.001). Boxplots: central band: 50% quantile, box: interquartile range (25–75%); whiskers: max/min are 1.5 IQR above/below the box.
- B
TF importance profiles for each of the eight infection settings from (A). The top 5 most predictive TFs in any of the settings are displayed. TFs discussed in the text are individually labelled and coloured.
- C
Distribution of log2 fold‐changes for genes in the NFKB2 regulons from the naive+infected eGRN (n = 85; dark blue) are shown for IFN‐γ stimulation versus naive macrophages alongside the response of all genes (n = 2,976; grey). Central band of the violin plot: median.
- D
GO enrichment of the TEAD1 regulon.
- E, F
Distribution of log2 fold‐changes of Salmonella infection versus naive macrophages (E) and for breast‐cancer associated macrophages (F) are shown for genes in the IRF8 (n = 830; blue) and MBD2 (n = 779; orange) regulons alongside the response of all genes (n = 2,976; grey). Central band of the violin plot: median.
- G
The overlap between the MBD2 and ZBT14 regulons are shown as Venn Diagram (left). Enriched GO terms for the genes in the intersection are shown as a lollipop plot (right).
- H
GO enrichment of the PURA regulon.
- I
Distribution of log2 fold‐changes of Salmonella infection versus naive macrophages for genes in the NFKB2 (n = 85; blue) and PURA (n = 258; green) regulon alongside the response of all genes (n = 2,976; grey). Central band of the violin plot: median.
- J, K
Normalised mass spectrometry intensity values (y‐axis) for phosphosites detected on PURA (green, J) and NFKB2 (blue, K) in macrophages cultured in the presence of M1 polarising stimuli (IFN‐γ and LPS) for indicated time points (x‐axis). Lines show individual phosphosites detected on each respective TF.
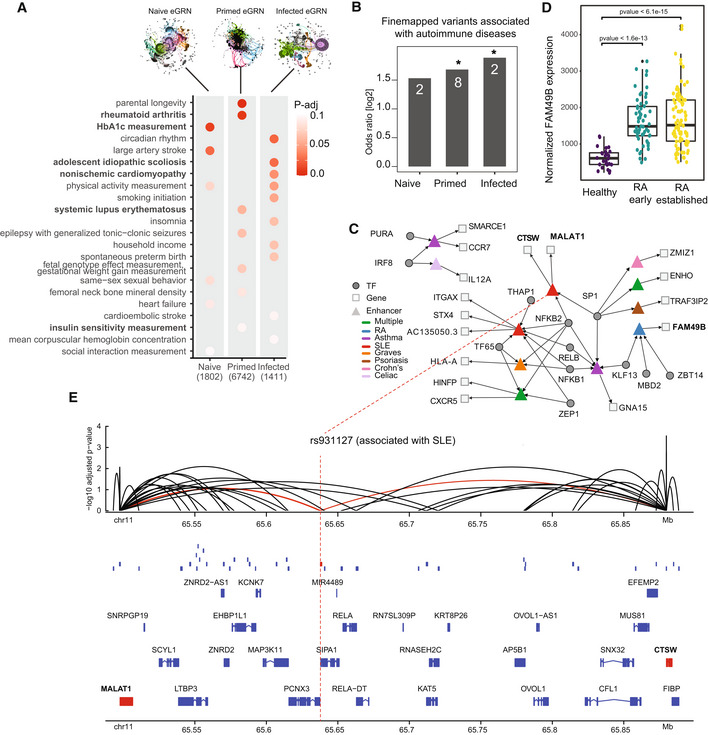
Heritability enrichment is shown for the naive, primed and infected macrophage eGRNs. The P‐value is adjusted within each trait.
The enrichment of fine‐mapped GWAS SNPs within the naive, primed, and infected eGRNs is shown as odds ratios; *P‐value < 0.05 (Fisher's exact test, test set: all ATAC‐seq peaks in macrophages – 296,220; categories: peak in eGRN, peak overlap with finemapped SNP); n: number of finemapped SNPs.
The tripartite TF‐enhancer‐gene network involving all fine‐mapped GWAS variants for autoimmune diseases.
Normalised expression level of FAM49B is shown as a boxplot for synovial tissue from healthy controls (n = 28) and patients suffering from early (n = 57; green) and established (n = 95; yellow) rheumatoid arthritis (RA). Data from (Guo et al, 2017). Boxplots: central band: 50% quantile, box: interquartile range (25–75%); whiskers: max/min are 1.5 IQR above/below the box. Black dots indicate outliers. Adjusted P‐values were calculated according to the Wald test implemented in DESeq2; replicates are individual donors.
The genomic context of the fine‐mapped, SLE‐associated variant rs931127 in an ATAC‐seq peak (red box) as gene tracks, including other peaks present in the infected macrophage eGRN (blue boxes), and peak‐gene links from the infected macrophage eGRN (arcs). Genes targeted by the peak overlapping with rs931127 (red) are coloured in red.
References
-
- Alexa A, Rahnenführer J, Lengauer T (2006) Improved scoring of functional groups from gene expression data by decorrelating GO graph structure. Bioinformatics 22: 1600–1607 - PubMed
Publication types
MeSH terms
Substances
Grants and funding
LinkOut - more resources
Full Text Sources
Other Literature Sources
Medical
Molecular Biology Databases
Miscellaneous
