. 2023 May 15;136(10):jcs260578.
doi: 10.1242/jcs.260578. Epub 2023 May 18.

The UbiB family member Cqd1 forms a novel membrane contact site in mitochondria

Affiliations

The UbiB family member Cqd1 forms a novel membrane contact site in mitochondria

Siavash Khosravi et al. J Cell Sci. .

Abstract

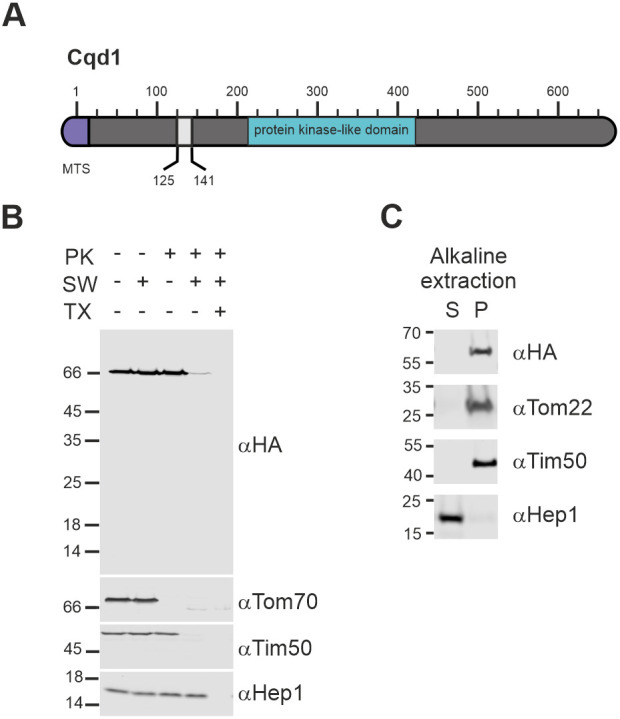
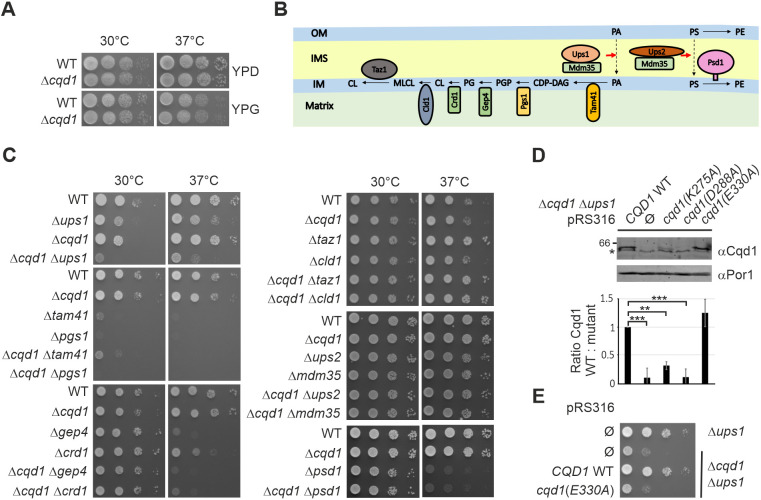
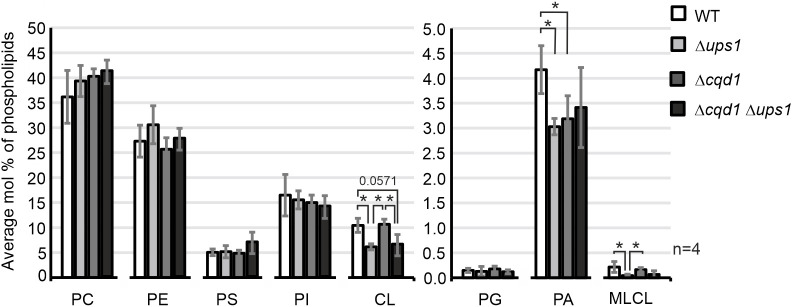
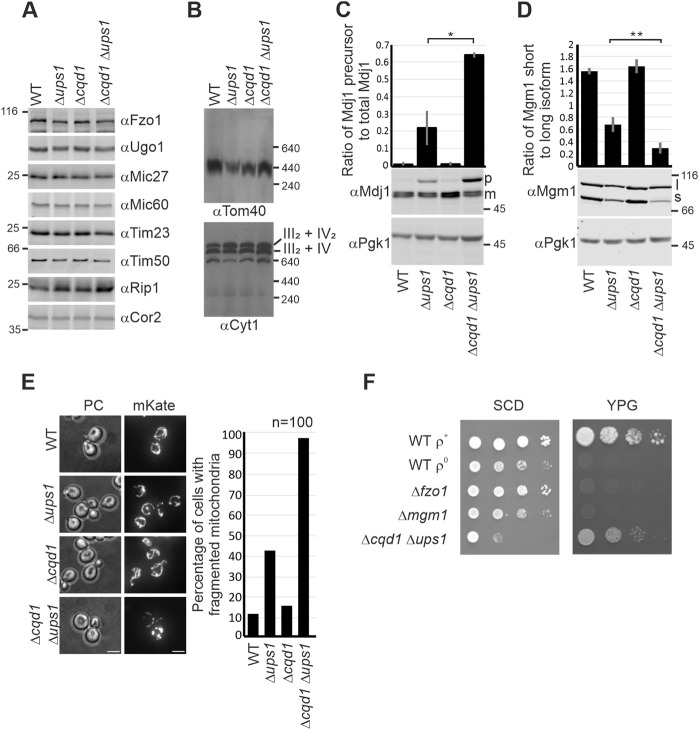
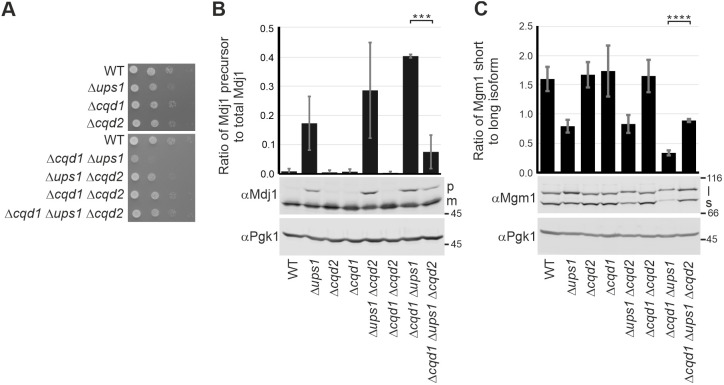
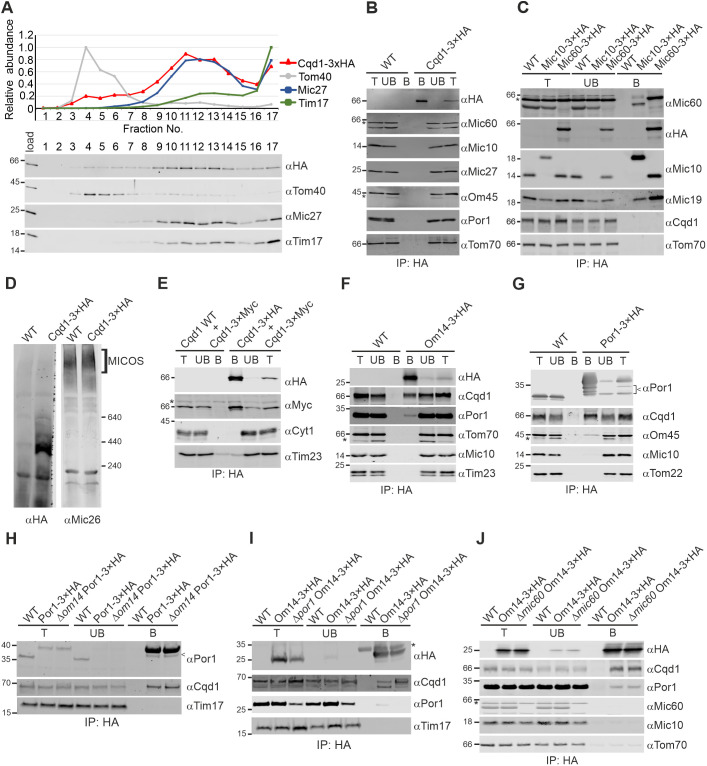
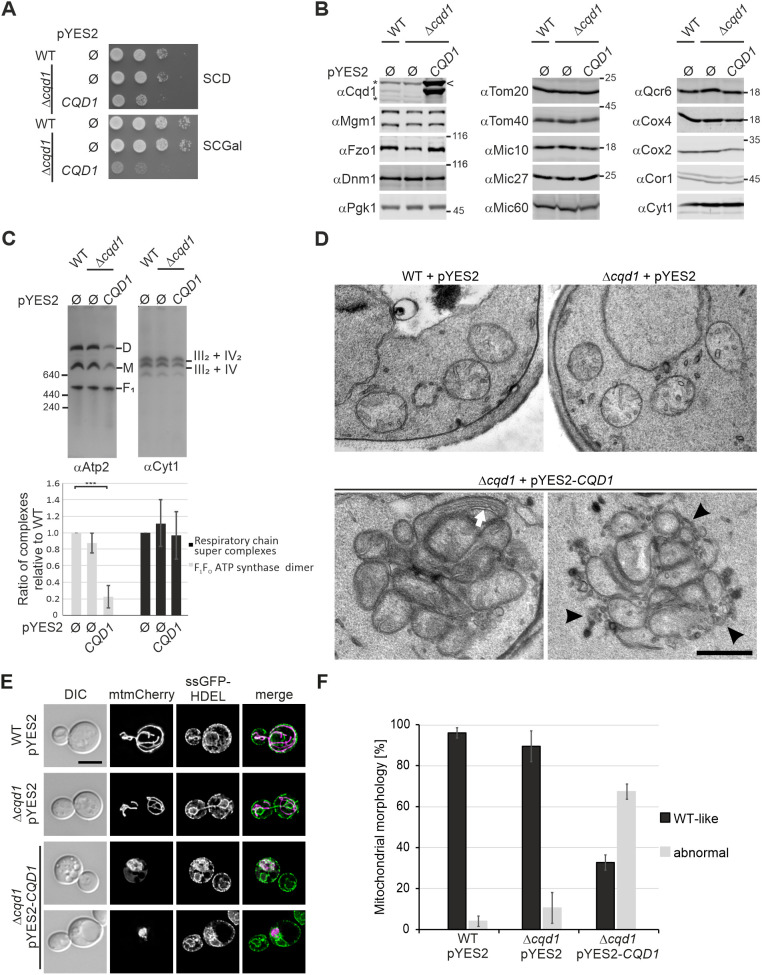
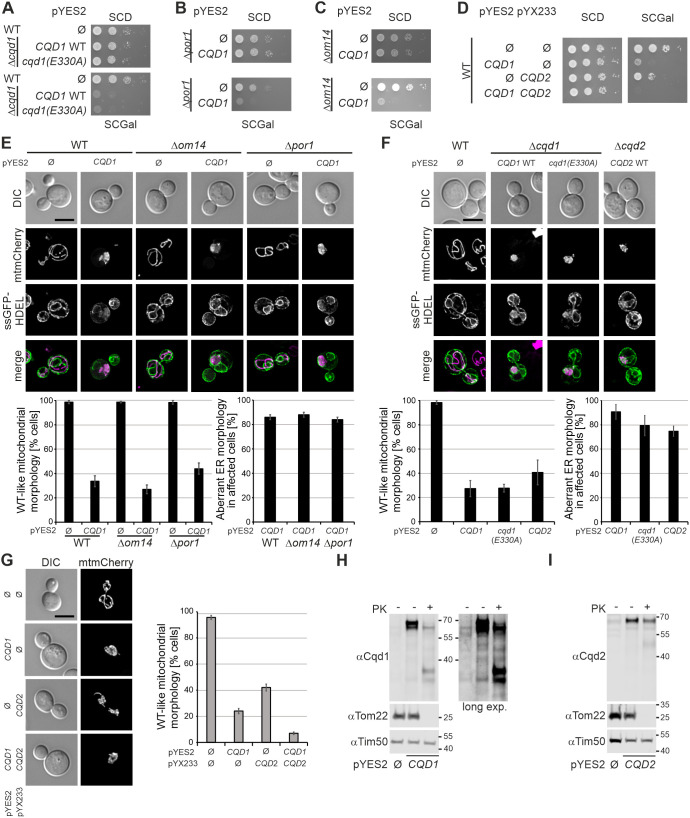
Mitochondria are essential organelles of eukaryotic cells and are characterized by their unique and complex membrane system. They are confined from the cytosol by an envelope consisting of two membranes. Signals, metabolites, proteins and lipids have to be transferred across these membranes via proteinaceous contact sites to keep mitochondria functional. In the present study, we identified a novel mitochondrial contact site in Saccharomyces cerevisiae that is formed by the inner membrane protein Cqd1 and the outer membrane proteins Por1 and Om14. Similar to what is found for the mitochondrial porin Por1, Cqd1 is highly conserved, suggesting that this complex is conserved in form and function from yeast to human. Cqd1 is a member of the UbiB protein kinase-like family (also called aarF domain-containing kinases). It was recently shown that Cqd1, in cooperation with Cqd2, controls the cellular distribution of coenzyme Q by a yet unknown mechanism. Our data suggest that Cqd1 is additionally involved in phospholipid homeostasis. Moreover, overexpression of CQD1 and CQD2 causes tethering of mitochondria to the endoplasmic reticulum, which might explain the ability of Cqd2 to rescue ERMES deletion phenotypes.

Keywords: Contact sites; Mitochondria; Mitochondrial biogenesis; Mitochondrial morphology; Phospholipids; UbiB protein family.


Conflict of interest statement

Competing interests The authors declare no competing or financial interests.

Figures

Fig. 1.
Fig. 1.
Cqd1 is a mitochondrial inner membrane protein exposing its C-terminus to the intermembrane space. (A) Schematic representation of Cqd1. Violet, mitochondrial targeting sequence (MTS; amino acids 1–15); grey, predicted transmembrane domain (amino acids 125–141); turquoise, conserved protein kinase-like domain (amino acids 213–421). (B) Cqd1 exposes its C-terminus to the intermembrane space. Mitochondria isolated from a Cqd1–3xHA-expressing strain were treated with isotonic buffer, subjected to swelling by incubation in hypotonic buffer to disrupt the outer membrane (SW), or lysed using a Triton X-100 containing buffer (TX). Proteinase K (PK) was added as indicated. Samples were analyzed by SDS-PAGE and immunoblotting. Tom70 was used as a marker for the outer membrane, Tim50 for the inner membrane and Hep1 for the matrix. (C) Cqd1 is an integral membrane protein. Isolated mitochondria were subjected to alkaline extraction to separate soluble and membrane proteins. Soluble proteins present in the supernatant (S) and membrane proteins in the pellet (P) were analyzed by SDS-PAGE and immunoblotting. Blots are representative of at least three repeats.
Fig. 2.
Fig. 2.
CQD1 is a negative genetic interactor of UPS1 and CRD1. (A) Deletion of CQD1 does not result in a growth defect. Cells of wild-type (WT) and a Δcqd1 deletion strain were grown to logarithmic growth phase in rich medium containing glucose as carbon source (YPD). Cell growth was analyzed by drop dilution assay on plates containing rich medium supplemented with either glucose (YPD) or glycerol (YPG) at 30°C or 37°C. (B) Schematic illustration of the mitochondrial phospholipid metabolism. OM, outer membrane; IMS, intermembrane space; IM, inner membrane; PA, phosphatidic acid; CDP-DAG, cytidine diphosphate diacylglycerol; PGP, phosphatidylglycerol phosphate; PG, phosphatidylglycerol; CL, cardiolipin; MLCL, monolysocardiolipin; PS, phosphatidylserine; PE, phosphatidylethanolamine. (C) Deletion of CQD1 from cells lacking Ups1 or Crd1 results in a synthetic growth defect. Cells were treated as in A with the difference that they were shifted to synthetic medium containing glucose (SCD) 30 h before growth analysis on SCD plates. (D) The conserved amino acids K275 and D288 in the predicted protein kinase-like domain are important for the stability of Cqd1. Cells bearing either the empty plasmid (Ø) or plasmids carrying the respective cqd1 alleles were grown in SCGal. Crude mitochondria were isolated and the Cqd1 levels were analyzed by immunoblotting using an anti-Cqd1 antibody. Upper panel, immunoblot of one representative experiment. The asterisk indicates a cross reaction of the anti-Cqd1 antibody. Lower panel, quantitative analysis of Cqd1 steady-state level in the different strains analyzed in three biological replicates. Quantification was undertaken with Image Studio software. Error bars indicate s.d. **P≤0.01; ***P≤0.001 (one-way ANOVA with subsequent Tukey's multiple comparison test). (E) Glutamic acid 330 is essential for the function of Cqd1. Cells bearing either the empty plasmid or a plasmid carrying CQD1 wild type (WT) or cqd1(E330A) alleles were treated as in C. Images in A, C and E are representative of at least three repeats.
Fig. 3.
Fig. 3.
Cqd1 is involved in mitochondrial phospholipid homeostasis. Strains were grown in synthetic medium containing glycerol (SCG) and mitochondria were purified by sucrose gradient centrifugation. Phospholipids were extracted and analyzed by mass spectrometry. The level of each phospholipid species (percentage of total phospholipids) is shown as a mean±s.d. of four biological replicates. *P≤0.05 (Mann–Whitney test). PC, phosphatidylcholine; PE, phosphatidylethanolamine; PS, phosphatidylserine; PI, phosphatidylinositol; CL, cardiolipin; PG, phosphatidylglycerol; PA, phosphatidic acid; MLCL, monolysocardiolipin. Relative amounts of different species of single phospholipids are presented in Table S2.
Fig. 4.
Fig. 4.
Simultaneous deletion of CQD1 and UPS1 impairs mitochondrial protein import and dynamics. (A) Analysis of steady-state levels of mitochondrial proteins in wild-type (WT) cells and cells lacking Ups1, Cqd1, or both. Cells were grown in synthetic complete medium containing galactose (SCGal), and whole-cell extracts were analyzed by immunoblotting. (B) Formation of mitochondrial protein complexes. Strains were grown in SCG. Isolated mitochondria were lysed in digitonin-containing buffer (3% w/v) and cleared lysates were subjected to BN-PAGE. The assembly of the TOM complex and respiratory chain super complexes were analyzed by immunoblotting using antibodies against Tom40 or Cyt1. (C) Deletion of CQD1 in cells lacking Ups1 exacerbates accumulation of the precursor of Mdj1. Cells were grown in SCD, whole-cell lysates were prepared and analyzed by immunoblotting with specific antibodies. Pgk1 served as a loading control. p, precursor of Mdj1; m, mature form of Mdj1. The quantification was obtained from three independent experiments and shows mean±s.d. of the ratio of the Mdj1 precursor to the total amount of Mdj1. Quantification was undertaken with Image Studio software. *P≤0.05 (unpaired two-tailed Student's t-test). (D) Simultaneous deletion of CQD1 and UPS1 leads to strongly reduced processing of Mgm1. Whole-cell lysates from cells grown in SCD were analyzed by immunoblotting. l, long isoform of Mgm1; s, short isoform of Mgm1. The quantification was obtained from three independent experiments and shows mean±s.d. of the ratio of the short form to the long form of Mgm1. Quantification was undertaken with Image Studio software. **P≤0.01 (unpaired two-tailed Student's t-test). (E) Mitochondria in cells lacking Ups1 and Cqd1 are highly fragmented. Mitochondria were labeled by expression of mKate targeted to mitochondria. Cells were grown in YPD and shifted to SCD, harvested in their logarithmic growth phase and immobilized on slides covered with concanavalin A. PC, phase contrast. For quantification 100 cells were counted for each strain. Scale bars: 4 µm. (F) The synthetic growth defect of the double deletion mutant Δcqd1 Δups1 is not caused by loss of mitochondrial DNA. Cells of the indicated strains were grown to logarithmic phase on YPD, shifted to SCD and growth was analyzed by drop dilution assay on SCD and YPG plates at 30°C. Images in A, B and F are representative of at least three repeats.
Fig. 5.
Fig. 5.
Deletion of CQD2 restores the phenotypes of a Δcqd1 Δups1 double deletion. (A) Deletion of CQD2 in the Δcqd1 Δups1 background rescues the growth phenotype. Strains were grown to logarithmic phase and growth was analyzed by drop dilution assay on SCD plates at 30°C. (B,C) Mdj1 import and Mgm1 processing are restored in the Δcqd1 Δups1 Δcqd2 triple mutant. Cells were grown in SCD, whole-cell lysates were prepared and analyzed by immunoblotting. Pgk1 served as a loading control. (B) p, precursor of Mdj1; m, mature form of Mdj1. The quantification (Image Studio software) was obtained from three independent experiments and shows means of the ratio of the Mdj1 precursor to the total amount of Mdj1. (C) l, long isoform of Mgm1; s, short isoform of Mgm1. The quantification (Image Studio software) was obtained from three independent experiments and shows means of the ratio of the short form to the long form of Mgm1. Error bars indicate s.d. ***P≤0.001; ****P≤0.0001 (unpaired two-tailed Student's t-test). Images in A are representative of at least three repeats.
Fig. 6.
Fig. 6.
Cqd1 forms a novel contact site with Om14 and Por1. (A) Cqd1 is enriched in contact site fractions. Mitochondria from a Cqd1–3xHA-expressing strain were isolated, subjected to osmotic treatment, sonication and sucrose density gradient centrifugation. The gradient was fractionated, proteins were subjected to TCA precipitation and analyzed by immunoblotting. Top, the graph shows mean values of three independent experiments for the distribution of Cqd1–3xHA and the marker proteins for the outer membrane (Tom40), the inner membrane (Tim17) or contact sites (Mic27). Error bars indicating s.d. are shown in Fig. S1A. Bottom, immunoblot from one representative experiment. Load, 10% of material applied to gradient. (B) Mic10 and Mic60 do not co-precipitate with Cqd1. Mitochondria of wild-type (WT) and a yeast strain expressing Cqd1–3xHA were isolated and lysed in digitonin-containing buffer (1% w/v). Lysates were subjected to immunoprecipitation using anti-HA affinity agarose. The indicated fractions were analyzed by SDS-PAGE and immunoblotting. T, total lysate (5%); UB, unbound protein (5%); B, bound protein (100%). Asterisks indicate cross reactions of the antibodies against Mic60 or Om45. (C) Cqd1 does not co-precipitate with Mic10 or Mic60. Mitochondria of wild-type or yeast strains expressing Mic10–3xHA or Mic60–3xHA were analyzed as in B. T, total lysate (2.5%); UB, unbound protein (2.5%); B, bound protein (100%). The asterisk indicates a cross reaction of the anti-Mic60 antibody. As the cross reaction of the Mic60 antibody shows the same size as Mic60–3xHA, an immunodecoration of this membrane fragment with an anti-HA antibody is presented additionally. (D) Cqd1 forms high molecular mass complexes. Mitochondria isolated from wild-type and a yeast strain expressing Cqd1–3xHA were solubilized in digitonin (3% w/v). Cleared lysates were subjected to BN-PAGE. Cqd1–3xHA-containing complexes were detected by immunoblotting with an anti-HA antibody. Analysis of the MICOS complex using an anti-Mic26 antibody served as control. (E) Cqd1 interacts homotypically. Mitochondria of yeast strains expressing Cqd1–3xMyc in the presence of untagged or 3xHA-tagged Cqd1 were treated as described in B. T, total lysate (5%); UB, unbound protein (5%); B, bound protein (100%). The asterisk indicates a cross reaction of the anti-Myc antibody. (F) Cqd1 interacts with Om14. Mitochondria of wild-type and a yeast strain expressing Om14–3xHA were analyzed as in B. T, total lysate (2.5%); UB, unbound protein (2.5%); B, bound protein (100%). The asterisk indicates a cross reaction of the anti-Tom70 antibody. (G) Cqd1 interacts with Por1. Mitochondria of wild-type or a yeast strain expressing Por1–3xHA were analyzed as in B. T, total lysate (1%); UB, unbound protein (1%); B, bound protein (100%). The arrowhead indicates degradation products of Por1–3xHA. The asterisk indicates a cross reaction of the anti-Om45 antibody. (H) The Cqd1–Por1 interaction is independent of Om14. Mitochondria of wild-type cells, Por1–3xHA cells and Δom14 Por1–3xHA cells were analyzed as in G. Knockout was confirmed by PCR. The arrowhead indicates a degradation product of Por1–3xHA. (I) The Cqd1–Om14 interaction does not depend on Por1. Mitochondria of wild-type cells, Om14–3xHA cells and Δpor1 Om14–3xHA cells were analyzed as in F. Knockout was confirmed by PCR. The band detectable in Δpor1 Om14–3xHA (T and UB fractions) using the anti-Por1 antibody is probably a cross reaction with its paralog Por2. The asterisk indicates IgGs. (J) The contact site formed by Cqd1 and Om14 is independent of MICOS. Mitochondria of wild-type, Om14–3×HA and Δmic60 Om14–3×HA strains were analyzed as in F. The asterisk indicates a cross reaction of the anti-Mic60 antibody. Images in B–J are representative of at least three repeats.
Fig. 7.
Fig. 7.
Overexpression of CQD1 leads to dramatic changes in architecture and morphology of mitochondria. (A) Overexpression of CQD1 is toxic. Wild-type and Δcqd1 cells carrying an empty vector (pYES2 Ø) and Δcqd1 cells expressing CQD1 from a high-copy plasmid with a galactose-inducible promoter (pYES2-CQD1) were grown in SCD and shifted to SCGal prior to analysis. (B) Deletion or overexpression of CQD1 does not affect steady-state levels of mitochondrial proteins. Whole-cell extracts of wild-type and yeast cells in which CQD1 was deleted or overexpressed were analyzed by immunoblotting. Asterisks indicate cross reactions of the anti-Cqd1 antibody. The arrowhead indicates the potential precursor form of Cqd1. (C) Overexpression of Cqd1 results in strongly reduced levels of assembled F1FO ATP synthase. Isolated mitochondria of cells grown in SCGal were lysed in buffer containing digitonin (3% w/v) and cleared lysates were subjected to BN-PAGE. The assembly of the F1FO ATP synthase or the respiratory chain super complexes was analyzed by immunoblotting using antibodies against Atp2 or Cyt1. D, dimer of the F1FO ATP synthase; M, monomer of the F1FO ATP synthase; F1, F1 subcomplex of the F1FO ATP synthase. Upper panel, immunoblot for one representative experiment. Lower panel, quantification of signal intensities of the F1FO ATP synthase dimers and the respiratory chain super complexes [complex III dimer–complex IV monomer (III2–IV) and complex III dimer–complex IV dimer (III2-IV2)] present in the indicated strains of three biological replicates as determined by Image J software. Error bars indicate s.d. ***P≤0.001 (one-way ANOVA with subsequent Tukey's multiple comparison test). (D) Overexpression of CQD1 results in highly altered mitochondrial architecture. Cells were grown overnight in SCGal, subjected to chemical fixation with glutaraldehyde and osmium tetroxide, embedded in Epon, and ultrathin sections were analyzed by transmission electron microscopy. The white arrow highlights elongated inner membrane structures; black arrowheads highlight membranes presumably representing cross-sections of ER tubules. Scale bar: 500 nm. Additional electron micrographs are shown in Fig. S2. (E) Overexpression of CQD1 leads to the formation of mitochondria–ER clusters. Strains expressing mitochondria-targeted mCherry (mtmCherry) and ER-targeted GFP (ssGFP-HDEL) were grown to logarithmic growth phase in SCGal, fixed with formaldehyde, and examined by deconvolution fluorescence microscopy. Shown are maximum intensity projections of z stacks of entire cells (mitochondria) or of the center of the cells (ER, four consecutive z sections). DIC, differential interference contrast. Scale bar: 5 μm. (F) Strains expressing mitochondria-targeted GFP were analyzed as in E and mitochondrial morphology was quantified. Columns represent mean±s.d. values from two independent experiments with three biological replicates per strain and at least 150 cells per replicate. Representative images are shown in Fig. S3. Images in B and D are representative of at least three repeats.
Fig. 8.
Fig. 8.
The CQD1 and CQD2 overexpression phenotypes might be a result of altered topology. (A) Overexpression of the nonfunctional cqd1(E330A) allele is toxic. Wild-type cells carrying an empty pYES2 plasmid (Ø) and Δcqd1 cells carrying pYES2 plasmids to overexpress CQD1 WT or cqd1(E330A) were grown in SCD and shifted to SCGal prior to analysis. Growth was analyzed by drop dilution assay on SCD and SCGal. (B,C) Om14 and Por1 are not required for the growth defect caused by CQD1 overexpression. Cells of the indicated strains expressing CQD1 at wild-type level or overexpressing CQD1 were analyzed as in A. (B) Analysis of the CQD1 overexpression phenotype in the Δpor1 background. (C) Analysis of the CQD1 overexpression phenotype in the Δom14 background. (D) Simultaneous overexpression of CQD1 and CQD2 is almost lethal. Growth of wild-type cells carrying the indicated pYES2 and pYX233 plasmids to overexpress CQD1 and/or CQD2 was analyzed as in A. (E) Overexpression of CQD1 results in the formation of mitochondria–ER clusters in absence of Om14 and Por1. The indicated strains expressing mtmCherry and ssGFP-HDEL were grown to logarithmic growth phase in SCGal, fixed with formaldehyde, and examined by deconvolution fluorescence microscopy. Upper panel, maximum intensity projections of z stacks of entire cells (mitochondria) or of the center of the cells (ER, five consecutive z sections). DIC, differential interference contrast. Scale bar: 5 μm. Lower panel, quantitative evaluation of mitochondrial and ER morphologies. Columns represent mean±s.d. values from three independent experiments. In each experiment, mitochondrial morphology of at least 100 cells per strain was quantified. For the overexpression strains, also ER morphology of at least 50 cells with altered mitochondrial morphology was analyzed. (F) Overexpression of cqd1(E330A) and CQD2 also leads to the generation of mitochondria–ER clusters. The indicated strains were analyzed as in E. (G) Simultaneous overexpression of CQD1 and CQD2 exacerbates the mitochondrial morphology defect phenotype. Mitochondrial morphology of the indicated strains expressing mtmCherry was analyzed as in E. (H) Overexpression of CQD1 leads to an altered topology. Intact mitochondria from cells expressing CQD1 at wild-type level or overexpressing CQD1 were left untreated or were treated with proteinase K (PK). The indicated fractions were analyzed by SDS-PAGE and immunoblotting. Two different exposures of the anti-Cqd1 decoration are shown to better visualize Cqd1 at wild-type level. (I) Overexpression of CQD2 leads to an altered topology as well. Intact mitochondria from cells expressing CQD2 at wild-type level or overexpressing CQD2 were treated as in (H). Images in A–D, H and I are representative of at least three repeats.

Similar articles

Cited by

References

    1. Awad, A. M., Nag, A., Pham, N. V. B., Bradley, M. C., Jabassini, N., Nathaniel, J. and Clarke, C. F. (2020). Intragenic suppressor mutations of the COQ8 protein kinase homolog restore coenzyme Q biosynthesis and function in Saccharomyces cerevisiae. PLoS One 15, e0234192. 10.1371/journal.pone.0234192 - DOI - PMC - PubMed
    1. Böckler, S. and Westermann, B. (2014). Mitochondrial ER contacts are crucial for mitophagy in yeast. Dev. Cell 28, 450-458. 10.1016/j.devcel.2014.01.012 - DOI - PubMed
    1. Bohnert, M., Wenz, L. S., Zerbes, R. M., Horvath, S. E., Stroud, D. A., Von Der Malsburg, K., Muller, J. M., Oeljeklaus, S., Perschil, I., Warscheid, B.et al. (2012). Role of mitochondrial inner membrane organizing system in protein biogenesis of the mitochondrial outer membrane. Mol. Biol. Cell 23, 3948-3956. 10.1091/mbc.e12-04-0295 - DOI - PMC - PubMed
    1. Chacinska, A., Rehling, P., Guiard, B., Frazier, A. E., Schulze-Specking, A., Pfanner, N., Voos, W. and Meisinger, C. (2003). Mitochondrial translocation contact sites: separation of dynamic and stabilizing elements in formation of a TOM-TIM-preprotein supercomplex. EMBO J. 22, 5370-5381. 10.1093/emboj/cdg532 - DOI - PMC - PubMed
    1. Cherry, J. M., Hong, E. L., Amundsen, C., Balakrishnan, R., Binkley, G., Chan, E. T., Christie, K. R., Costanzo, M. C., Dwight, S. S., Engel, S. R.et al. (2012). Saccharomyces Genome Database: the genomics resource of budding yeast. Nucleic Acids Res. 40, D700-D705. 10.1093/nar/gkr1029 - DOI - PMC - PubMed

Publication types

MeSH terms

Substances